
 ?Mathematical formulae have been encoded as MathML and are displayed in this HTML version using MathJax in order to improve their display. Uncheck the box to turn MathJax off. This feature requires Javascript. Click on a formula to zoom.
Abstract
The agricultural system that incorporates eucalyptus is used by 75% of the agricultural producers in the east of DR Congo (Walungu and Kabare). However, the latter’s perception and results from some studies on the effect of eucalyptus exploitation on soil quality bring out a negative balance. This study characterized the state of soils by determining the soil quality index (SQI) in three land-use types to guide soil fertility management policies. A survey was conducted to collect preliminary data on the historical effect of eucalyptus on the soil from 300 producers. Subsequently, the soils were sampled in the three land-use types and analyzed to assess SQI through a statistical approach based on principal component analysis (PCA). Using R 4.05 package software and crop exploitation as the baseline, the three land-use types were compared using analysis of variance. Out of the 13 considered crucial for SQI assessment, findings highlighted nine soil quality indicators (Al3+, pH, silt, SOC, CEC, H2O, sand, clay, and BD). Soils with eucalyptus (SQI = 0.486 0.07) and crops (0.539 ± 0.034) alone had low SQIs, suggesting unfavorable soils for better production, whereas soils with crop-eucalyptus association had SQI equals to 0.655 ± 0.034, indicating moderate soils. The calculated SQI highlighted soils’ acidity, their ability to maintain plants’ chemical nutrients equilibrium, and clay and sand content as soil quality determinants. To further improve soil conditions, we raised the need to understand the long-term effects of eucalyptus on soils and the appropriate soil management as a result of the aforesaid results.
PUBLIC INTEREST STATEMENT
The intercropping and/or agroforestry system, which refers to the integration of trees in agricultural production, has a conceptual connotation that tends to allay concerns about the uncertainties of climate change, the deterioration of soil properties, as well as other environmental changes and socioeconomic advantages in agriculture. Undoubtedly, this perception is supported by the exploitation of eucalyptus. However, beyond the benefits that the latter offers, depending on the exploitation conditions and management policy adopted, it could also affect the agricultural productive quality of soils. The findings in this paper highlight the need for an effective soil management strategy exploited under eucalyptus agricultural purposes in the eastern region of the Democratic Republic of the Congo (South Kivu). Otherwise, eucalyptus exploitation would result in a long-term negative impact on soil fertility resilience.
1. Introduction
Soil is a dynamic resource whose evolution over time is mainly affected by the type of utilization it undergoes, determining its quality or productive suitability.
The fertility of agricultural soil defines its quality, which is intrinsically tied to its ability to produce sustainably. The latter has currently become an important concern to guide policies for sustainable management and improvement of agricultural production in tropical conditions where the soil fertility decline is registered over time. This is generally justified by the land-use types of soils and environmental conditions (Bünemann et al., Citation2018). Soil fertility decline is viewed as a development issue in developing countries where population growth is speeding up. Still, household livelihoods are less secure, depending on their agricultural resources and production capacity.
In sub-Saharan African countries, especially in the Great Lakes region, soils are at an alarming stage of degradation resulting in a decrease in fertility that disrupts agricultural production. This situation is caused by overexploitation, the land topography dominated by hills with very steep slopes leading to the problem of erosion, and modification of climatic factors (Heri-Kazi & Bielders, ca. Citation2020). Thus, the response of soils to such disturbances is one of the major uncertainties in assessing the ability of their landscapes to produce food for future generations (Doetterl et al., Citation2021). Under these conditions, techniques that might improve soil fertility resilience such as the use of trees that adapt to adverse climate and soil conditions for enhancing and maintaining soil properties, are of great importance.
For instance, recent studies have shown that, unlike monocultures, agroforestry intercropping may promote a variety of agroecosystem services by increasing yields, improving soil quality and soil carbon sequestration (Wang et al., Citation2022; Žalac et al., Citation2021; X. Zhang et al., Citation2021). Agroforestry may also increase soil carbon and total nitrogen and improve physical (Chen et al., Citation2019; Lian et al., Citation2019; Lu et al., Citation2015) as well as biological properties (Tang et al., Citation2020).
Due to its economic importance and its easiest adaptation (Zerga, Citationn.d.), it has been proven that eucalyptus is one of the most used tree species for reforestation in tropical and subtropical areas. In the Great Lakes region of Africa, particularly in the eastern part of the Democratic Republic of Congo (DRC/South-Kivu), preliminary data collected as part of this study through a survey showed that three-quarters of the population use eucalyptus in their fields. This exploitation of eucalyptus in South Kivu is justified by the management of soil degradation, the improvement of marginally productive soils, and its socio-economic importance such as wood production, construction, energy, and so on. However, some studies have shown that eucalyptus adversely affects soil physicochemical properties (Alemie, Citation2009; Demessie et al., Citation2012; Dessie, Citation2011; Mensah, Citation2016; Tererai et al., Citation2015; D. Zhang et al., Citation2012). In addition, the agroforestry system integrating eucalyptus should be used wisely for ensuring sustainable soil fertility management practices. Farmers perceive that eucalyptus trees have negative effects on their soil’s ability to produce. The issue related to the capacity of soils to produce is unanimously found in South Kivu (Walungu and Kabare) and associated, by many studies, with the increasing soil property deterioration that requires effective management (Heri-Kazi & Bielders, ca. Citation2020; Kangela et al., Citation2021; Karamage et al., Citation2016; Mushagalusa et al., Citation2021).
Since the soil’s ability to produce is tied to the type of soil and how it is used (Genot et al., Citation2009), knowledge and understanding of land use types is a prerequisite for any effective soil degradation and fertility management policy (Huang et al., Citation2021). Understanding the soil’s suitability requires an assessment of the soil’s potential to produce sufficiently through measurable indicators. The most commonly known and used indicators are the physical, chemical, and biological properties of the soil (Kinyangi, Citation2007). Given that, the use of the Soil Quality Index (SQI) becomes very interesting since it combines several indicators into a metric that quantifies the impact of agricultural management practices and provides practical information on soil quality (Cornelis et al., Citation2019; Kinyangi, Citation2007; Ojekanmi et al., Citation2020; Yu et al., Citation2018).
Many studies have addressed the SQI approach using several methods. However, the statistical modeling method of SQI based on principal component analysis (PCA) has been widely used, and its results are most correlated with agricultural production and crop yields (Mukherjee et al., Citation2014). Based on the results, this approach will be used in this study, which aims to characterize the soil quality status under three types of land use (eucalyptus, eucalyptus + crops, and crops exploitations) to improve the sustainable management of soil fertility in the eastern Democratic Republic of Congo.
2. Materials and methods
2.1. Field description
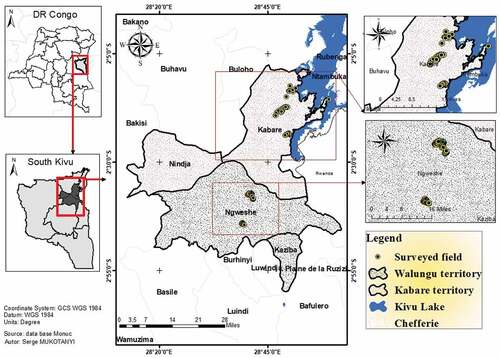
This research was carried out in the territories of Kabare and Walungu in the Democratic Republic of the Congo’s province of South Kivu, in the eastern part of the country. South Kivu is located at about 3° 01’ south and 28° 16’ east, with average elevations ranging from 1500 m in Kabare to 1700 m in Walungu. The environment is governed by two seasons (dry and rainy), with the dry season lasting 3 months between mid-June and mid-September and the rainy season, 9 months, offering the region a humid tropical mountain climate. The temperature changes seasonally, with an annual average of roughly 23°C in Kabare and Walungu (CAID (Cellule d’Analyses des Indicateurs de Développement, République Démocratique du Congo), mars, Citation2021). The survey and soil sampling were conducted in Kabare in the Groupement of Katana, Miti, and Bugore, and in Walungu in the Walungu and Lubona groupements. In each Territoire, five localities were chosen according to the availability of the Eucalyptus species and land accessibility. This study area is generally dominated by Ferralsols (Oxisols or Ultisols) characterized by aluminum toxicity and phosphorus deficiency (Kangela et al., Citation2021). Its soil, predominantly clay and sandy clay, is of the red ferralitic and laterite type (CAID (Cellule d’Analyses des Indicateurs de Développement, République Démocratique du Congo), mars, Citation2021; Kangela et al., Citation2021). Agriculture is the main household occupation in both territories, despite very modest agricultural production.
The selected land use types were typically around 1 ha on average for the Eucalyptus plantations, and 0.5 ha for the other two in both territories. Small-scale farming is therefore dominant due to the subsistence farming currently used. The soil is generally clayey, dominated by an aggregative structure for the crops and continuous for the Eucalyptus and Eucalyptus + crop land uses. These are Ferralsols (Oxisols or Ultisols) characterized by aluminum toxicity and phosphorus deficiency (Kangela et al., Citation2021). shows the map locating the survey sites in both territories (Walungu and Kabare)
Figure 1. Walungu and Kabare territoires maps in South Kivu province.
2.1.1. Sampling and soil indicators analysis
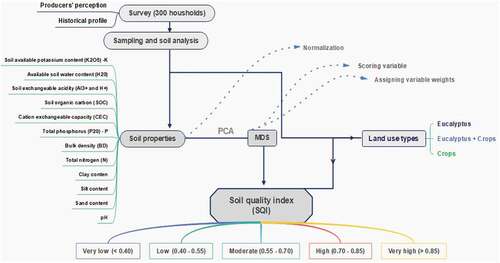
As illustrated in , the approach involved first, collecting preliminary data from 300 farmers surveyed on the historical profile of eucalyptus and their perception of its effect on soil fertility. Thereafter, soil sampling under the three land-use types for soil quality characterization was done. The characterization was done by determining the soil quality index based on soil quality indicators, which are physicochemical properties. Soil samples were randomly taken from those different land-use types. In the studied area, several staple crops (cassava, potato, cereals, vegetables, annuals, and so forth) are cultivated as main crops. However, cassava is common in farmers’ fields (Bisimwa et al., Citation2019), particularly in the land use types. Then, we considered it as a reference in the scenario of Eucalyptus + crop land, and crop exploitation. Twenty-four farms were sampled, 12 per territory and four samples per land use. In each selected field, the soil was sampled by auger from five points at a depth of 30 cm. A total of 96 samples were collected (either 48 per territory) to constitute 24 composite samples. These samples were analyzed at the Laboratory of Soil Science at the Université Catholique de Bukavu (UCB) by determining the following parameters: soil water content (H2O), bulk density (BD), pH, exchangeable aluminum (Al3+) content, total nitrogen (N), phosphorus (P) content, potassium (K), exchange cation capacity (CEC), soil organic carbon (SOC), clay, silt, and sand percentage.
Figure 2. The methodological approach used. Minimum dataset (MDS), Principal components analysis (PCA).
The soil samples were first homogenized, air-dried for 72 hours, crushed, and sieved to 2 mm before analyses. Thereafter, soil property analyses were done following the laboratory techniques used by the Université Catholique de Bukavu’s Laboratory of Soil Sciences. The analysis protocol used to assess all soil properties included in this research is detailed in (Okalebo et al., Citation2002). The global Robinson pipette method was used to determine different soil particle size distributions, namely clay, silt, and sand. The bulk (BD) density of undisturbed soil samples taken from cylinders 4.8 cm in diameter and 5.1 cm high at a depth of 15 cm was calculated after drying the samples in an oven for 48 hours at 105°C. The content of water (H2O) in the soil was calculated by subtracting the fresh-weight samples from the dry weight after drying them in an oven and weighing them with a 10−2g precision scale.
The pH was measured in water in a ratio of 1:2.5 (water:soil) suspension, using an electrode pH meter. The exchangeable acidity (Al3+ and H+) was obtained by titration with hydrogen chloride (HCl) after complexation with fluoride (F−). We used the Kjeldahl and Olsen methods to quantify the total nitrogen (N) and total phosphorus (P2O5; Olsen et al., Citation1954) from the soil, respectively. Ammonium acetate (NH4OAc) method with solution was used to extract the plant-available potassium fraction (K2O). The Walkley and Black technique was used to calculate soil organic carbon (SOC) (Walkley and Black, Citation1934).
2.1.2. Soil indicator scoring and weighting assignment
To describe the state of soil fertility under the three-land use, the statistical approach of principal component analysis (PCA) was used to determine the SQI since it uses certain mathematical tools (multiple correlations, factor, and cluster analysis) that avoid subjectivity encountered in other methods (Mukherjee et al., Citation2014). It involved creating a minimum data set (MDS) to reduce loads of soil indicators in the model and avoid redundant data.
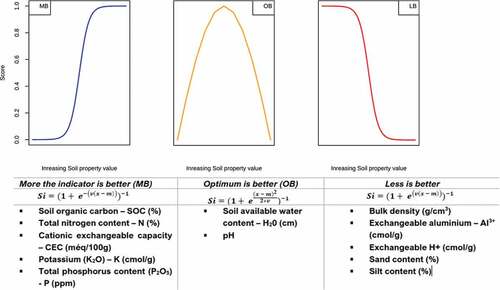
A total of 13 soil properties (H2O, SOC, CEC, P, N, BD, pH, K, Al3+, H+, Clay, Sand, and silt) were used to compute the SQI under the three-land use. The values of these indicators were normalized to obtain scores ranging from 0 to 1 (1 being the indicator’s optimum). The normalization allowed the combination of different indicators to easily determine the SQI and it used criteria of scoring functions presented in Figure , such as whether less soil element content is a better indicator (LB), whether high soil element content is a better indicator (MB); and whether optimal soil element content is a better indicator (OM). Based on the previous literature, three scoring functions for normalization were assigned to each indicator according to its known performance (Levi et al., Citation2021) and the pedological context of the studied area.
Figure 3. Scoring functions for data normalization. Si: soil indicator score, x is the measured value of the indicator, v and m are respectively the variance of data and mean of the indicator.
After normalization, a PCA was performed to detect soil properties explaining the soil quality and eliminate those that did not provide much information. Since PCA is a multidimensional analysis, it was carried out to reduce the number of indicators to a set that explains the state of soil fertility, thus constituting the minimum dataset (MDS). The number of axes retained depended on the eigenvalue of each axis, which normally determines the percentage of variability accounted for by an axis in the total data. Axes with an eigenvalue ≥1 were selected to explain soil fertility since an eigenvalue greater than one means that the axis represents more variance from a single original variable and can be retained to reduce dimensionality.
On the other hand, the retention of indicators in the MDS was done by considering their contribution to each principal component from PCA. They were retained for SQI determination if and only if the indicator is correlated with the component. To avoid redundant information within indicators that characterize each component, we excluded one of the highly paired correlated indicators by performing the predictive power score (PPS) method developed by Wetschoreck et al. (Citation2020). The PPS is a normalized index similar to the correlation coefficient ranging from 0 to 1. Its advantage is that it detects linear and nonlinear correlations and assumes asymmetry (i.e., PPS(X, Y) ≠ PPS(Y, X)). Thus, it was used to test the relationship between pairs of soil indicators; therefore, pairs of predicted scores with a PPS ≥ 0.5 were excluded in the MDS, and not correlated indicators with a high correlation with the axis and a high norm (Eq. 1) were retained. The norm value of the vector of each indicator represents the overall load of the indicator in all components (Wu et al., Citation2019). In the multidimensional analysis, the geometric meaning of the norm was important for the selection of soil indicators since it represents the length of the norm of the indicator’s eigenvector in the multidimensional space composed of principal components. The longer the norm length, the greater the overall contribution of the indicator to all principal components. Therefore, the higher the norm of an indicator, the more information it contains about soil quality.
Regarding the assignment of weights to variables; the weights of the MDS variables were determined from the PCA results (Yu et al., Citation2018) using Eq. 2 (Table )
Table 1. Norm and weights computation
2.1.3. The setting of the soil quality index
An SQI is a metric expressed as a linear combination of soil properties for quantifying changes in soil quality as a result of land-use change (Huang et al., Citation2021). Higher values of SQI indicate better soil quality. The equation (Eq.3) was used to calculate the SQI across the three land-use types. Table shows the different soil quality grades based on SQI considered on the basis of previous research (Dengiz, Citation2020; Huang et al., Citation2021; Nguemezi et al., Citation2020).
Table 2. Soil quality index
2.2. Statistical analysis
The PCA, correlation analysis, predictive power score, and analysis of variance (ANOVA) were carried out. The first three statistical approaches were performed step by step determining the SQIs, and the analysis of variance to compare the SQI across the three land-use types. The comparison was made considering the crop farms alone as the baseline. These analyses were performed using R 4.0.5 package software.
3. Results
3.1. Soil quality indicators
Overall, the soil properties differed similarly throughout the two territories. Accounting for the land use types, the same pattern is apparent for croplands and eucalyptus exploitation; however, the latter, have chemical properties, such as P (6.86 ± 7.21 ppm (Kabare) and 8.074 ± 7.61 (Walungu)), pH (4.847 ± 0.52 (Kabare) and 5.11 ± 0.99 (Walungu)), K (0.210 ± 0.135 cmol/kg (Kabare) and 0.560 ± 0.375 cmol/kg (Walungu)), which are relatively low compared to crops grown alone or in combination, and a high exchangeable Al3+ concentration, and H+ (Table ). Though the pH 5 and K content at Wulungu in the eucalyptus plantations appear close to the other land use types, their high standard deviations, however, reflect a strong variability. Looking at Al3+ and H+, both were observed at Walungu in the all-land use types, whereas at Kabare, their concentration is only found where eucalyptus alone is present.
Table 3. Soil chemical and physical properties under land use types and Territories
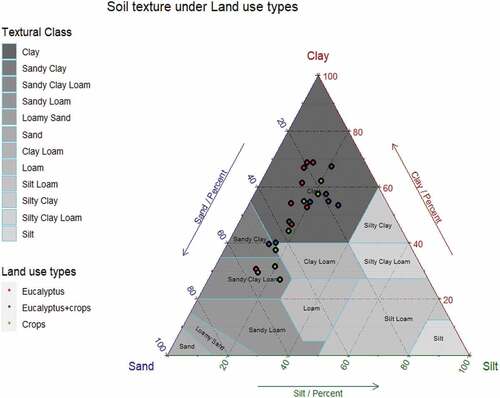
The USDA Textural Classification chart was used to determine soil texture under the three-land use. The results in Figure show that the predominant texture is clayey and characterizes most of the studied soils under eucalyptus farming and eucalyptus farming with crops. Sandy-clay or sandy-clay loam soil has been found as the second textural soil class.
Figure 4. The texture of the studied soils.
3.2. Soil quality index
From PCA we carried out (Figure ), four principal components with eigenvalues ranging from 1.027 to 4.104 were retained to describe the different indicators considered. They cumulatively express 75.87% of the variation of most soil fertility indicators. The loading values of different soil indicators on these principal components are presented in Figure as well and show their increase to PC1 and PC2 (panels (1-a) & (1-b)), and PC3 and PC4 (panels (2-a) & (2-b)). They represent the soil indicators’ principal component factor loads that explain the linear combination weights or the level of relationship between the soil properties and the considered principal components for characterizing soil status. Thus, Al3+, H+, pH, Silt, and K are grouped in PC1 (Figure ) representing 31.97% of the total variance expressed. For the PC2 (21.41%), PC3 (14.97%), and PC4 (7.90%) components, indicators such as N, SOC, CEC, H2O on PC2, Clay and Sand on PC3, and BD on PC4 are included, respectively (Figure ). The biplot (Figure ) shows soil indicators and different soil points analyzed in PCA on the four PCA components.
Figure 5. Soil indicators principal component factor load.
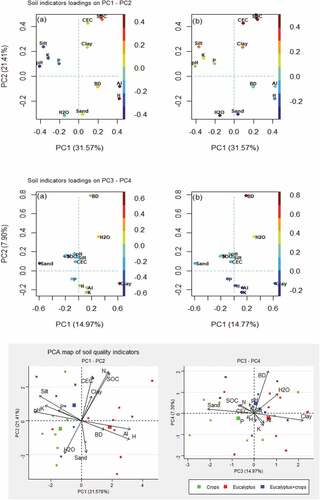
Figure 6. Predictive power score (PPS) matrix results for all the scored soil properties. The darker green shades represent stronger correlations between each pair of variables. Soil available water content (H2O), soil organic carbon (SOC), cation exchange capacity (CEC), phosphorus content (P), total nitrogen content (N), bulk density (BD), potassium (K), exchangeable aluminum (Al3+).
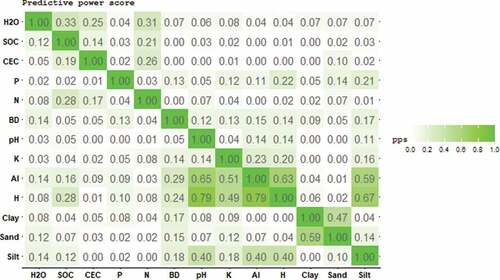
The predictive power score (PPS) matrix results for the 13 soil quality indicators (Figure ) revealed that Al3+ and pH were strongly correlated with H+ (PPS = 0.79). The relationships between Al3+ and Silt (PPS = 0.59), pH (PPS = 0.65), and K (PPS = 0.51), as well as Sand and Clay (PPS = 0.5), were also revealed. Though close to 0.5, the PPS between K and H+ was no longer accounted for since the possible contribution that these soil properties might provide to SQI determination has been captured in their relationships with Al3+ and pH, respectively. In addition to the results obtained from PCA by evaluating loadings on the four principal components considered (Figure ) and taking into account the values of the norm presented in Table , H+ and K were excluded from the indicators retained on the first principal component (PC1). Because of the opposite relationship between Al3+ and pH, and considering the importance of pH to understanding soil quality, both properties with Silt were retained in MDS for SQI assessment. SOC, CEC, and available soil water (H20) were retained on the second principal component (PC2), as were Sand and Clay on PC3 and bulk density (BD) on PC4. Thus, nine soil quality indicators from 13 initially defined, namely Al3+, pH, Silt, SOC, CEC, H2O, Sand, Clay, and BD, were selected to provide more information on soil quality and were used in MDS for SQI determination.
Table 4. Principal components, soil indicators’ commonality, norm, and weight values
Figure shows scores boxplots of retained indicators in the MDS that give an overview of their score values trend in different land use types. In contrast to chemical features, there is some similarity in the spread of physical properties’ scores in the three-land use types. In terms of chemical quality in farms where crops are grown alone or in combination with eucalyptus, exchangeable Al3+ (p-value <0.0001) and CEC (p-value 0.01) stand out from the rest in terms of contributing to the assessment of SQI with their score values. In terms of physical attributes, there are relative variances between the three forms of land use; nonetheless, the amount of clay in the soil contributes significantly (p-value <0.0001) more to the SQI determination than the other properties regardless of land use. In determining SQI, the weight gives information on the proportion of variation explained by indicators kept in the MDS. As a key outcome of the results reported in Table , it was mainly encountered that physical attributes had relatively high weight values. However, depending on whether they are grouped on principal components (Figure ), physical or not, PC1 has a greater weight value (0.416), followed by the other three principal components in increasing order.
Figure 7. Boxplot showing the indicators’ score value distributions under the three types of land use. The asterisks colored in red show significant differences between the indicators (* p-value < 0.05, ** p-value < 0.001, and *** p-value < 0.0001). Soil available water content (H2O), soil organic carbon (SOC), cation exchange capacity (CEC), phosphorus content (P), total nitrogen content (N), bulk density (BD), potassium (K), exchangeable aluminum (Al3+). A dotted line indicates the overall average score.
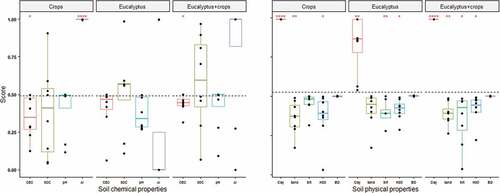
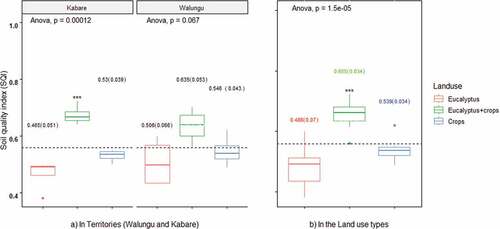
Figure shows the SQI calculated in the land-use types in the two territories (Walungu and Kabare). From the comparison made, we found that SQI values in the different land use varied similarly in the two territories, but soils in Kabare had slightly higher SQIs. We generally noticed strong evidence of higher SQIs in farms wherein eucalyptus was associated with crops (SQI = 0.655 ± 0.034, p-value <0.0001), and once accounted for the difference between the types of land use in each territory, that difference was revealed only in Kabare (Kabare, SQI = 0.674 ± 0.029, p-value = 0.00012, and Walungu, SQI = 0.635 ± 0.053, p-value = 0.067). Based on these findings, it was pointed out that soils under eucalyptus + crops should therefore be qualified as moderate SQIs (grade III, ranges from 0.55 to 0.70) and low SQIs for eucalyptus and crops farming as well (grade IV, ranges from 0.40 to 0.55).
Figure 8. Land use soil quality indices. The asterisks colored in black show relatively significant differences between land use types in the general case and each Territoire (*** p-value < 0.001). The dotted black line indicates the overall average soil quality index.
4. Discussions
The results revealed that nine out of 13 selected indicators (Al3+, pH, Silt, SOC, CEC, H2O, Sand, Clay, and BD) are essential to determine the current state of soil fertility. Based on the objective stated in this work, the evaluation of soil quality through the SQI requires evidence of the processes occurring in the soil (Cornelis et al., Citation2019; Ojekanmi et al., Citation2020; Yu et al., Citation2018). Furthermore, potential latent variables that spring up were suitable to be highlighted in this work depending on whether these indicators are grouped into the four principal components, as determinants of the current soil state. From the spread of indicators’ loadings on the principal components, we noticed that PC1 and PC2 characterized, respectively, the soil acidity and soil’s ability to maintain chemical equilibrium through the effects of CEC, SOC, N, and, potentially, clay. On the other hand, soil texture is typically characterized by the clay-sand couple on PC3 meanwhile PC4 determines the soil bulk density, which measures the structural soil functioning, such as the movement of water, nutrients, or soil aeration.
Furthermore, because the information contained in PC1 strongly contributed to the SQI determination (Table , weight = 0.416, or 41.60%), it may be shown that the status of soil quality wherein the importance of soil properties associated with PC1 was emphasized, might mainly be affected by the availability of mineral nutrients, a feature that practically depends on soil pH, an important indicator of the nutrients available to plants.
Thus, soils under eucalyptus with low pH values and high Al3+ values (Table ) may have a reduced capacity to supply nutrients to crops and an increase in exchangeable acidity (Al3+ + H+), resulting in toxicity to the crops grown there. Being inextricably linked to any effect underlining the soil acidity consideration as a determinant of studied soil conditions, soil’s ability to maintain chemical equilibrium underscores a soil’s long-term productive capacity through soil’s structure and stability, nutrient retention, and soil water management (Kinyangi, Citation2007), ensured by the main role of soil organic matter, CEC, H2O, and clay quantity. As a result of the pronounced acidic soils’ property (eucalyptus) and the comparatively low chemical characteristics found in the soils under crops (save for pH, BD, and H+), we discovered an imbalance in the soils under eucalyptus and crops alone. Although this imbalance is expected in the first case due to the inverse link between acidity variation (pH, Al3+, H+) and that of SOC, CEC; this result also raises the issue of eucalyptus’s deleterious influence on the physicochemical qualities of soil. Soil acidity and P deficiency, for instance, are two issues that have been raised in Walungu and Kabare (Kangela et al., Citation2021). Thus, this discovery not only confirms prior research findings but also emphasizes the importance of effective acidity management in eucalyptus-dominated soils used for agricultural purposes.
The observed improvement in soil properties in the eucalyptus-crop association may be explained by the fact that, in the field, eucalyptus is always combined with crops at its first stages of growing time at which its effect is not directly perceptible.
In terms of the soil quality index, our findings revealed that SQI was higher in fields with eucalyptus + crops and comparable in soils with eucalyptus alone and crops alone. The low SQI values seen under eucalyptus are almost entirely due to the acidic nature that characterizes these soils, as previously noted and highlighted. This is realistically justified by the drop in pH and increase in exchangeable acidity (Al3+ + H+), which imbalance the soil’s ability to maintain nutrient availability. The presence of eucalyptus should also be connected with the intensive absorption of nutrients from the soil, as shown by Demessie et al. (Citation2012), as well as probable soil acidification via its litter system through the release of various harmful and acidic compounds (terpenes).
Looking at agricultural soils’ status and crop responses, Huang et al. (Citation2021); Nguemezi et al. (Citation2020), and Dengiz (2019) showed that low SQI values indicate relatively unfavorable soils for plants in contrast to medium ones whose status indicates favorable conditions for plants although with constraints. In addition, Nguemezi et al. (Citation2020) found under sub-Saharan conditions that those constraints are particularly related to the following indicators: calcium, pH, soil organic matter, and P content for fertility classes (Table ). Hence, they revealed P deficiency, soil acidity, and in some cases CEC as major constraints that are practically due to the pedological status of soils and land-use types they undergo as noticed particularly in this study in soils under eucalyptus farming land use. To do so, cultural practices without sustainable management of soil fertility, such as the use of eucalyptus on the field for several years added to soil degradation (Heri-Kazi & Bielders, ca. Citation2020) might increase the observed deterioration of soil properties (Heri-Kazi & Bielders, ca. Citation2020; Kangela et al., Citation2021). This explains, unfortunately, not only the decline in the revealed soil quality but also the decrease in crop yields observed in the producers’ fields as outlined by Mushagalusa et al. (Citation2021), Heri-Kazi & Bielders, ca. (Citation2020). As a result of the high SQI values reported in the eucalyptus + crop association, including eucalyptus in agricultural production, appears to improve soil quality by increasing organic matter rate generation; which curiously appears to reflect an important contribution to agricultural soil quality. However, without defining an effective long-term management policy, it should inevitably lead to an imbalance in soil fertility through the establishment of acidity, phosphorus, and potassium deficiency as revealed in soil under eucalyptus (Table ). Despite the effect of the presence of eucalyptus with crops on soil appears paradoxical in light of what has been widely discussed above, the practical understanding is deduced from the fact that in association with crops, the time that takes its presence on soil would be of paramount importance as it may yield a less immediate negative effect.
Therefore, there is a need to develop management strategies and monitor agricultural practices to further improve soil conditions and ensure better production in the future. These strategies should define outcome-based management policies that take into account the combination of different soil properties such as the SQI determined in this study. We raised the need to understand the long-term effects of eucalyptus on soils and their management as a result of the aforesaid results.
Disclosure statement
No potential conflict of interest was reported by the author(s).
Additional information
Funding
Notes on contributors
Alain Kangela Matazi
Alain Kangela Matazi and Serge Mugisho Mukotanyi conceived the study
Alain Kangela Matazi designed the methodology and performed the analysis.
Elie Kany Luganda
Elie Kany Luganda participated in data collection and soil quality indicators analysis at the Laboratory
Serge Mugisho Mukotanyi
Alain Kangela Matazi designed the methodology and performed the analysis.
References
- Alemie, T., 2009. The Effects of Eucalyptus on Crop productivity, and Soil Properties in the Koga Watershed, Western Amhara Region, Ethiopia. Unpublished M.Sc. Thesis, Cornell University, 60p.
- Bisimwa, E. B., Birindwa, D. R., Yomeni, M. O., Rudahaba, N., Byamungu, K., & Bragard, C. (2019). Multiple cassava viruses’ co-infections and resurgence of pests are leading to severe symptoms and yield losses on Cassava in the South-Kivu Region, Democratic Republic of Congo. American Journal of Plant Sciences, 10(11), 1969–16. https://doi.org/10.4236/ajps.2019.1011138
- Bünemann, E. K., Bongiorno, G., Bai, Z., Creamer, R. E., De Deyn, G., de Goede, R., Fleskens, L., Geissen, V., Kuyper, T. W., Mäder, P., Pulleman, M., Sukkel, W., van Groenigen, J. W., & Brussaard, L. (2018). Soil quality – A critical review. Soil Biology & Biochemistry, 120, 105–125. https://doi.org/10.1016/j.soilbio.2018.01.030
- CAID (Cellule d’Analyses des Indicateurs de Développement, République Démocratique du Congo), mars. (2021). Territoires de Walungu et de Kabare. Fiche des territoire. https://www.caid.cd/index.php/donnees-par-province-administrative/province-de-sudkivu/territoire-de-walungu/?secteur=fiche
- Chen, C., Liu, W., Wu, J., Jiang, X., & Zhu, X. (2019). Can intercropping with the cash crop help improve the soil physicochemical properties of rubber plantations? Geoderma, 335, 149–160. https://doi.org/10.1016/j.geoderma.2018.08.023
- Cornelis, W. M., Akodi, D., Komutunga, E., Agaba, C., Ahumuza, E., & Oratungye, K. (2019). Exploring visual soil evaluation and examination methods on highly-weathered tropical soil. Soil and Tillage Research, 195, 104360. https://doi.org/10.1016/j.still.2019.104360
- Demessie, A., Singh, B. R., Lal, R., & Børresen, T. (2012). Effects of eucalyptus and coniferous plantations on soil properties in Gambo District, southern Ethiopia. Acta Agriculturae Scandinavica, Section B — Soil & Plant Science, 62, 455–466. https://doi.org/10.1080/09064710.2011.644575
- Dengiz, O. (2020). Soil quality index for paddy fields based on standard scoring functions and weight allocation method. Archives of Agronomy and Soil Science, 66(3), 301–315. https://doi.org/10.1080/03650340.2019.1610880
- Dessie, E., 2011. Eucalyptus in East Africa. Planted Forests and Trees Working Papers, 27. Working Paper FP46/E FAO, Rome.
- Doetterl, S., Asifiwe, R. K., Baert, G., Bamba, F., Bauters, M., Boeckx, P., Bukombe, B., Cadisch, G., Cooper, M., Cizungu, L. N., Hoyt, A., Kabaseke, C., Kalbitz, K., Kidinda, L., Maier, A., Mainka, M., Mayrock, J., Muhindo, D., Mujinya, B. B., … Fiener, P. (2021). Organic matter cycling along geochemical, geomorphic, and disturbance gradients in forest and cropland of the African Tropics – Project TropSOC database version 1.0. Earth System Science Data, 13(8), 4133–4153. https://doi.org/10.5194/essd-13-4133-2021
- Genot, V., Colinet, G., Brahy, V., & Bock, L. (2009). L’état de fertilité des terres agricoles et forestières en région wallonne (adapté du chapitre 4 - sol 1 de “ L’Etat de l’Environnement wallon 2006-2007 “). Biotechnologie, Agronomie, Societe et Environnement. https://popups.uliege.be/1780-4507/index.php?id=3746&format=print
- Heri-Kazi, B. A., & Bielders, C, L. (2020). Dégradation des terres cultivées au Sud-Kivu, R.D. Congo : Perceptions paysannes et caractéristiques des exploitations agricoles. Biotechnologie, Agronomie, Societe et Environnement, 99–116. https://doi.org/10.25518/1780-4507.18544
- Huang, W., Zong, M., Fan, Z., Feng, Y., Li, S., Duan, C., & Li, H. (2021). Determining the impacts of deforestation and corn cultivation on soil quality in tropical acidic red soils using a soil quality index. Ecological Indicators, 125, 107580. https://doi.org/10.1016/j.ecolind.2021.107580
- Kangela, A., Munyahali, Z., Cizungu, N. L., & Rukiranuka, B. (2021). Adsorption du phosphore dans les sols plus exploités dans le territoire de Walungu à l’Est de la République Démocratique du Congo. Afrique Science Revue Internationale Des Sciences Et Technologie, 18, 155–170. https://www.afriquescience.net
- Karamage, F., Shao, H., Chen, X., Ndayisaba, F., Nahayo, L., Kayiranga, A., Omifolaji, J. K., Liu, T., & Zhang, C. (2016). Deforestation effects on soil erosion in the Lake Kivu Basin, D.R. Congo-Rwanda. Forests, 7(12), 281. https://doi.org/10.3390/f7110281
- Kinyangi, J. (2007). Soil health and soil quality: A review.
- Levi, N., Hillel, N., Zaady, E., Rotem, G., Ziv, Y., Karnieli, A., & Paz Kagan D, T. (2021). Soil quality index for assessing phosphate mining restoration in a hyper-arid environment. Ecological Indicators, 125(2021), 107571. https://doi.org/10.1016/j.ecolind.2021.107571
- Lian, T., Mu, Y., Jin, J., Ma, Q., Cheng, Y., Cai, Z., & Nian, H. (2019). Impact of intercropping on the coupling between soil microbial community structure, activity, and nutrient-use efficiencies. PeerJ, 7, e6412. https://doi.org/10.7717/peerj.6412
- Lu, S., Meng, P., Zhang, J., Yin, C., & Sun, S. (2015). Changes in soil organic carbon and total nitrogen in croplands converted to walnut-based agroforestry systems and orchards in southeastern Loess Plateau of China. Environmental Monitoring and Assessment, 187(11), 688. https://doi.org/10.1007/s10661-014-4131-9
- Mensah, A. K., 2016. Effects of eucalyptus plantation on soil physicochemical properties in Thiririka sub-catchment, kiambu county, Kenya. Unpublished M.Sc. Thesis, Applied sciences, Kenyatta University, 73p.
- Mukherjee, A., Lal, R., & Sainju, U. M. (2014). Comparison of soil quality index using three methods. PLOS ONE, 9(8), e105981. https://doi.org/10.1371/journal.pone.0105981
- Mushagalusa, M. A., Nkulu Mwine Fyama, J., & Tejada Moral, M. (2021). Potential threats to agricultural food production and farmers’ coping strategies in the marshlands of Kabare in the Democratic Republic of Congo. Cogent Food & Agriculture, 7(1), 1933747. https://doi.org/10.1080/23311932.2021.1933747
- Nguemezi, C., Tematio, P., Yemefack, M., Tsozue, D., & Silatsa, T. B. F. (2020). Soil quality and soil fertility status in major soil groups at the Tombel area, South-West Cameroon. Heliyon, 6(2), e03432. https://doi.org/10.1016/j.heliyon.2020.e03432
- Ojekanmi, A. A., Anne Naeth, M., & Huang, S. (2020). Calibration and application of quality-scoring functions using soil-forest productivity relationships in land reclamation. Ecological Indicators, 113, 106193. https://doi.org/10.1016/j.ecolind.2020.106193
- Okalebo, J. R., Gathua, K. W., & Woomer, P. L. (2002). Laboratory methods of soil and plant analysis: A working manual (The 2nd) ed. TSB-CIAT and SACRED Africa.
- Olsen, S. R., Cole, C. V., Watanabe, F. S., & Dean, L. A. (1954). Estimation of available phosphorus in soils by extraction with sodium bicarbonate. U.S. Department of Agriculture Circular N°939.
- Tang, X., Zhong, R., Jiang, J., Longfei, H., Huang, Z., Shi, G., Wu, H., Liu, J., Xiong, F., Han, Z., Tang, R., & Longfei, H. (2020). Cassava/peanut intercropping improves soil quality via rhizospheric microbes increased available nitrogen contents. BMC Biotechnology, 20(1), 13. https://doi.org/10.1186/s12896-020-00606-1
- Tererai, F., Gaertner, M., Jacobs, S. M., & Richardson, D. M. (2015). Eucalyptus Camaldulensis invasion in Riparian zones reveals few significant effects on soil physico-chemical properties. River Research and Applications, 31(5), 590–601. https://doi.org/10.1002/rra.2762
- Walkley, A., & Black, I. A. (1934). An examination of the Degtjareff method for determining soil organic matter, and a proposed modification of the chromic acid titration method. Soil science, 37(1), 29–38. https://journals.lww.com/soilsci/toc/1934/01000
- Wang, Z., Zhou, M., Liu, H., Huang, C., Ma, Y., Ge, H. X., Ge, X., & Fu, S. (2022). Pecan agroforestry systems improve soil quality by stimulating enzyme activity. PeerJ, 10, e12663. https://doi.org/10.7717/peerj.12663
- Wetschoreck, F., Krabel, T., & Krishnamurthy, S. (2020). 8080Labs/Ppscore: Zenodo release. Zenodo: London, UK. https://doi.org/10.5281/ZENODO.4091345
- Wu, C., Liu, G., Huang, C., & Liu, Q. (2019). Soil quality assessment in Yellow River Delta: Establishing a minimum data set and fuzzy logic model. Geoderma, 334, 82–89. https://doi.org/10.1016/j.geoderma.2018.07.045
- Yu, P., Liu, S., Zhang, L., Li, Q., & Zhou, D. (2018). Selecting the minimum data set and quantitative soil quality indexing of alkaline soils under different land uses in northeastern China. Science of the Total Environment, 616–617, 564–571. https://doi.org/10.1016/j.scitotenv.2017.10.301
- Žalac, H., Burgess, P., Graves, A., Giannitsopoulos, M., Paponja, I., Popović, B., & Ivezić, V. (2021). Modelling the yield and profitability of intercropped walnut systems in Croatia. Agroforest Syst, 1–12. https://doi.org/10.1007/s10457-021-00611-z
- Zerga, B. (n.d.). Ecological impacts of Eucalyptus plantation in Eza Wereda. https://internationalinventjournals.org/journals/IIJAS
- Zhang, X., Teng, Z., Zhang, H., Cai, D., Zhang, J., Meng, F., & Sun, G. (2021). Nitrogen application and intercropping change microbial community diversity and physicochemical characteristics in mulberry and alfalfa rhizosphere soil. Journal of Foreign Research, 32(5), 2121–2133. https://doi.org/10.1007/s11676-020-01271-y
- Zhang, D., Wu, F., Yang, W., Zhang, J., Zhang, J., Yang, W., Wu, F., Zhang, D., Wu, F., Yang, W., & Zhang, J. (2012). Effects of afforestation with Eucalyptus grandis on soil physicochemical and microbiological properties. Soil Research, 50(2), 167–176. https://doi.org/10.1071/SR11104