
 ?Mathematical formulae have been encoded as MathML and are displayed in this HTML version using MathJax in order to improve their display. Uncheck the box to turn MathJax off. This feature requires Javascript. Click on a formula to zoom.
Abstract
The aim of this study is to combine the Analytic Hierarchy Process (AHP) with sensory analysis for assessing the quality of stone fruits, such as peaches and nectarines. To this end, a multicriteria model based on the AHP is proposed, which could be used in any process of evaluation or selection of these fruits. It is compared with the Quantitative Descriptive Analysis (QDA) performed by trained panellists. The AHP results showed that gustatory phase was the most important attribute in both the positive (54%) and negative (80%) models. In the next level of attributes, the most important were sweetness and juiciness (63.1% of the weight for nectarines and 55.1% for peaches), while for rejection the most important attributes were the bitter, sour or astringent sensation of the gustatory phase (around 25% each attribute). The prioritisation obtained for the samples of fruits was the same as the QDA. AHP also provided the tasting profile of every panellist. With the AHP, time and costs are saved and accuracy of the results is improved. In the case of stone fruits, where variability is high throughout the season, the combination of QDA and AHP can help the food industry by matching consumer’s expectations better and faster.
PUBLIC INTEREST STATEMENT
Food quality is a complex phenomenon and so is its evaluation. In this study, QDA (Quantitative Descriptive Analysis) and AHP (Analytic Hierarchy Process) were combined to assess peaches and nectarines. It is demonstrated that AHP complements QDA, overcoming many of the disadvantages of this type of procedure. First, it saves time and money in training the panellists and also in carrying out the evaluation process. Second, it increases the accuracy of the results. Third, it detects the panellists who need to be sent for retraining more quickly. Finally, thanks to the information collected, you can guide the methodology of the physicochemical characterisation. In the case of stone fruits, where variability is high throughout the season, saving time and costs can help the food industry meet consumer expectations better and faster. This is why the results are of interest to food producers, retailers and marketing researchers.
1. Introduction
The health benefits of fruit and vegetable consumption are indisputable. To name a few, their consumption is related to the prevention of chronic diseases such as hypertension, diabetes, obesity, cardiovascular diseases and even some types of cancer (Bazzano, Citation2006; Key, Citation2010; Slavin & Lloyd, Citation2012; Van’t Veer et al., Citation2000). Despite numerous local, national and international campaigns on the multiple benefits of fruits and vegetables, their consumption is gradually decreasing (Baviera-Puig et al., Citation2021). One of the possible reasons may be that the quality of fruits in the market does not always meet consumer expectations (Divya et al., Citation2016; Onwezen & Bartels, Citation2011). Compared to other products, e.g., packaged items, fruits and vegetables have the disadvantage of high variability throughout the season. This is due to climatic factors and/or harvesting, storage and transport conditions (Gotor-Vila et al., Citation2017; S. K. Lee & Kader, Citation2000; López et al., Citation2007; Lurie & Crisosto, Citation2005). Specifically, in the peach and nectarine sector, the major breeding objective is to develop new genotypes that express the flavour before the fruit becomes too soft. Therefore, the goal is to find the right balance between quality and maturity at harvest time (Echeverría et al., Citation2015; Iglesias & Echeverría, Citation2009; Minas et al., Citation2018; Valero et al., Citation2007; Ziosi et al., Citation2008). All these factors make it difficult for the market to meet consumer expectations (Johnson & Ali Al Mukhaini, Citation2016).
One way to assess the fruit before delivering it to the consumer and estimate the overall acceptability is to perform sensory evaluation. This method is widely used in the food industry and is divided into two components: analytical and affective measurements. Analytical measurements can be used to detect differences (difference tests) or to describe the product (descriptive analysis). In turn, affective measurements determine which samples are preferred over others (Barrett et al., Citation2010; Taiti et al., Citation2017). Descriptive sensory evaluation offers a detailed profile of a product based on all measurable sensory characteristics (smell, taste, texture, touch and appearance). All these features are translated into a numeric value provided by trained panellists (rather than consumers) who examine the product. These values can be correlated to physicochemical instrumental analyses and other tests in order to drive product development and quality improvement (Torrico et al., Citation2018). One of the most extensively applied techniques to be found in the scientific literature is Quantitative Descriptive Analysis (QDA; González-Mohino et al., Citation2021).
Although sensory evaluation is one way to obtain integrated and complete information about food products, it also has its drawbacks. In the case of descriptive analysis with a trained panel, first of all, it is carried out by food experts who need a long time in training before final sensory evaluation (Peris & Escuder-Gilabert, Citation2009; Sidel & Stone, Citation1993). Second, it is a time-consuming and expensive process. In addition to the training period and the necessary continuous training, the personal and economic issues of the experts must also be taken into account (Qiu & Wang, Citation2015). Third, the data obtained may be imprecise due to inter-expert variability (where variation in the decision-making process can occur between the panellists) and intra-expert variability (where variation in the decision-making process of an individual panellist can occur over time; Vivek et al., Citation2020). Fourth, statistical methods that evaluate the data collected in sensory analysis are not effective due to the imprecision of the means obtained (Martínez, Citation2007). Fifth, sensory analysis does not measure the effect of quality attributes on the acceptance or rejection of a food product. This prevents us from knowing which attributes consumers value most when evaluating a product (Debjani et al., Citation2013). Finally, sensory evaluation has also been characterised by inaccuracy and uncertain repeatability (Kaushik et al., Citation2015; Meiselman, Citation1993).
All these drawbacks lead to the conclusion that the sensory evaluation could be improved. As Murray et al. (Citation2001) pointed out, further research is needed in the development of sensory analysis to meet the challenges of the future. So far, sensory analysis has been improved with fuzzy logic in order to represent the semantic aspect of sensory evaluation by humans. In this way, how food is perceived by people can be described. Thanks to this information, different samples can be ranked and evaluated (Faisal et al., Citation2017; S. J. Lee & Kwon, Citation2007; Shrivastava & Chakraborty, Citation2018; Sinija & Mishra, Citation2011). The use of fuzzy sets has also been combined with neural networks to improve the analysis and interpretation of sensory data (Tan et al., Citation1999; Wei et al., Citation2020). Multicriteria decision techniques have also been used in combination with sensory analysis. Fogliatto et al. (Citation1999) were the first to propose AHP and sensory analysis in product development. Later, Fogliatto and Albin (Citation2003) proposed the Indirect Pairwise Comparison (IPC) method for sensory data collection and analysis. Gurmeric et al. (Citation2013) compared different samples according to sensorial scores, performing different multicriteria decision techniques (AHP, SAW, ELECTRE and TOPSIS). Song et al. (Citation2020) developed AHP combined with entropy weighting method (AHP-EWM) and artificial neural networking (ANN) to improve judgment accuracy when assessing the rice fraud vulnerability in China. The multicriteria technique AHP is also an alternative when selecting sensory vocabulary to characterise and explain consumer preferences versus the ISO standard 11,035 (Ramírez-Rivera et al., Citation2020).
However, AHP can offer even more benefits to complement sensory analysis. In other words, all the advantages that AHP can bring when combined with sensory analysis have not been sufficiently exploited. In this paper, the aim was to study whether AHP can complement the QDA of stone fruits carried out by trained panellists in order to minimise the drawbacks defined above and better meet consumer’s expectations about fruit quality. Particularly, the AHP method will be applied to find out the weight of the attributes involved in the panellist judgment when evaluating the quality of nectarines and peaches, fruits belonging to the stone fruits group. AHP allows mixing different types of attributes, so they will be organised into “liking” and “disliking” quality attributes, to be able to analyse the aspects related to the acceptance and rejection of the fruit in more detail. To do so, an AHP model was built that allows us to examine both liking (positive) and disliking (negative) attributes separately. Therefore, the objectives of this research are:
i) To determine the most important quality attributes (positive and negative) when selecting nectarines and peaches.
ii) To establish the profile of the panellists, finding out which attributes are the most important for each panellist.
iii) To confirm that the AHP method presents the same prioritisation of results as the tasting sheet.
iv) To test the satisfaction of the panellists with the new methodology.
2. Materials and methods
2.1. The analytic hierarchy process
AHP is a discrete multicriteria decision-making (MCDM) technique (Saaty, Citation1980). It is used for decision-making processes such as selecting the best product from a number of alternatives or for allocating resources (Ishizaka & Labib, Citation2011; Tadesse & Negese, Citation2020). This technique structures the decision model in the form of a hierarchy with criteria and alternatives. The goal of the decision-making process (selecting the best fruit) is decomposed into a predefined number of criteria (attributes of the fruit). It is based on experts’ judgment (trained panellists) who have to elicit pairwise comparisons among elements. Panellists are asked to make two types of pairwise comparisons: (a) a pairwise comparison of the alternatives (fruits) with respect to the attributes; and (b) a pairwise comparison between the attributes. Each time, the expert must indicate which of the two elements in comparison is preferred following a nine-point scale. From the answers provided and following the mathematical principles of the method, an individual prioritisation for each of the elements of the hierarchy is obtained.
General AHP analyses tend to consider only positive priority for criteria (the higher the value of a criterion, the higher the user satisfaction). However, someone choosing a fruit takes into account both the liking (pleasure) and disliking (displeasure) aspects of the fruit in his or her decision process. Since the pleasure-displeasure relationship does not form an inverse relationship, i.e. a lack of pleasure does not necessarily represent a displeasure, it cannot be measured as a positive priority with an inverse relationship. For this reason, it is better to also consider negative priority in some of the attributes (the lower the value of a criterion, the higher the user satisfaction). In this paper, it is proposed to use the AHP model with two sub-networks; one exclusively for positive attributes (benefits) of the tasting and one exclusively for negative attributes (costs) of the tasting. To calculate the individual priority of each fruit, the priority obtained in each subnetwork is combined with the multiplicative aggregation (Saaty, Citation2004). Thus, the calculation of the individual priority of each alternative will be:
where Bi and Ci are the priorities obtained by alternative i in the Benefits and Costs sub-networks.
2.2. Methodological approach of the research
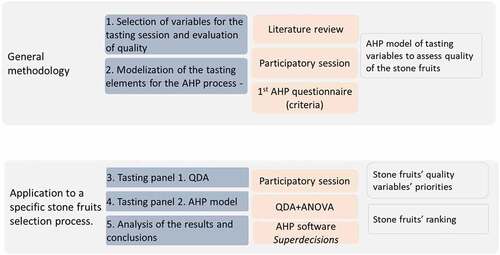
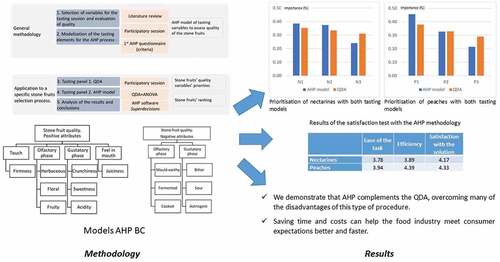
The proposed methodology is structured as shown in Figure . Here, we detail all the methodological steps, adding the results of the case study on peaches and nectarines for a better understanding.
Figure 1. Research methodology.
2.3. Data analysis
First, Statgraphics Centurion XVII-X64 software (Manugistics Corp., Rockville, MD, USA) was used to perform statistical analyses of sensory and physicochemical results by analysis of variance (ANOVA). Fisher’s least significant difference (LSD) procedure was used at the 95% confidence level.
Second, the data obtained from the AHP questionnaires answered by each of the tasters were processed with the Superdecisions 2.10.0 decision support software. With this software it is possible to obtain the relative importance of each of the criteria of the model as well as of the stone fruits that were compared.
Finally, the results obtained with Superdecisions, on the one hand, and those obtained with QDA, on the other hand, were compared. The final data comparison and analysis was performed with an Excel spreadsheet.
3. Case study. Prioritisation of stone fruits with the proposed methodology
First, we will thoroughly describe the stages of the general methodology, aimed at obtaining a model of prioritisation for stone fruits based on their quality that will be useful in any stone fruit prioritisation process. This first part of the methodology will be used for any stone fruits prioritisation process regardless of the samples used.
3.1. Step 1. Literature review and selection of the variables for the stone fruit tasting panels
Peaches and nectarines belong to the same botanical classification Prunus persica L., with a similar morphological description. In fact, they are two varietal subgroups within the same species and both are included under the same standard TG/53/7 by the International Union for the Protection of New Varieties of Plants (UPOV).
According to the literature review and the work carried out during the participatory session with the expert tasters, the variables or criteria used for the selection process were determined. This positive/negative attribute classification is inspired by the rules of the International Oleic Committee (International Olive Council, Citation2005) for oil tasting in which the positive and negative attributes for the characterisation of an oil are established.
Positive attributes:
• tactile phase (touch): firmness.
• olfactory phase: herbaceous, fruity and floral.
gustatory phase: sweetness, acidity, crunchiness.
tactile phase in mouth (feel in mouth): juiciness.
Negative attributes:
• olfactory phase: mould-earthy, fermented, cooked.
gustatory phase: bitter, sour, astringent.
3.2. Step 2. Creation of the AHP BC models for each of the two types of fruit
Once the criteria that determine the selection of stone fruits have been identified and classified into two groups, positive and negative, the two AHP Benefits and Costs (BC) hierarchies are designed. The results are presented in Figures . This classification into positive/negative was done with the help of the taster and following the way they have always rated these attributes before. In order to clarify the differences in the treatment of positive and negative attributes, two short examples will be given:
Figure 2. Hierarchy of positive attributes.
Figure 3. Hierarchy of negative attributes.
In the case of acidity, when comparing two samples, we are not asking the taster to tell us which of the two fruits is more acidic, but which of the two fruits has a better acidity from his or her point of view. This is why this attribute is part of the “positive” group, as we have asked the taster which one they like more.
However, in the case of an attribute such as bitterness, the taster is asked which fruit has a worse bitterness. Therefore, the attribute is part of the “negative” group, as we have asked the taster which one they dislike more.
To evaluate the possible differences detected by the trained panellists, the peaches and nectarines (10 pieces each) were analysed physiochemically with the following parameters:
Diameter: measured with a calliper and expressed in mm.
Weight: was taken individually on an electronic weighing balance.
Optical properties of peel (at three locations around the equatorial plane of each fruit) and homogenised pulp were determined using a spectropolarimeter (Konica Minolta, Inc., model CM-3600d, Tokyo, Japan). The results were expressed according to the CIE L*a*b* reference system with the D65 Standard Illuminant and 10° Standard Observer. Colour index was calculated as:
Soluble solids content was measured in previously homogenised samples using a refractometer (Zeiss, ATAGO PR101, Japan) at 20°C, obtaining the results in Brix degree (°Bx).
Titratable acidity was determined by potentiometric titration (905 Titrando, Metrohm) with 0.1 N NaOH of up to pH 8.1–8.2. Results were expressed as g of malic acid/L.
Firmness in three opposite zones of the whole fruit with peel was determined with a penetrometer (TR TURON SRL) with an 8 mm tip. The mean of the three measurements was expressed in N/cm2.
Next, we applied the methodology to specific fruit samples: the ones that were analysed in this panel. This specific part of the methodology should be repeated with each new experiment, as the fruit samples used vary from one time to another.
3.3. Step 3. Tasting panel 1. QDA
Both the nectarines and the peaches were tasted by a panel of 18 experts (henceforth panellists or tasters) who were previously educated and trained, with a total of 3 samples per tasting (3 samples for peaches and 3 samples for nectarines) and a repetition as a panel checking system in each of the sessions. The panel consisted of 9 men and 9 women.
The two tasting sessions were carried out on two different days. In the first session, the three nectarine samples (N1, N2, N3) were analysed. In the second session, the three peach samples were analysed (P1, P2, P3). Each piece was presented as whole fruit to the panellists, coded with two letters and in random order. The fruit came from different supermarkets from the city of Valencia.
At each tasting, two whole fruits for each sample were used, being of uniform size and with the exact date of harvest known. The fruits were removed from cold storage, equilibrated to room temperature, and placed as random samples of whole, intact fruit for tasting by the panellists (Li Teh et al., Citation2020).
Samples were served to the sensory panel, on the same day, between 10 and 12 o’clock, to ensure temperature and humidity control (Christofi et al., Citation2021). The tasting was carried out in a properly prepared room with individual booths.
Following the QDA, the fruit was analysed using an ascending scale with levels ranging from 1 (the lowest) to 10 (the highest). With this information, a sensory profile for the fruit was obtained (Amidei et al., Citation2017).
The attributes were selected based on pre-tests conducted with the trained panellists. They were asked to mark on a form those terms that best described the fruit characteristics. The frequency of use of each term reflects the number of users who employed it (Ares et al., Citation2015).
Panellists were asked to evaluate the following sensory attributes using the aforementioned 10-point intensity scale. These textural sensory attributes were similar to those described by Harker et al. (Citation2002) and finally the following attributes were determined: firmness, herbaceous, floral, fruity, juiciness, crunchiness, sweetness, acidity, mould-earthy, fermented, cooked, bitter, sour, astringent and overall acceptability (Blanda et al., Citation2008).
3.4. Step 4. Tasting panel 2. AHP model
The QDA tasting was followed by the AHP tasting. The same 18 trained panellists carried out this second tasting after 1 hour break between both tastings. The 18 tasting stations were prepared, each of them prepared with the three samples. All the tasting stands were identical. The same peach and nectarine samples as for the sensory panel were used.
Each of the panellists was presented with a questionnaire to carry out the paired comparisons required by the AHP. Two groups of comparisons were made, those between tasting attributes and those between fruit samples.
Since the attributes that appear in the AHP models were the ones they usually employ in their organoleptic session assessment sheet, it was not necessary to explain to them the meaning of the variables to assess. However, it was necessary to introduce them to the concept of AHP and its related paired comparisons, so that they would understand the format of the questionnaire handed to them. The process of explaining the questionnaire took about 30 min, and after that all the experts were able to complete it. This process took approximately another 30 min.
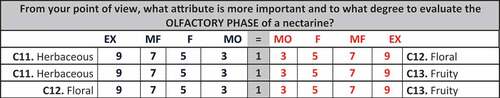
An example of a piece of this first AHP questionnaire is shown in Figure . This answer means that the taster’s opinion is: in order to evaluate the quality of a nectarine the smell of the nectarine is considerably more important than its touch.
Figure 4. A. Example of questions each taster received for the first level of attributes.
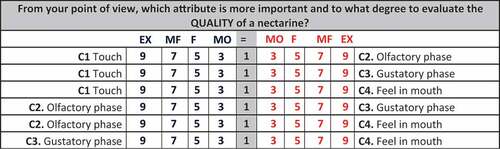
Figure 4. B. Example of questions each taster received for the second level of attributes.
The questionnaires were filled in by each taster individually and collected on the same day. Once the answers were gathered from all the panellists, they were processed with the help of the Superdecisions© software v. 2.4.0 (Creative Foundations. Pittsburgh, USA). The results of the weightings of all the variables were analysed both individually and as a group.
4. Results and discussion
4.1. Results for QDA
The results for the physicochemical analysis are shown in order to describe the fruits tasted. In Table , the characteristics of weight, diameter, CI of peel, CI of pulp, firmness, °Bx and acidity of each of the samples of nectarines (N1, N2, N3) and peaches (P1, P2 and P3) are presented.
Table 1. Characteristics of the samples of nectarines (N1, N2 and N3) and peaches (P1, P2 and P3) obtained by physicochemical analysis
As can be seen, sample N1 was slightly larger than the others, the weights being significantly different (p < 0.05) among the three samples. The peel colour index was very high as a consequence of the high value of component a* (reddish shades) compared to b* (yellow shades). On the contrary, the pulp colour index was much lower as a consequence of the predominance of yellow shades (higher value of b* than a*), with significant differences (p < 0.05) in sample N3 compared to N1 and N2. In addition, sample N3 had a higher firmness. The samples showed small significant differences in sugar content, but sample N3 was more acidic.
As for the peaches, the three samples were of the same size, although with significantly different weights (p < 0.05). The CI of the peel was in the region of yellow-orange shades, with the P2 sample having higher values of the b* component, so it presented more intense values in the orange range. However, pulp colour did not show significant differences between samples (p < 0.05). As for firmness, there were also significant differences (p < 0.05). The sugar content was similar in the three samples, although sample P2 was significantly less acidic than P1 and P3. Therefore, the sugar/acidity balance was higher in sample P2.
The sensory characterisation of the samples presented allowed us to obtain a characterisation of these samples as shown in Table . With this description, each of the samples presented to the tasters can be classified by every attribute and by an overall acceptability. As was observed in the physicochemical analysis, P2 is less acidic. In fact, it received a lower score (2.36) compared to P1 (2.54) and P3 (3.30). The P1, on the other hand, receives the highest score for sweetness (6.30), juiciness (6.70) and overall acceptability (6.81). As for nectarines, N3 was more acidic according to the physicochemical analysis and was identified as such by tasters (3.83 vs. 2.41 for N1 and N2). The highest overall rating was for N1 (5.90) which, in turn, received the highest juiciness score (5.40) and floral smell (3.80).
Table 2. Characteristics of the samples of nectarines (N1, N2 and N3) and peaches (P1, P2 and P3) obtained by sensory analysis
4.2. Results obtained for AHP model
4.2.1. Weights obtained for the attributes
The group results obtained for the attributes were calculated using the geometric mean of the individual expert judgements as recommended by Saaty and Peniwati (Citation2008). Furthermore, before proceeding with the aggregation of judgements, the judgements made by each of the experts were checked for consistency (Saaty, Citation1980). After analysis of the individual judgements for the two models of peaches and nectarines, it was concluded that two of the experts were too inconsistent (consistency ratio >0.20) for the nectarine model but consistent enough for the peach model. This is the reason why there are 18 experts for the peach trial and 16 experts for the nectarine (Fogliatto & Albin, Citation2003).
The group results are presented in Figures (where the Y-axis is the importance percentage of each attribute, expressed as a decimal). The most valued first-level positive attribute was gustatory phase (54% for both fruits), followed by feel in mouth (23.1% for peaches and 26.7% for nectarines), olfactory phase (15.2% for peaches and 13.6% for nectarines) and touch (7.2% for peaches and 5.8% for nectarines; Figure ). As for the negative attributes, both for peaches and nectarines gustatory phase showed much more importance than olfactory phase (80%-20%; Figure ). The first conclusion was that the weights assigned were very similar for both nectarines and peaches. This seems a very coherent result, since nectarines and peaches are similar types of fruit and the taster looks for similar properties when tasting them. Both peach and nectarines belong to the same botanical classification Prunus persica L. with similar morphological description. Consequently, it is sometimes difficult to differentiate their aroma and organoleptic peculiarities.
Figure 5. Comparison of first-level positive attributes.
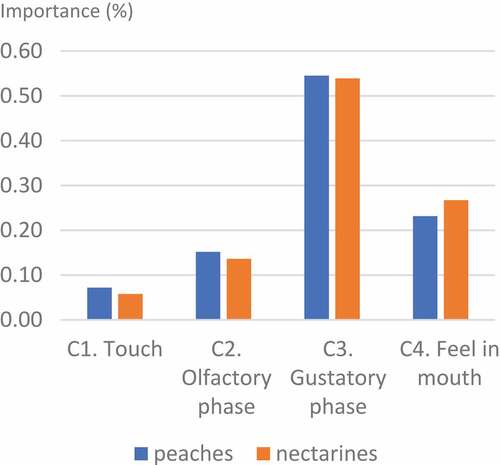
Figure 6. Comparison of second level positive attributes.
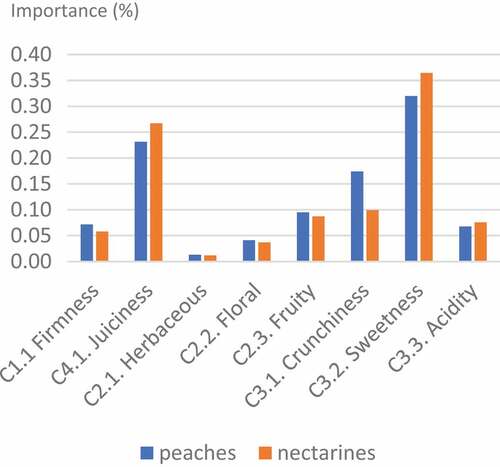
Figure 7. Comparison of first-level negative attributes.
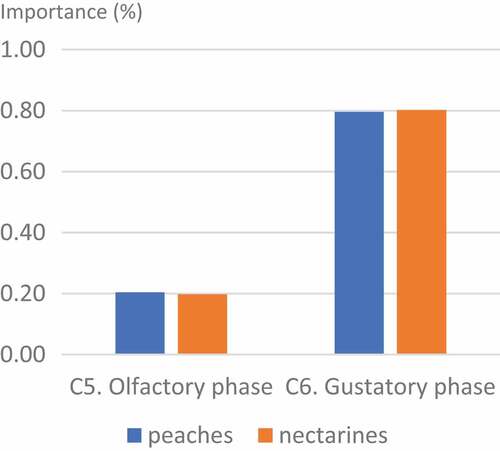
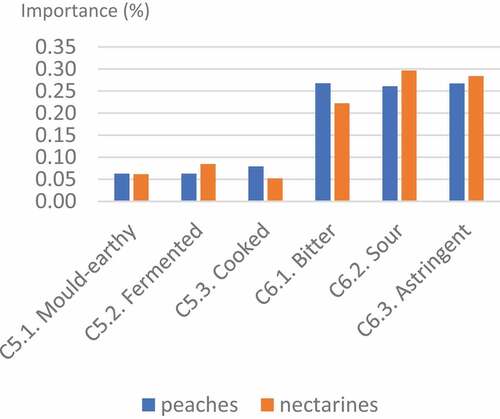
Figure 8. Comparison of second level negative attributes.
Within this great similarity of the weights obtained, perhaps the main difference in the positive criteria is found in the juiciness (feel in mouth variable). It can be observed that panellists gave slightly more importance to juiciness when evaluating nectarines. This result is in line with the fact that peaches are usually harder and more compact and consequently have a lower amount of water, following the trend of consumer taste over many years (Crisosto & Crisosto, Citation2005; Crisosto et al., Citation2006; Giné-Bordonaba et al., Citation2016). Any harder fruit with less water must be less juicy by its own composition, since the absence of water would imply the higher presence of soluble solids.
Regarding the second level positive attributes (Figure ), it was observed that by far the two most important criteria were sweetness and juiciness. Together they accounted for 63.1% of the weight in the case of nectarines and 55.1% in the case of peaches. On the other hand, the least valued attributes are herbaceous and floral smell (below 5%), and acidity and firmness (around 5–7%) in both fruits.
Regarding the second level negative attributes (Figure ), results showed that all these sub-criteria again presented similar results for both peaches and nectarines. From this Figure, it should be pointed out that the three sub-criteria belonging to the olfactory phase group obtained very similar weights (around 5–6% for all three). The three gustatory phase sub-criteria also obtained almost identical results for peaches (around 25%). However, when assessing the weights of the gustatory phase sub-criteria for nectarines, it seems that tasters did distinguish between them, assigning the greatest importance to sourness, followed by astringency and the least important to bitterness. Negative attributes of peach samples tend to be weighted more heavily when they are overripe. In this case, peach samples were tasted at the same stage of ripeness.
So, as a second conclusion it can be stated that in order to accept a stone fruit, the most important attributes are sweetness and juiciness, while to reject it the most important attributes are its bitter, sour or astringent sensation of the gustatory phase.
These results contrast with those found by Baviera-Puig et al. (Citation2021) in oranges, where the most important criterion when evaluating the quality of an orange using AHP is the fruity smell (17.58%). This may be due to the different composition of aromatic components in the two types of fruit. Thus, citrus peel is characterised by the presence of numerous essential oils, mostly terpenic in nature (>90%; Haypek et al., Citation2000). When the taster peels the orange, he/she breaks the cells containing these oils, releasing them and generating a significant release of aromatic components. In peach and nectarine peel, C6-compounds (>33%), lactones and alkanes (30% and 25%, respectively) predominate, while in orange, more than 50% of the total volatiles are lactones followed by C6-compounds and C13-norisoprenoids (26% and 17%, respectively; Aubert & Milhet, Citation2007; Xi et al., Citation2014). In the specific case of stone fruits, the olfactory characterisation is in the pulp, so it is sometimes more difficult for the taster to describe it by smell, thus giving priority to flavour (Tamaro, Citation1953).
With the prioritisation of the quality attributes (positive and negative), the first objective was achieved.
4.2.2. Tasting profile of the panellists
It is also interesting to establish the individual profile of each panellist. This way, the most relevant attributes for each panellist can be determined and we can even observe if there are tasters with similar or very different profiles. In Figures (where the Y-axis is the importance percentage of each attribute, expressed as a decimal), the intervariability present between tasters can be observed, an interesting result that shows how each panellist performs their own tasting and which could not be obtained by the QDA.
Figure 9. Comparisons among tasting profiles for nectarines.
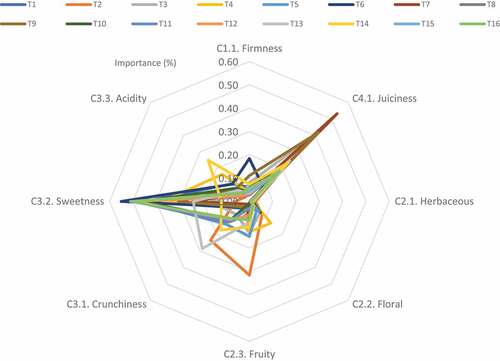
Figure 10. Comparisons among tasting profiles for peaches.
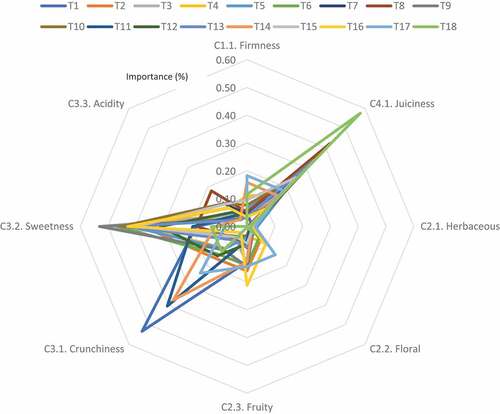
This intervariability is usually observed in the tasters by repeating one of the samples in each tasting. However, in the case of fresh fruit, the difference between the pieces of fruit from the same tree invalidates the use of these repetitions as a control system, as the number of repetitions would have to be very high. For example, in Figure it can be observed that the tasters whose positive attribute weights deviated greatly from the group are in this order: T2, T13. This result allows for the application of the usual retraining techniques for these panellists. In Figure , there are three criteria that were always highly rated by some of the panellists, and it can be seen who these panellists are. In this way, the individual profile of each taster is obtained, and the second research objective was achieved.
4.2.3. Prioritisation of the samples
Finally, the results obtained for the three samples of stone fruit analysed in each session were examined. The final aim was to compare them with the prioritisation obtained with the QDA to demonstrate if the new AHP tasting procedure worked well and was sufficiently accurate.
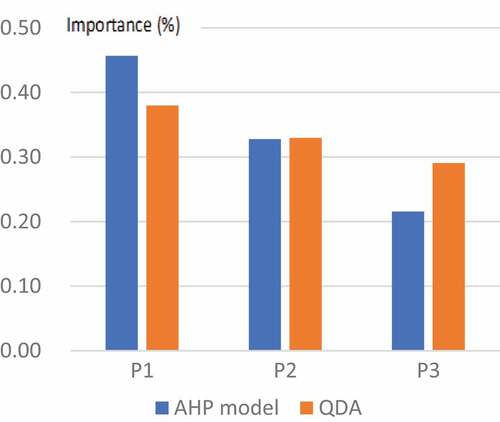
Figures (where the Y-axis is the importance percentage of each attribute, expressed as a decimal) show the results of the prioritisation of the two stone fruits with the two types of tasting panels, the QDA one and the one using AHP. Results show that in both cases, the order of preference of the three samples were the same: N1, N2, N3 for the nectarines and P1, P2, P3 for the peaches. With this outcome, the third research objective was achieved. When using QDA, the three samples of nectarines and peaches came out with scores closer to each other and in the case of the AHP prioritisation there was a greater difference in value between the three.
Figure 11. Prioritisation of nectarines with both tasting models.
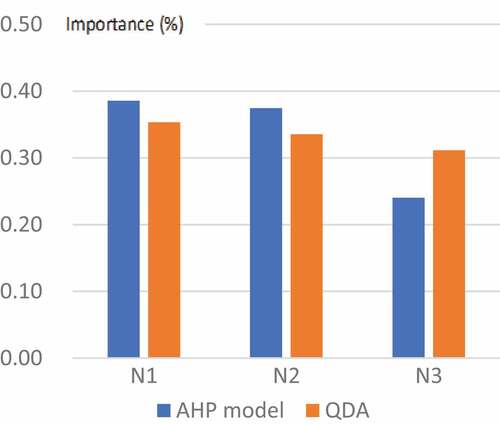
Figure 12. Prioritisation of peaches with both tasting models.
In Figures (where the Y-axis is the importance percentage of each attribute, expressed as a decimal), both the positive and negative scores obtained for the three samples are shown. It can be observed that N3 and P3 showed high values for the negative attributes, which considerably reduced their value in the final prioritisation. That was not the case in the QDA, since the cost and benefit attributes are not calculated with a quotient. The N1 and N2 had a very similar sugar/acidity ratio and higher than N3. The latter had a higher amount of acids, which was probably a factor influencing the final acceptability. In addition, sample N3 was harder and, despite having a similar size to the other samples, its weight was lower, which would be related to a lower juiciness. In this sense, juiciness was evaluated as one of the main positive attributes according to the AHP model. In the case of peaches, the same conclusions were drawn, with the P3 sample being more acidic and harder.
Figure 13. Prioritisation of nectarines according to positive and negative attributes.
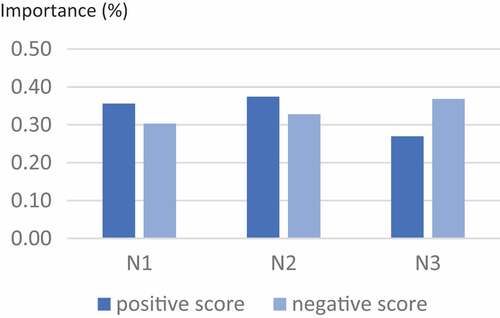
Figure 14. Prioritisation of peaches according to positive and negative attributes.
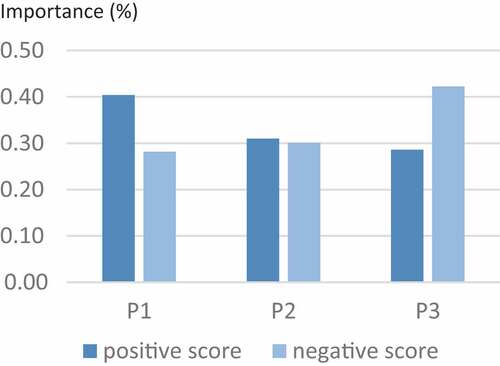
In nectarines and peaches, the fruit acceptance was always greater for non-acid than for acid cultivars, even at early or advanced stages of fruit maturity (Iglesias & Echeverría, Citation2009). Delgado et al. (Citation2013) also found out that sweetness correlated positively with overall liking and acceptance of fresh nectarines and peaches. These results are also consistent with those obtained by Baviera-Puig et al. (Citation2021) in oranges, where juiciness, sweetness and acidity received a relative weight of 16.51%, 16.10% and 12.37%, respectively. It seems that tasters value sweetness more than acidity when it comes to consuming oranges too.
4.2.4. Degree of satisfaction with the new combined methodology
The final results were presented to the panellists. As part of the analysis of the results of point 5 of the methodology, a study was conducted on the panellists’ degree of satisfaction with the AHP methodology used. They were familiar with QDA but were unaware of AHP and we wanted to analyse their opinion on the procedure carried out. The aim was to assess its difficulty, efficiency and satisfaction. Opinions were gathered by means of the questionnaire shown in Table . The average results obtained for each question are presented in Table .
Table 3. Questionnaire on satisfaction of the tasters with the AHP methodology
Table 4. Results of the satisfaction test with the AHP methodology
After the analysis of these results, it could be concluded: firstly, all the scores obtained showed an average value higher that 3.5, which means that the panellists were satisfied with the process. However, the question with the worst score was the ease of the task. This could be because the first time a person is confronted with the AHP questionnaire they may find it difficult. Although the panellists were given a brief introduction to the method before answering the questionnaire, the fact that they are asked several times about paired comparisons may seem somewhat incomprehensible to them. However, it can be observed that in the case of the peach test, this average value was improved, which may be because they found it easier the second time.
Tasters also considered that the process for prioritising was efficient, and the average improved at the second tasting. What did seem relevant was the high degree of satisfaction they showed after the process had been carried out. This might be because the tasters perceived that their opinions were taken into account throughout the process, but above all, because the final AHP ranking of the fruits analysed coincided with the QDA ranking. In light of these results, it could be concluded that AHP can help panellists in the difficult task of assessing the quality of fruit samples, thus achieving the fourth objective.
4.2.5. Future recommendations and suggestions
Sensory analysis contributes to determining food acceptability by the consumer. Despite its widespread use, there are a number of drawbacks, and attempts have been made to reduce them by combining it with AHP. Firstly, the need for long-term training of panellists. In the QDA, tasters evaluate the fruit on an absolute scale. This makes the training of tasters long and costly until they are able to assess the different attributes on a scale of 1 to 10. In contrast, with the AHP they compare two different pieces using a relative scale. This pairwise comparison is much easier than assessing with an absolute value and, consequently, less training is needed. In this sense, it could be very useful for consumer panels that are not trained as experts. Moreover, it has the advantage that tasters do not need to be trained specifically for each fruit. This allows companies or labs to move from one fruit to another more quickly without the need for specific training for each fruit. As a result, this reduces the costs and the time needed to prepare the sensory panels.
QDA in combination with AHP increases precision, as it reduces inter-expert variability with respect to attributes. Thanks to the consistency ratio of the AHP, tasters who deviate greatly from the group can be discarded and sent to retraining more quickly, as this information is not exclusively provided by the tasting sheet. Thus, these tasters do not participate in the evaluation of the samples until they are retrained and adapted to the panel. With QDA, the samples are only described and characterised. However, with the combination of both methodologies, the attributes and the samples are also prioritised. This data helps to measure the effect of quality attributes on fruit acceptance and goes beyond the usual averages provided by sensory analysis. Therefore, the combination of sensory panels and AHP improves the accuracy of the QDA. A further step could be taken by reducing the tasting sheet, eliminating those attributes with a lower weight and which are hardly valued by the tasters. Again, this would bring a reduction in the process time, so it would be shorter and faster.
AHP prioritises fruits not only for sensory analysis but also for physicochemical characterisation. The taster identifies which one is sweeter than another, but obviously not the absolute value. It can also focus the methodology to be used for characterisation on the laboratory. There again, time and costs can be saved.
5. Conclusions
Food quality is a complex phenomenon and so is its evaluation. In this study, QDA and AHP were combined to assess peaches and nectarines. It was found that gustatory phase was the most important attribute in both the positive (54%) and negative (80%) models. In the next level of attributes, to accept a stone fruit, the most important attributes were sweetness and juiciness, while to reject it the most important attributes were its bitter, sour or astringent sensation of the gustatory phase. Results were similar for both peaches and nectarines. Thanks to AHP, the tasting profiles of the panellists were defined and the samples were prioritised. This prioritisation was the same as for the QDA. Finally, the panellists showed their satisfaction with the combination of both methodologies.
As a conclusion, it is demonstrated that AHP complements QDA, overcoming many of the disadvantages of this type of procedure. First, it saves time and money in training the panellists and also in carrying out the evaluation process. Second, it increases the accuracy of the results. Third, it detects the panellists who need to be sent for retraining more quickly. Finally, thanks to the information collected, you can guide the methodology of the physicochemical characterisation. In the case of stone fruits, where variability is high throughout the season, saving time and costs can help the food industry meet consumer expectations better and faster. This is why the results are of interest to food producers, retailers and marketing researchers.
Abbreviations
AHP: Analytic Hierarchy Process.
AHP BC models: Analytic Hierarchy Process Benefits and Costs models.
AHP-EWM: AHP combined with Entropy Weighting Method.
ANN: Artificial Neural Networking.
CI: Colour Index
IPC: Indirect Pairwise Comparison.
MCDM: Multicriteria Decision Making.
QDA: Quantitative Descriptive Analysis.
UPOV: International Union for the Protection of New Varieties of Plants.
Ethics Approval obtained
This study was approved by the Research Ethics Committee of the Universitat Politècnica de València (UPV) (approval no. P04_17_06_21).
Informed consent statement
Informed consent was obtained from all subjects involved in the study.
Acknowledgements
The authors would like to thank the Spanish State Research Agency and the Spanish Ministry of Science and Innovation for their financial support in this research [grant number PID2020-118949RB-I00].
Disclosure statement
No potential conflict of interest was reported by the author(s).
Data availability statement
The data that support the findings of this study are available from the corresponding author, A.B-P., upon reasonable request.
Additional information
Funding
Notes on contributors
Amparo Baviera-Puig
Amparo Baviera-Puig is an Associate Professor at Universitat Politècnica de València (Valencia, Spain). Her primary research interests are in the area of consumer behavior in different areas. She is currently working on the selection of agri-food products. Her secondary research interests include the application of Multi-Criteria Decision Models (MCDM) in marketing and communication.
Mónica García-Melón
Prof. Mónica García-Melón is full professor at the Politechnic University of Valencia where she has been teaching for 25 years. Her main line of research focuses on the application of the Analytic Hierarchy Process (AHP) and Analytic Network Process (ANP) methodologies to create indicators that help evaluation and decision-making in participatory processes. She is also experienced in the use of social network analysis for studying processes of stakeholder engagement in participatory processes.
Isabel López-Cortés
Isabel López-Cortés is Professor of Woody Crops at the Department of Plant Production of the Universitat Politècnica of València. She is an official taster of the Olive Oil and Wine Tasting Panel of the Comunitat Valenciana, and she has years of experience as a taster and manager of tasting panels of fresh fruit and nuts.
María Dolores Ortolá
María Dolores Ortolá is a PhD in Agricultural Engineering and full professor of Postharvest Technology and Design of equipment for the food industry at the Universitat Politécnica de València (Spain). With more than 20 years of research experience, she has worked in the area of fruit and vegetable postharvest, design of new products, improving their nutritional profile and in the design of food processes. In all fields, she has included sensory analysis as a key point to evaluate consumer response to new foods.
References
- Amidei, R., Castellan, L., Missere, D., Grandi, M., & Lugli, S. (2017). Fruit sensory test of new sweet cherry cultivars. Acta Horticulturae, 1161(1161), 593–23. https://doi.org/10.17660/ACTAHORTIC.2017.1161.94
- Ares, G., Antúnez, L., Bruzzone, F., Vidal, L., Giménez, A., Pineau, B., Beresford, M. K., Jin, D., Paisley, A. G., Chheang, S. L., Roigard, C. M., & Jaeger, S. R. (2015). Comparison of sensory product profiles generated by trained assessors and consumers using CATA questions: Four case studies with complex and/or similar samples. Food Quality and Preference, 45, 75–86. https://doi.org/10.1016/J.FOODQUAL.2015.05.007
- Aubert, C., & Milhet, C. (2007). Distribution of the volatile compounds in the different parts of a white-fleshed peach (Prunus persica L. Batsch). Food Chemistry, 102(1), 375–384. https://doi.org/10.1016/J.FOODCHEM.2006.05.030
- Barrett, D. M., Beaulieu, J. C., & Shewfelt, R. (2010). Color, flavor, texture, and nutritional quality of fresh-cut fruits and vegetables: Desirable levels, instrumental and sensory measurement, and the effects of processing. Critical Reviews in Food Science and Nutrition, 50(5), 369–389. https://doi.org/10.1080/10408391003626322
- Baviera-Puig, A., García-Melón, M., Ortolá, M. D., & López-Cortés, I. (2021). Proposal of a new orange selection process using sensory panels and AHP. International Journal of Environmental Research and Public Health 2021, 18(7), 3333. https://doi.org/10.3390/IJERPH18073333
- Bazzano, L. A. (2006). The high cost of not consuming fruits and vegetables. Journal of the American Dietetic Association, 106(9), 1364–1368. https://doi.org/10.1016/J.JADA.2006.06.021
- Blanda, G., Lorenzo, A. E., Ae, C., Ae, A. B., & Ae, A. C. (2008). Phenolic content and antioxidant capacity versus consumer acceptance of soaked and vacuum impregnated frozen nectarines. European Food Research and Technology, 227(1), 191–197. https://doi.org/10.1007/s00217-007-0709-6
- Christofi, M., Mourtzinos, I., Lazaridou, A., Drogoudi, P., Tsitlakidou, P., Biliaderis, C. G., & Manganaris, G. A. (2021). Elaboration of novel and comprehensive protocols toward determination of textural properties and other sensorial attributes of canning peach fruit. Journal of Texture Studies, 52(2), 228–239. https://doi.org/10.1111/jtxs.12577
- Crisosto, C. H., & Crisosto, G. M. (2005). Relationship between ripe soluble solids concentration (RSSC) and consumer acceptance of high and low acid melting flesh peach and nectarine (Prunus persica (L.) Batsch) cultivars. Postharvest Biology and Technology, 38(3), 239–246. https://doi.org/10.1016/J.POSTHARVBIO.2005.07.007
- Crisosto, C. H., Crisosto, G. M., Echeverria, G., & Puy, J. (2006). Segregation of peach and nectarine (Prunus persica (L.) Batsch) cultivars according to their organoleptic characteristics. Postharvest Biology and Technology, 39(1), 10–18. https://doi.org/10.1016/J.POSTHARVBIO.2005.09.007
- Debjani, C., Das, S., & Das, H. (2013). Aggregation of sensory data using fuzzy logic for sensory quality evaluation of food. Journal of Food Science and Technology, 50(6), 1088–1096. https://doi.org/10.1007/S13197-011-0433-X/FIGURES/2
- Delgado, C., Crisosto, G. M., Heymann, H., & Crisosto, C. H. (2013). Determining the primary drivers of liking to predict consumers’ acceptance of fresh nectarines and peaches. Journal of Food Science, 78(4), 605–614. https://doi.org/10.1111/1750-3841.12063
- Divya, P. J., Jamuna, P., Jyothi, L. A., & Yildiz, F. (2016). Antioxidant properties of fresh and processed Citrus aurantium fruit. Cogent Food & Agriculture, 2(1), 1184119. https://doi.org/10.1080/23311932.2016.1184119
- Echeverría, G., Cantín, C. M., Ortiz, A., López, M. L., Lara, I., & Graell, J. (2015). The impact of maturity, storage temperature and storage duration on sensory quality and consumer satisfaction of “Big Top®” nectarines. Scientia Horticulturae, 190, 179–186. https://doi.org/10.1016/j.scienta.2015.04.022
- Faisal, S., Chakraborty, S., Devi, H., & Puranik, V. (2017). Sensory evaluation of probiotic whey beverages formulated from Orange powder and flavor using fuzzy logic Introduction. International Food Research Journal, 24(2), 703–710. http://www.ifrj.upm.edu.my/24%20(02)%202017/(34).pdf
- Fogliatto, F. S., & Albin, S. L. (2003). An AHP-based procedure for sensory data collection and analysis in quality and reliability applications. Food Quality and Preference, 14(5–6), 375–385. https://doi.org/10.1016/S0950-3293(03)00006-5
- Fogliatto, F. S., Albin, S. L., & Tepper, B. J. (1999). A hierarchical approach to optimizing descriptive analysis multiresponse experiments. Journal of Sensory Studies, 14(4), 443–465. https://doi.org/10.1111/J.1745-459X.1999.TB00127.X
- Giné-Bordonaba, J., Cantín, C. M., Echeverría, G., Ubach, D., & Larrigaudière, C. (2016). The effect of chilling injury-inducing storage conditions on quality and consumer acceptance of different Prunus persica cultivars. Postharvest Biology and Technology, 115, 38–47. https://doi.org/10.1016/J.POSTHARVBIO.2015.12.006
- González-Mohino, A., Jiménez, A., Rufo, M., Paniagua, J. M., Olegario, L. S., & Ventanas, S. (2021). Correlation analysis between acoustic and sensory technique data for cooked pork loin samples. LWT, 141, 110882. https://doi.org/10.1016/J.LWT.2021.110882
- Gotor-Vila, A., Usall, J., Torres, R., Solsona, C., & Teixidó, N. (2017). Biocontrol products based on Bacillus amyloliquefaciens CPA-8 using fluid-bed spray-drying process to control postharvest brown rot in stone fruit. LWT - Food Science and Technology, 82, 274–282. https://doi.org/10.1016/J.LWT.2017.04.034
- Gurmeric, V. E., Dogan, M., Toker, O. S., Senyigit, E., & Ersoz, N. B. (2013). Application of different multi-criteria decision techniques to determine optimum flavour of prebiotic pudding based on sensory analyses. Food and Bioprocess Technology, 6(10), 2844–2859. https://doi.org/10.1007/S11947-012-0972-9/TABLES/13
- Harker, F. R., Marsh, K. B., Young, H., Murray, S. H., Gunson, F. A., & Walker, S. B. (2002). Sensory interpretation of instrumental measurements 2: Sweet and acid taste of apple fruit. Postharvest Biology and Technology, 24(3), 241–250. https://doi.org/10.1016/S0925-5214(01)00157-0
- Haypek, E., Silva, L. H. M., Batista, E., Marques, D. S., Meireles, M. A. A., & Meirelles, A. J. A. (2000). Recovery of aroma compounds from Orange essential oil. Brazilian Journal of Chemical Engineering, 17(4), 705–712. https://doi.org/10.1590/S0104-66322000000400034
- Iglesias, I., & Echeverría, G. (2009). Differential effect of cultivar and harvest date on nectarine colour, quality and consumer acceptance. Scientia Horticulturae, 120(1), 41–50. https://doi.org/10.1016/J.SCIENTA.2008.09.011
- International Olive Oil Council, I. (2005). Method for the organoleptic assessment of extra virgin olive oil applying to use a designation of origin. COI/T.20/Doc. no. 22. INTERNATIONAL OLIVE OIL COUNCIL.
- Ishizaka, A., & Labib, A. (2011). Review of the main developments in the analytic hierarchy process. Expert Systems with Applications, 38(11), 14336–14345. https://doi.org/10.1016/j.eswa.2011.04.143
- Johnson, A. C., & Ali Al Mukhaini, E. M. (2016). Drying studies on peach and strawberry slices. 2(1), 1141654. https://doi.org/10.1080/23311932.2016.1141654
- Kaushik, N., Gondi, A. R., Rana, R., & Srinivasa Rao, P. (2015). Application of fuzzy logic technique for sensory evaluation of high pressure processed Mango pulp and litchi juice and its comparison to thermal treatment. Innovative Food Science & Emerging Technologies, 32, 70–78. https://doi.org/10.1016/J.IFSET.2015.08.007
- Key, T. J. (2010). Fruit and vegetables and cancer risk. British Journal of Cancer 2011, 104(1), 6–11. https://doi.org/10.1038/sj.bjc.6606032
- Lee, S. K., & Kader, A. A. (2000). Preharvest and postharvest factors influencing vitamin C content of horticultural crops. Postharvest Biology and Technology, 20(3), 207–220. https://doi.org/10.1016/S0925-5214(00)00133-2
- Lee, S. J., & Kwon, Y. A. (2007). Study on fuzzy reasoning application for sensory evaluation of sausages. Food Control, 18(7), 811–816. https://doi.org/10.1016/J.FOODCONT.2006.04.004
- Li Teh, S., Brutcher, L., Schonberg, B., & Evans, K. (2020). Eleven-year correlation of physical fruit texture traits between computerized penetrometers and sensory assessment in an apple breeding program. HortTechnology, 30(6), 719–724. https://doi.org/10.21273/HORTTECH04698-20
- López, M. L., Villatoro, C., Fuentes, T., Graell, J., Lara, I., & Echeverría, G. (2007). Volatile compounds, quality parameters and consumer acceptance of ‘Pink Lady®’ apples stored in different conditions. Postharvest Biology and Technology, 43(1), 55–66. https://doi.org/10.1016/J.POSTHARVBIO.2006.07.009
- Lurie, S., & Crisosto, C. H. (2005). Chilling injury in peach and nectarine. Postharvest Biology and Technology, 37(3), 195–208. https://doi.org/10.1016/J.POSTHARVBIO.2005.04.012
- Martínez, L. (2007). Sensory evaluation based on linguistic decision analysis. International Journal of Approximate Reasoning, 44(2), 148–164. https://doi.org/10.1016/J.IJAR.2006.07.006
- Meiselman, H. L. (1993). Critical evaluation of sensory techniques. Food Quality and Preference, 4(1–2), 33–40. https://doi.org/10.1016/0950-3293(93)90311-S
- Minas, I. S., Tanou, G., & Molassiotis, A. (2018). Environmental and orchard bases of peach fruit quality. Scientia Horticulturae, 235, 307–322. https://doi.org/10.1016/J.SCIENTA.2018.01.028
- Murray, J. M., Delahunty, C. M., & Baxter, I. A. (2001). Descriptive sensory analysis: Past, present and future. Food Research International, 34(6), 461–471. https://doi.org/10.1016/S0963-9969(01)00070-9
- Onwezen, M. C., & Bartels, J. (2011). Which perceived characteristics make product innovations appealing to the consumer? A study on the acceptance of fruit innovations using cross-cultural consumer segmentation. Appetite, 57(1), 50–58. https://doi.org/10.1016/J.APPET.2011.03.011
- Peris, M., & Escuder-Gilabert, L. (2009). A 21st century technique for food control: Electronic noses. Analytica Chimica Acta, 638(1), 1–15. https://doi.org/10.1016/J.ACA.2009.02.009
- Qiu, S., & Wang, J. (2015). Application of sensory evaluation, HS-SPME GC-MS, E-nose, and e-tongue for quality detection in citrus fruits. Journal of Food Science, 80(10), S2296–S2304. https://doi.org/10.1111/1750-3841.13012
- Ramírez-Rivera, E. D. J., Morales-Carrera, U. A., Limón-Rivera, R., Castillo-Martínez, S. I., Hernández-Salinas, G., Ramírez-Sucre, M. O., & Herrera-Corredor, J. A. (2020). Analytic hierarchy process as an alternative for the selection of vocabularies for sensory characterization and consumer preference. Journal of Sensory Studies, 35(1), e12547. https://doi.org/10.1111/JOSS.12547
- Saaty, T. L. (1980). The analytic hierarchy process: Planning, priority setting, resources allocation. Mc. Graw Hill. https://doi.org/10.3414/ME10-01-0028
- Saaty, T. L. (2004). Decision making-the analytic hierarchy and network processes (AHP/ANP). Journal of Systems Science and Systems Engineering, 13, 1–35. https://doi.org/10.1007/s11518-006-0151-5
- Saaty, T. L., & Peniwati, K. (2008). Group decision making: Drawing out and reconciling differences. RWS Publications.
- Shrivastava, C., & Chakraborty, S. (2018). Bread from wheat flour partially replaced by fermented chickpea flour: Optimizing the formulation and fuzzy analysis of sensory data. LWT, 90, 215–223. https://doi.org/10.1016/J.LWT.2017.12.019
- Sidel, J. L., & Stone, H. (1993). The role of sensory evaluation in the food industry. Food Quality and Preference, 4(1–2), 65–73. https://doi.org/10.1016/0950-3293(93)90314-V
- Sinija, V. R., & Mishra, H. N. (2011). Fuzzy analysis of sensory data for quality evaluation and ranking of instant green tea powder and granules. Food and Bioprocess Technology, 4(3), 408–416. https://doi.org/10.1007/s11947-008-0163-x
- Slavin, J. L., & Lloyd, B. (2012). Health benefits of fruits and vegetables. Advances in Nutrition, 3(4), 506–516. https://doi.org/10.3945/AN.112.002154
- song, H., Lu, B., Ye, C., Li, J., Zhu, Z., & Zheng, L. (2020). Fraud vulnerability quantitative assessment of Wuchang rice industrial chain in China based on AHP-EWM and ANN methods. Food Research International, 140, 109805. https://doi.org/10.1016/j.foodres.2020.109805
- Tadesse, M., & Negese, A. (2020). Land suitability evaluation for sorghum crop by using GIS and AHP techniques in Agamsa sub-watershed, Ethiopia. 6(1). https://doi.org/10.1080/23311932.2020.1743624
- Taiti, C., Elettra, M., Lanza, M., Azzarello, E., Masi, E., Pandolfi, C., Giordani, E., & Mancuso, S. (2017). Nashi or Williams pear fruits? Use of volatile organic compounds, physicochemical parameters, and sensory evaluation to understand the consumer’s preference. Eur Food Res Technol, 243, 1917–1931. https://doi.org/10.1007/s00217-017-2898-y
- Tamaro, D. (1953). Tratado de fruticultura. Gustavo Gili.
- Tan, J., Gao, X., & Gerrard, D. E. (1999). Application of fuzzy sets and neural networks in sensory analysis. Journal of Sensory Studies, 14(2), 119–138. https://doi.org/10.1111/J.1745-459X.1999.TB00108.X
- Torrico, D. D., Hutchings, S. C., Ha, M., Bittner, E. P., Fuentes, S., Warner, R. D., & Dunshea, F. R. (2018). Novel techniques to understand consumer responses towards food products: A review with a focus on meat. Meat Science, 144, 30–42. https://doi.org/10.1016/J.MEATSCI.2018.06.006
- Valero, C., Crisosto, C. H., & Slaughter, D. (2007). Relationship between nondestructive firmness measurements and commercially important ripening fruit stages for peaches, nectarines and plums. Postharvest Biology and Technology, 44(3), 248–253. https://doi.org/10.1016/J.POSTHARVBIO.2006.12.014
- Van’t Veer, P., Jansen, M. C., Klerk, M., & Kok, F. J. (2000). Fruits and vegetables in the prevention of cancer and cardiovascular disease. Public Health Nutrition, 3(1), 103–107. https://doi.org/10.1017/s1368980000000136
- Vivek, K., Subbarao, K. V., Routray, W., Kamini, N. R., & Dash, K. K. (2020). Application of fuzzy logic in sensory evaluation of food products: A comprehensive study. Food and Bioprocess Technology, 13(1), 1–29. https://doi.org/10.1007/s11947-019-02337-4
- Wei, Z., Ma, X., Zhan, P., Tian, H., & Li, K. (2020). Flavor quality evaluation system of Xinjiang milk knots by using SOM neural network and the fuzzy AHP. Food Science & Nutrition, 8(4), 2088–2093. https://doi.org/10.1002/FSN3.1501
- Xi, W., Zhang, Q., Lu, X., Wei, C., Yu, S., & Zhou, Z. (2014). Improvement of flavour quality and consumer acceptance during postharvest ripening in greenhouse peaches by carbon dioxide enrichment. Food Chemistry, 164, 219–227. https://doi.org/10.1016/J.FOODCHEM.2014.05.017
- Ziosi, V., Noferini, M., Fiori, G., Tadiello, A., Trainotti, L., Casadoro, G., & Costa, G. (2008). A new index based on vis spectroscopy to characterise the progression of ripening in peach fruit. Postharvest Biology and Technology, 49(3), 319–329. https://doi.org/10.1016/J.POSTHARVBIO.2008.01.017