
 ?Mathematical formulae have been encoded as MathML and are displayed in this HTML version using MathJax in order to improve their display. Uncheck the box to turn MathJax off. This feature requires Javascript. Click on a formula to zoom.
Abstract
Wheat is one of the staple crops widely cultivated in Arsi Zone of Ethiopia. It is the source of food and provides income for the majority of smallholder farmers. To this end, to benefit smallholders from their produce identifying and selecting the appropriate market is crucial. However, choosing a suitable market channel is not an easy task because there are different factors that influence market outlet choices. Hence, this study scrutinized the determinants of market outlet choice of smallholder wheat producers in Arsi Zone, Oromia National Regional State, Ethiopia. It uses primary and secondary data collected through questionnaires and desk reviews from 336 randomly selected households. Data were analyzed using multinomial logistic regression, percentage, and cross-tabulations of frequency distribution. The result from the multinomial logistic regression specifies that among the ten explanatory variables included in the model seven of them were statistically significant at 1%, 5%, and 10%. Those factors significantly affecting wheat producers’ market outlet choices were sex, age, education, year of participation, nearby market, nearby road and quantity produced. Based on the results, the study recommended that the government and stakeholders should focus on strengthening education, expansion of road infrastructure, telecom, and access to credit which promote farmers profitable market outlet choices in one hand and increases the production and productivity of wheat in another way.
PUBLIC INTEREST STATEMENT
Agriculture is the building block and backbone of Ethiopian economy since it generates income for the smallholder farmers and other actors involved in the chain, sources of employment, generate foreign income and play a crucial role to improve the food security and living standard of the community. Cereals are the main sub-sector in the agricultural sector of the country in terms of its share in rural employment, agricultural land uses, and calorie intakes of the community and in terms of its contribution to the national income. Among the cereal sub-sector wheat has been played a crucial role in the diet of the community, as sources of income and employment in the study area. The area is well known potential of wheat producer and identified as the wheat producing corridor by the government. Despite such a huge potential lack of efficient marketing, shortage of inputs, variability of climate and other structural problem, the benefit the smallholder received is low. Thus, studying the factors determining market channel choice is very important to benefit the smallholder.
1. Introduction
Cereal is one of the largest agricultural subsectors in Ethiopia. The subsector dominates in terms of its share in rural employment, agricultural land uses, and calorie intakes of the community and in terms of its contribution to the national income (Shahidur & Asfaw, Citation2013). Wheat is one of the main cereal crops in which Ethiopia is the second largest producers in SSA next to South Africa (Samuel et al., Citation2017; White et al., Citation2011). It is one of the most staple crops cultivated as sources of foods for consumers and source of incomes for producers (FAO, Citation2014 as cited in Minot et al., Citation2015). In fact, more than 4.5 million smallholder farmers engaged in wheat cultivation in the country (Minot et al., Citation2015; Samuel et al., Citation2017). Despite, wheat has been cultivated by state farms and commercial farms, its largest part dominated by smallholder farmers and almost all wheat production conducted under rain-fed conditions (Tadesse et al., Citation2017).
In this day, the total annual wheat production accounts for 3.43 million tons cultivated over 1.63 million hectares in Ethiopia (Tolesa et al., Citation2014). It covers an estimated 17% of the total land under the cereal crops with an average of 20.10 quintals per hectare. According to FAO (Citation2009), this is the lowest yield per hectares as compared to the world average of 40 quintals per hectare. Similarly, its yield in the country is very low as equated to Africa’s and world level which is lower as 13% and 32%, respectively. In line with this as compared to the wheat producing countries in Africa, wheat yield in Ethiopia is very low (2.4 ton/hectare). For example, wheat yields are 6.7 ton/ha in Egypt, 3.5 ton/ha in South Africa, and 3.0 ton/ha in Kenya (Minot et al., Citation2015).
The major sources of this low yield in the country mainly emanates from the limited access to inputs, financial services, improved production technology, irrigation and agricultural markets (Samuel et al., Citation2017). Ethiopia suffers from weak market linkages on both the input and output sides. Farmers either cannot afford improved inputs or lack the knowledge to use them. Weak systems connect agricultural outputs to processors and numerous barriers exist that prevent quality products from reaching end users, such as insufficient packaging and storing, the inability of Ethiopian products to meet international market standards, and restrictive trade regulations.
Market participation among wheat producers is very low, though growing overtime following the recent expansion of roads and urban centers in the country. Along with increase in production, good and efficient markets that are expected to transfer a fair proportion of consumers’ price to producers are important to enhance and sustain market participation of wheat producers, thereby creating conducive environment for the process of agricultural intensification to deepen further with a positive impact on poverty reduction (Samuel et al., Citation2017).
The decision made by wheat producers in Ethiopia on the choices of profitable market channel is one of the fundamental tasks. They use different market alternatives to supply their wheat produce to promote their livelihood and the income or profit earn from their production. As inferred from different empirical studies on various crops (Abebe et al., Citation2018; Hawlet et al., Citation2019; Tadie et al., Citation2019; Taye et al., Citation2018; Tewoderos et al., Citation2020; Yonnas et al., Citation2019) the main factors determining the decision of smallholder wheat producers market outlet choices are demographic, institutional factors, socioeconomic factors, infrastructural facilities, the existing market alternatives, prices, and transportation cost.
Cereal crops have been extensively cultivated in Arsi zone, particularly wheat, barley, teff, sorghum and pulses are pre-dominant (Yazachew & Kasahun, Citation2011). Farmers in Arsi Zone sale their wheat produces through various market outlet to increases or maximize expected utility or profit. Despite, farmers in the study area sales wheat via different market outlet, there is no empirical evidences has been done and well documented on the factors determine market outlet choice of smallholder wheat producers in the study area. Therefore, this study conducted with the main objective of identifying factors impeding market outlet choice of smallholder wheat producers in the area.
2. Review of related literature
Market participation among wheat producers is very low, though growing overtime following the recent expansion of roads and urban centers in the country. Along with increase in production, good and efficient markets that are expected to transfer a fair proportion of consumers’ price to producers are important to enhance and sustain market participation of wheat producers, thereby creating conducive environment for the process of agricultural intensification to deepen further with a positive impact on poverty reduction (Samuel et al., Citation2017). However, smallholder farmers’ decision to select appropriate market outlets can be affected by various factors such as demographic, institutional factors, socioeconomic factors and access of market outlets. There are different studies in different parts of the country that explored the major determinants of value chain development of cereal crops. For example: Hawlet et al. (Citation2019) studied the determinants of market outlet choice decision of tomato producers in Fogera woreda, South Gonder Zone, Ethiopia. The result from multivariate probit estimation indicate age of household heads, education status of tomato producers, market distance, owning transport facilities, access to credit, household size and land size were the main factors determine the tomato farmers market outlet choices.
Dessie et al. (Citation2018) analyzed factors affecting market outlet choice of wheat producers in North Gondar Zone, Ethiopia. The results of a multivariate probit model reveals that age of household, education status of the household, credit access, livestock number, off-farm income and total land-holding size of farmers significantly affected the market channel choice decisions in one or another way.
Eshetu et al (2022) studied the determinants of wheat value chain in case of North Shewa Zone of Amhara region, Ethiopia. The logistic regression result of the study implies that participation of off farm income, availability of market information, distance from market place, number of livestock owned by household, extension service and education were the main factors determine farmers market outlet choice at different significant level.
Tariku et al. (Citation2021) investigate on the determinants of cereal crops commercialization among smallholder farmers in Guji Zone, Ethiopia. The results of the study from ordered probit model estimation indicate that sex of the household heads, ownership of equines, cultivated land size, frequency of extension contact, credit use, value of crop produced and medium perception on lagged crop price were among the factors determine the commercialization of cereal crops at different significant level.
However, many of the aforementioned researches show the determinants of market outlet choices of different crops (Hawlet et al., Citation2019; Dessie et al., Citation2018; Eshetu et al., 2022; Tariku et al., Citation2021) and other several studies have been focused on the northern and southern area of the country. But this study inclined to the central part of the country which are considered as the wheat producing corridor and granary of wheat and barley in the country. To assess determinants of market outlet choice of producers of wheat multinomial logistic regression model were used. Thus, this study analyzed whether market outlet choice of smallholder farmers constrained by different factors or not.
3. Study area and methodology
3.1. Study area
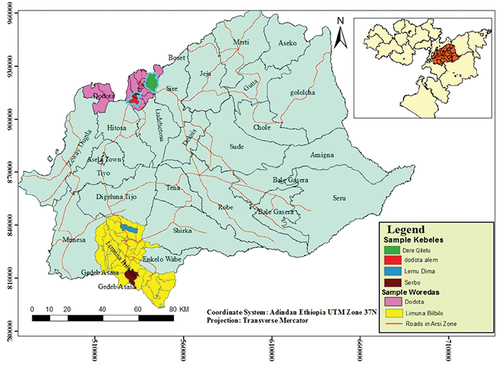
Arsi Zone is one of the zones in Oromia National Regional State found at 175 km from the capital city of the country. It gained the name Arsi from the Oromo ethnic groups that inhabit the area for a long period of time. It shares boundary lines with East Shewa Zone in the north and northwest, West Arsi Zone in the south and southwest, Bale Zone in the south, southeast, and east, West Hararge Zone in the north and northeast, and Afar National Regional State at the extreme north (Figure ). Astronomically the zone lies between 7°08ʹ58”N—8°49ʹ00”N latitude and 38°41ʹ55” E—40°43ʹ56” E longitude. Having a total area of 21,009 Km2, it accounts for about 5.8% of the total area of the Regional State (FEDOoAZ, Citation2010).
Figure 1. Map of the study area.
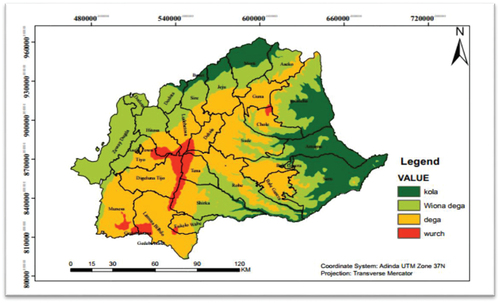
The climate of the zone is known by different agro-climatic zones due to its diverse altitude. It is predominantly characterized by moderately cool (40%) followed by cool (34 %) annual temperature (Figure ). The mean annual temperature of the zone ranges between 20–25°C in the lowland and 10–15°C in the central highland of the zone. The mean annual rainfall of the area varies from 633.7 mm at Dera station (located at an altitude of 1680 meters amsl) to 1059.3 mm at Bekoji station (located at an altitude of 2760 meters amsl). Generally, Arsi Zone receives abundant and well-distributed rainfall both in the amount and season (AZFECO, Citation2016; Yazachew & Kasahun, Citation2011).
Figure 2. Agro climatic map of Arsi Zone.
The area is known by diversified physiographic structures in which altitude varies between 805 meter (the lowest point) found at the extreme east of Seru district in Wabi Gorge and on 4195 meters (highest peak) at Mountain Kaka (Yazachew & Kasahun, Citation2011). The major physiographic division of the area includes mountain ranges, massifs, and high plateau, low plateau and associated lowlands, and lowlands (FEDOoAZ, Citation2010).
The zone is naturally endowed with numerous rivers and streams. It has a high network or density of perennial rivers and streams. The soils in the area are composed of diversified types and natures formed from current volcanic activities. This creates a conducive and fertile soil for different agricultural activities (FEDOoAZ, Citation2010). As a result of diversified physiographic structure (altitude), temperature, rainfall, and parent material from which soils are derived, the area hosts different kinds of natural vegetation. However, the natural vegetation which once densely and extensively covered the land of the area due to human interventions, currently found at some pockets of Munesa- Shashamene, Arbagugu, and Chilalo Galema State Forest and the eastern peripheral lowlands of Amigna, Seru and Gololcha and the lowland of Ziway Dugda (FEDOoAZ, Citation2010). The available natural forests of the area provide habitats for different kinds of wild animals. Despite the deterioration of wild animals due to human intervention on their habitats, the area possesses different species of wild animals such as Mountain Nyala, leopard, Menelik’s bushbuck, lion, warthog, and hippopotamus (AZFECO, Citation2016).
The total population of the area was 3,377,806 with 1,695,152 males and 1,682,654 females. The number of people inhabiting the urban area of the zone accounts for only 13.13% which is below the national level (AZFECO, Citation2016). This reveals a huge number of populations in the area live in the countryside. The dependency ratio is very high where the dependent population accounts for 47.58%. The crude population density of the zone is moderate (123 persons/km2) as compared to the most densely populated zones of the country (Yazachew & Kasahun, Citation2011).
Agriculture is the main economic activity in the zone where people engage in crop cultivation, livestock and poultry raising, and beekeeping. Rain-fed crop cultivation is the most dominant economic activity. Smallholder farmers share the largest total crop production and total land under cultivation which accounts for 96.2% and 96.45%, respectively. The main crops cultivated are cereals, pulses, oilseeds, vegetables, fruits, root crops, and others (Yazachew & Kasahun, Citation2011). As inferred from the same document the wheat production and productivity increased from year to year and also the land under wheat production show increment. However, smallholder farmers suffer from efficient and appropriate market which accommodate their produce and provide expected return for their produce.
3.2. Methods and materials
The theoretical perspectives, ontological and epistemic views, methodological strategies, and specific methods of data collection and analysis are the building blocks of the research. The theoretical perspective which is guided by the epistemic view, which in turn determines the methodological strategies and methods for data collection and analysis, should be defined and formulated clearly and comprehensively in the research (Crotty, Citation1998; Gray, Citation2004, Citation2017). This illustrates the existence of strong interrelationships between ontology, epistemology, methodology, and methods.
From the two quite opposite ontological stance in the western thought, the ontology of being which accentuates the presence of reality as represented by identifiable properties denoted by symbols, words, and concepts as opposed to formlessness, chaos, interpenetration, and absence ontology of becoming (Gray, Citation2004, Citation2017) has been adopted for this study. Ontology of being adopted for the study since household and different actors in the market outlet choices exist in reality which have identifiable properties explained by the existence of a movement of wheat crops from producers to different actors via various marketing channel.
In line with the ontological stance, it is important to consider the epistemic view which enlightens the way of understanding and explaining how we know what we know (Crotty, Citation1998). The epistemic view which guides this study are objectivism and constructivism since using one of them does not broadly and entirely pave a way to study determinants of market outlet choice of wheat producers.
Objectivism is an epistemic view which advocates the presence of reality independent of the human mind and the concern of the researcher is all about discovering this objective truth (Gray, Citation2004, Citation2017). The theoretical perspective which fits with this epistemic view and well-suited with the objective of the study is positivism. Its central argument is the presence of realities external to the researcher and these realities tested directly through scientific investigation. Therefore, in the wheat marketing outlet choices, data on socio-economic and demographic characteristics were objectively collected with questionnaires analyzed objectively with different statistical instruments.
The second epistemic stance adopted for the study is constructivism. Its main argument is truth and meaning do not exist in some external world but are created by the subject’s interactions with the world. Meaning is constructed not discovered, so subjects construct their own meaning in different ways, even in relation to the same phenomenon (Creswell, Citation2009; Crotty, Citation1998; Gray, Citation2004, Citation2017). Thus, the trust, belief, and attitude of the farmers to profit maximization and different channel choices were not understood and comprehended similarly or at the same level.
Though positivism and interpretivism emerge from a different epistemological perspective, they are under the umbrella of similar ontology, i.e. ontology of being. Thus, in order to study in detail and comprehensively the wheat value chain and come up with valid and reliable findings and a strong conclusion, we believe using both objective reality and subjective views in amalgamation is very crucial.
3.3. Research designs and approaches
Clark et al. (Citation2015) identify quantitative, qualitative, and mixed types of research approaches; and the three approaches are not as discrete as they first appear. The research approach adopted for this study is a mixed one since the wheat marketing outlet choices cannot be studied with only a single approach. Likewise, they argue that the researcher could employ mixed-method studies when they believe the use of both quantitative and qualitative data would provide a better understanding of the research problem. The use of quantitative or qualitative methods had some weaknesses, and the use of both (quantitative and qualitative) concurrently result in neutralizing the weakness of each method (Creswell, Citation2014). Similarly, Creswell (Citation2012) argues that the use of quantitative and qualitative research method (mixing the two) can help us to understand the problem and research question better than either method.
Thus, concurrent/convergent parallel mixed-method research design was employed for the study. According to Creswell (Citation2014) and Clark et al. (Citation2015), it refers to the collection of data simultaneously (quantitative and qualitative data), merges the data, and uses the result to understand the problem. They argued that the basic rationale for this study is that one data collection form supplies strengths to offset the weaknesses of the other form and that a complete understanding of a research problem results from collecting both quantitative and qualitative data. Thus, the issues of the wheat value chain cannot be studied alone quantitatively or qualitatively.
3.4. Sources, types, and tools of data collection
The necessary data for this study were generated from both primary and secondary sources. Primary sources were households selected as a sample from the sampling frame in the study area. Secondary sources were different documents and reports in the agricultural offices of the woreda and zone, processor office, and any other necessary documents accessed from the internet, available books, magazines, journals, and published or unpublished documents. The tools/instruments employed in the study were questionnaires (structured and unstructured), observation, and desk review based on the objectives intended to achieve.
3.5. Sampling procedures
Multistage sampling procedures have been used sequentially to select the two woredas from Arsi Zone, four kebeles from each woredas and rural farm household heads from each rural kebeles (the smallest administrative units in Ethiopia). First, after the woredas stratified according to their amount of wheat production in quintals, purposive sampling employed to select two woredas (Limu Bilbilo- from wheat-producing and Dodota-from less wheat-producing) from the study zone and two kebeles each from the selected woredas (Sarbo, Lemu Dima, Dire Kiltu and Dodota Alem) to generate sample households for the study. Second, once the study woredas and kebeles for the study identified based on the amount of wheat production, simple random sampling was employed to select the sample households from the selected sample kebeles for the study with the help of information obtained from DAs. This is due to the fact that it reduces the level of bias which might outbreak during the selection of the sample. Third, the total number of sampled households were generated from the target population (households in the selected kebeles) based on their proportion of total households (as seen in ).
Table 1. Distribution of sample size across selected woredas and kebeles
3.6. Sample size determination
Sample size determination is one of the technical areas which requires the researcher’s ability to decide the appropriate sample size for the study based on the purpose of the study. According to Cohen et al. (Citation2000), there is no clear-cut answer for how much sample size is appropriate for the study undergoes; rather it depends on the purpose of the study and the nature of the population under investigation. Therefore, in order to reduce the sampling error incurred due to inappropriate sample size, time for the study, heterogeneity or homogeneity of the population under study, costs for the study, and the like; it is important to limit the sample size under study. Thus, according to Kothari (Citation2004), if the study population is finite in number, the following mathematical formula is appropriately used to determine the sample size for the study. Therefore, at 95% confidence level, 5% significance level (degree of freedom is = 1–0.5 = 0.5), and the standard variate at 95% significance level is 1.96, the total sample size for the study is 336 households.
Where, n = refers to the number of sample size
P = degree of freedom
q = population proportion (q = 1—p = 1–0.5 = 0.5)
e = significance level
N = total population
z = the value standard variate at acceptable significance level (1.96 at 95%)
3.7. Methods of data analysis
To process and analyze the collected data value chain mapping, and Statistical Package for Social Sciences (SPSS) statistical software version 20 was used. Data collected through questionnaire survey was processed by using SPSS statistical software version 20. Descriptive statistics were used to analyze the survey data collected from smallholder wheat producers through a questionnaire survey in the study areas. The appropriate econometric model that can help to identify determining factors of wheat producer farmers market outlet channel choice was multinomial logistic regression model. The multinomial logit (MNL) model is used to analyse the determinants of smallholder farmers’ choice of market outlet in Arsi Zone of Ethiopia. This model suits such type of analysis as it permits the analysis of decisions across more than two categories, allowing the determination of choice probabilities for different categories. To describe the MNL model, let y denote a random variable taking on the values (1, 2, …, J) for J, a positive integer, and x denote a set of conditioning variables. In this study, Y is a dependent variable and represents the smallholder market outlet choice, whereas the X represents the factors that influence choice of market outlet which contains household attributes and P1, P2 … Pj as associated probabilities, such that P1 + P2 + … + Pj = 1. This tells as how a certain change in X affects the response probabilities P (y = j/x), j = 1, 2 … J. Since the probabilities must sum to unity, P (y = j/x) is determined once the probabilities for j = 2 … J are known.
In the MNL model, it is usual to designate one as the reference category. The probability of membership in other categories is then compared to the probability of membership in the reference category. Consequently, for a dependent variable with j categories, this requires the calculation of j − 1 equations, one for each category relative to the reference category, to describe the relationship between the dependent variable and the independent variables. The choice of the reference category is arbitrary but estimated as the most market outlet which accept the farm products. The estimation of MNL model for this study was conducted by normalizing one category which is named as “base category”. The market outlets were grouped into five because farmers used more than one outlet, and the base category was “processors.” The theoretical explanation of the model is that in all cases, the estimated coefficient should be compared with the base group or reference category. Therefore, the generalized form of probabilities for an outcome variable with j categories is:
For j > 1
The parameter estimates of the MNL model only provide the direction of the effect of the independent variables on the dependent (response) variable; estimates represent neither the actual magnitude of change nor the probabilities. Unbiased and consistent parameter estimates using this model need to assume independence of irrelevant alternatives that requires that the probability of using a certain market outlet choice method by a given household is independent of the probability of choosing another market outlet method. The summary of independent Variables mention in .
Table 2. Summary of independent variables used in multinomial logistic model
4. Finding and discussion
4.1. The socio-economic and demographic characteristics of wheat producers
The result from the finding in Table reveals that the sampled household heads which account for 80.95% were male and the rest 19.05% were female. The mean age of sample household heads was 50.96 years with standard deviation of 10.606 years, which indicates most of the respondent farmers were experienced in crop production. Likewise, the average age of household heads participate in wheat production was 23.92 which reveals that farmers in the study area have good experiences in wheat production. In terms of marital status, 86% of the farmers were married and only 0.30% were single. The rest 13.7% were divorced and widowed. The average family size for the sampled households in the study area was 5.52. Despite the government take different measures to control rapid population growth the mean family size in the study area is higher.
Table 3. The socio-economic and demographic characteristics of the households
The result of the study indicates that about 39.58% sample households were educated (attending formal education) while the remaining 60.42% were uneducated (never attend any form of formal education). It is obvious the educational background of the farmers determines their readiness to accept new ideas and innovation which influence the production and productivity of their produces. Thus, more educated farmers are expected to adopt new technologies to increases their production and productivity of wheat and have a knowledge to select appropriate marketing channel for their produces. For instance, Hawlet et al. (Citation2019) believe that the education boosts the knowledge of the producers can be used to collect information, interpret the information received, and make knowledgeable and marketing decisions. In terms of landholding, the mean landholding per household heads in hectares was 1.72. The landholding per hectare is one of the productive assets which determines the production of wheat. The number of household heads own their land or access to land were 97.92 while the remaining 2.08% were landless or have no their own land. The landless households fulfill land for wheat production through yearly renting, share cropping or long-term purchases. The number of household access to DA accounts for 90.77% and the remaining 9.23% were never. Accessible household heads to DA were beneficiary since they obtain training and advisory services on fertilizer application, wheat production, crop management, harvesting, and pre- and post-harvest handling. The average distance of the DA center from the farmers residence is 2.16 km. The number of household access to market information were 93.75% while the rest 6.27% were never. The respondents reveal that they access information from the market, brokers, radio, traders, relatives, and through telephone. Their main focus is price information in the nearby and woreda market. The producers of wheat miss buyers’ information, i.e., the preference of buyers which critically determine the price of the wheat within the market.
4.2. Wheat production and marketing channel
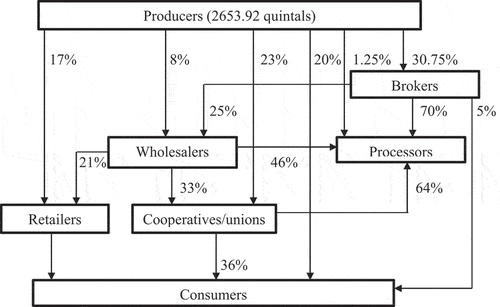
The study area is well known in the production of wheat and identified as the wheat production corridor by the government. The result from the sample households reveals that the total wheat production was 6879 quintals. From the total production only 38.58% present for the market while the rest 44.37% and 17.05% were used for home consumption and reserved for a future better market, and for seeds, respectively. The farmers in the study area sold their produces to purchase other food items, payment for school and health expenses, purchase of clothes for members of the households, payment for credit, and few due to surplus production.
5. Producers consumers
Producers → Retailers → Consumers
Producers → Brokers → Consumers
Producers → Union/Cooperatives → Consumers
Producers → Brokers → Processors → Consumers
Producers → Processors → Consumers
Producers → Brokers → Wholesalers → Processors → Consumers
Producers → Wholesalers → Retailers → Consumers
From the survey result the main alternative market channels were identified for wheat marketing. In Figure the marketing channel of wheat from its production until it reaches the final consumers was identified. Accordingly, the largest quantities of wheat products were received by brokers, unions/cooperatives, and consumers which share 30.75%, 23%, and 20%, respectively. The direct link of producers/farmers to the processors was very weak or low with a share of only 1.25%. This emanates from the null agreement between farmers and processors as the survey result revealed on one hand and the low capacity of the producers to deal with the processors on the other hand.
Figure 3. Wheat production and marketing channel.
5.1. Factors affecting market outlet choices
The wheat producer farmers in the study area have an option to sell their produce via different marketing channels. But the appropriate channel choice of the farmers determined by different factors. They are factors which determine the decision of farmers to choose suitable marketing channels such as different demographic, socio-economic and institutional factors. As clearly depicted in Table , the model had a likelihood ratio test with a Chi square statistic of 256.293 with 50 degrees of freedom and a corresponding p-value of 0.000. This reveals that the calculated Chi square statistics is greater than the tabulated at 5% significant level. Hence, at 5% significant level the coefficients of the respective variables are jointly significant in explaining variation in the choice of market outlet by the farmers. Then the model was tested for the validity of the independence of irrelevant alternatives using assumptions by Hausman specification test procedure.
Table 4. Model fitting information
The alternative “processers” was used as a base category (bench mark alternative). This implies that the discussion of the results focuses on the impact of the explanatory variables on a use of brokers, wholesalers, cooperatives, consumers and retailers category in relative to use of processors (the base category). Among the ten explanatory variables included in the model seven of them were statistically significant at 1%, 5% and 10%. Those factors significantly affecting wheat producers market outlet choices were sex, age, education, year of participation, nearby market, nearby road and quantity produced.
According to the result from multinomial logistic regression model in Table , the probability of farmers choose broker market channel was significantly determined by sex at 1% significant level, education, nearby market and nearby road at 5% significant level, and by amount/quantity produced at 10% significant level. The result from the study reveal that male headed households prefer to sell their wheat produce to processors than brokers as compared to female headed households. It is due to the fact that male headed households have better market participation, access to marketing information and better contact with different market dealers. The educational status/level of the households negatively affect the probability of choosing brokers at 5% significant level as compared to processors. As the literacy level of the farmers increases the probability of choosing brokers over processors declined by 86%, ceteris paribus. This implies that the more educated households sold their wheat produce to the processors than brokers. This is because educated farmers have good skill, knowledge and information about the marketing of their produces and they synthesis and detect the profitable marketing channel. This study is consistent with (Abebe et al., Citation2018; Hawlet et al., Citation2019; Taye et al., Citation2018; Tewoderos et al., Citation2020) and they found that educational status of the household heads affect tomato, sorghum, wheat and onion market channel choices. Distance to the nearest market has negatively determine the probability of farmers to choose brokers over processors at 10% significant level. This indicate that as the distance to the nearest market become shorter the farmers sold their produces to processors than brokers. It means as the market closer to the farmers the probability of choosing brokers over processors decreased by 70.6%, ceteris paribus. This is due to the fact that the farmers in the study area consider the profit they obtain from selling to processors was better and they trust more the selling prices offered by processors than brokers. Access to the nearest road has positively determine the probability of household to sell their produce to brokers than processors at 5% significant level. It is because brokers were found even in the far distance from all weathered roads and this reduces the transportation cost for the producers. This result is consistent with Hawlet et al. (Citation2019)in which market distance has a positive relation with collectors and tomato producers sell their produce at the farm gate to collector than wholesaler.
Table 5. Multinomial logistic model estimation for determinants of wheat producer’s outlet choice
The probability of choosing cooperatives market outlet was determined by sex and nearby market at 1% significant level, by year of participation at 5% and by age and nearby road at 10% significant level. The finding of the study specifies female-headed households tend to sell their wheat produces to cooperatives than processors at 1% significant level. The age of households negatively determines choose of cooperative at 10% significant level. Being others constant as the age of farmers increases by a year, the probability of farmers to sell their wheat produce to cooperatives decreases by 22. 6%. Thus, they were inclined to sell their produce to processors. This is due to the fact that the current easier marketing information pave a way for the farmer to consider and sell their produce to whom present better prices. Distance to all weathered road has a significant and positive effect on the decision of choosing cooperative market outlet at 10% significant level over a processor. This is due to the fact that cooperative market outlet was located in the nearest distant than processors which reduces the cost of transportation for the farmers. Year of participation has positively affected farmers choose of cooperative market outlet at 10% significant level. This designates that as the year of participation in marketing by the farmers increases by a year, the probability of selling their wheat to the cooperatives increases by 127.1%, ceteris paribus. This is because farmers were highly stick to the cooperatives specifically when they were member of the cooperatives. Amount/quantity of wheat produced determine the probability of choosing cooperatives negatively at 5% significant level. This implies that farmers who produce surplus or high amount of wheat present their produce to processors than cooperatives since processors bought large quantity and have accommodate the cost of the produce timely.
The probability of choosing wholesalers market outlet was determined by sex at 1% significant level and by quantity of wheat produced at 10% significant level. The result from the study reveal that male headed households prefer to sell their wheat produce to processors than wholesalers as compared to female headed households. It is due to the fact that male headed households have better market participation, access to marketing information and better contact with different market dealers. Amount/quantity of wheat produced determine the probability of choosing wholesalers negatively at 5% significant level. This implies that farmers produce surplus or high amount of wheat present their produce to processors than wholesalers since processors bought large quantity and have accommodate the cost of the produce timely.
The probability of choosing consumer market outlet was determined by sex and quantity of wheat produced at 1% significant level, by education at 5% significant level and by distance to roads at 10% significant level. The result shows that female household heads tend to prefer consumers over processors compared to male household heads. This is mostly as a result of male headed households have an opportunity to communicate with different market dealer than female households who confined to home. The educational status of the household heads negatively determines the consumers market outlet choices at 5% significant level. Being other things constant, as the literacy level of the farmers increases the probability of choosing consumers over processors declined by 68%. It was negatively influenced consumers market outlet choices means as the literacy level of the household heads increases the probability of selling their wheat produces to consumers was declined. It is due to the fact that educated farmers have the knowledge and skill to analyze the profitability of different market channel choices and thus, they prefer processors over consumers. Amount/quantity of wheat produced determine the probability of choosing consumers negatively at 1% significant level. This implies that farmers produce surplus or high amount of wheat present their produce to processors than consumers since processors bought large quantity and have accommodate the cost of the produce timely This result is in line with Tadie et al. (Citation2019) found that the quantity of teff produced have a positive and significant relationships with wholesalers and retailers market outlet. Distance to all weathered road has a significant and positive effect on the decision of choosing consumers market outlet at 10% significant level over a processor. This is due to the fact that most wheat producers desire to sell their products at the farm gate without suffering transaction costs. This study is consistent with Hawlet et al. (Citation2019) found that positive relationship with the likelihood of choosing collectors and consumers channel.
The probability of choosing retailer market outlet was determined by the quantity of wheat produced at 5% significant level and by education, nearby market and nearby road at 10% significant level. The educational status the household heads negatively determine the retailers market outlet choices at 5% significant level. It was negatively influenced retailers market outlet choices means as the literacy level of the household heads increases the probability of selling their wheat produces to consumers was declined. It is due to the fact that educated farmers have the knowledge and skill to analyze the profitability of different market channel choices and thus, they prefer processors over retailers. Distance from the nearest market was found to have positive and significance relationship with the likelihood of choosing retailers market outlet at 5% significant level. The result indicate that those household heads located far from the nearest market are less likely in delivering wheat produce to processors market outlet and more likely in delivering wheat produce to retailers’ market outlet. This is due to the fact that as the distance from the nearest market increases the cost of transportation and the time spent for transporting the wheat produce were increases. Amount/quantity of wheat produced determine the probability of choosing retailers negatively at 5% significant level. This implies that farmers produce surplus or high amount of wheat present their produce to processors than retailers since processors bought large quantity and have accommodate the cost of the produce timely.
6. Conclusion
Wheat is one of the cereal crops produced extensively in the study area, and the sources of food for consumers and source of income for producers. Despite, wheat has been produced extensively in Ethiopia in general and the study area in particular the yield per hectare is lower as compared to wheat producing countries in Africa and the world in general. One of the contributing factors for this low yield per hectare is limited access to agricultural markets though show improvement due to current expansion of roads and urban centers.
The wheat producer farmers in the study area chooses different marketing channel which increases their profitability. Brokers, consumers, wholesalers, retailers, cooperatives and processors were the marketing outlet channels identified by wheat farmer producers. The largest quantity of wheat produced by farmers in the study area received by brokers, unions/cooperatives, and consumers which share 30.75%, 23%, and 20%, respectively. The direct link of producers/farmers to the processors was very weak or low with a share of only 1.25%. Among the ten demographic, socio-economic and institutional explanatory variables included in the model seven of them were statistically significant at 1%, 5% and 10%. Those factors significantly affecting wheat producers market outlet choices were sex, age, education, year of participation, nearby market, nearby road and quantity produced.
Based on the result and finding of the study the succeeding policy implication were formulated to promote the flow of wheat product from producers to the ultimate consumers through different outlets to boost the benefit the smallholder farmers received. 1) to reduce the role the brokers, which complicating the marketing of wheat in the study area, the government and other stakeholders should work on the expansion of road infrastructure. This is due to the fact that the brokers found everywhere were the road infrastructure could not reach to grasp the benefit of wheat market with minimum cost which hamper the life of small holder farmers. 2) Awareness creation on sources of market information, how to select appropriate market channels and how to get fair price should be given by development agents and market experts in the study area. 3) to boost the production and productivity of wheat in the study area and active participation of smallholder farmers in agricultural investment working capital play a pivotal role. Hence, it is important to provide credit service to producers at the fair interest rate because it helps them to participate in both wheat production and marketing activities and facilitate the time to search the appropriate market channel.
Disclosure statement
No potential conflict of interest was reported by the author(s).
Additional information
Funding
Notes on contributors

Solomon Ketema
Solomon Ketema (Mr) is an academic staff member of the Department of Geography and Environmental Studies in Bule Hora University. He is a doctoral fellow at the Department of Geography and Environmental Studies at Addis Ababa University, Ethiopia. He holds a bachelor’s degree in Geography in 2006 from Jimma University and MA degree in Population and Socio-economic Development Planning 2013 from Adama Science and Technology University. His research focus includes agricultural value chain, livelihood, climate change, poverty and food security.
Tebarek Lika
Tebarek Lika (PhD) is an academic staff member of the Department of Geography and Environmental Studies at Addis Ababa University, Ethiopia. He is lecturer and researcher in the same university. His research focus includes agricultural value chain, livelihood, climate change, poverty and food security.
References
- Abebe Birara Dessie, Tadie Mirie Abate and Taye Melese Mekie. (2018). Factors afecting market outlet choice of wheat producers in North Gondar Zone, Ethiopia. Agriculture & Food Security, 7, 91. https://doi.org/10.1186/s40066-018-0241-x
- Abebe, B., Tadie, M., & Taye, M. (2018). Factors affecting market outlet choice of wheat producers in North Gondar Zone, Ethiopia. Agriculture & Food Security, 7(19). https://doi.org/10.1186/s40066-018-0241-x
- Ayele, T., Goshme, D., & Tamiru, H. (2021). Determinants of cereal crops commercialization among smallholder farmers in Guji Zone, Ethiopia. Cogent Food & Agriculture, 7(1), 1948249. https://doi.org/10.1080/23311932.2021.1948249
- AZFECO. (2016). Arsi Zone Socio-economic profile of the year 2007 and 2008.
- Clark, P., Vicki, L., & Creswell, J. W. (2015). Understanding research: A consumer’s guide (2nd) ed.). Pearson Education, Inc.
- Cohen, L., Manion, L., & Morrison, K. (2000). Research methods in education (5th) ed.). RoutledgeFalmer.
- Creswell, J. W. (2009). Research design: Qualitative, quantitative, and mixed methods approaches (3rd) ed.). SAGE Publications, Inc.
- Creswell, J. W. (2012). Educational research: Planning, conducting, and evaluating quantitative and qualitative research (4th) ed.). Pearson Education, Inc.
- Creswell, J. W. (2014). Research design: qualitative, quantitative, and mixed methods approaches (4th) ed.). SAGE Publications, Inc.
- Crotty, M. (1998). The Foundations of Social research: Meaning and perspective in the research process. SAGE Publications.
- FAO (2009). FAO global information and early warning system on food and agriculture world food programme: Special report FAO/WFP crop and food security assessment misssion to Ethiopia
- FAO (2014). The state of food and agriculture, Rome. www.fao.org/3/i4040e/i4040e
- FEDOoAZ. 2010. “Physical geography of Arsi Zone.”
- Gray, D. E. (2004). Doing research in the real world. SAGE Publications Ltd.
- Gray, D. E. (2017). Doing research in the business world. SAGE Publications Ltd.
- Hawlet, M., Zewdu, B., & Getachew, A. (2019). Determinants of market outlet choice decision of tomato producers in Fogera Woreda, South Gonder Zone, Ethiopia. Cogent Food & Agriculture, 5(1). https://doi.org/10.1080/23311932.2019.1709394
- Kothari, C. R. (2004). Research methodology: Methods and techniques (2) ed.). New Age International Publisher.
- Minot, N., Warner, J., Solomon, L., Leulsegged, K., Abate, G., & Shahidur, R. (2015). Wheat in Ethiopia: Production, Marketing, and Consumption: Prepared for the Ethiopian agricultural transformation agency (ATA).
- Samuel, G., Mekbib, H., & Matthias, K. 2017. “The wheat sector in Ethiopia: Current status and key challenges for future value chain development. ZEF Working Paper Series, 1864-6638.”
- Shahidur, R., & Asfaw, N. 2013. “Policies and performance of Ethiopian cereal markets.”
- Tadesse, K., Tura, K., Girma, G., & Ljungberg, D. (2017). Exploring wheat value chain focusing on market performance, post-harvest loss, and supply chain management in Ethiopia: The case of arsi to finfinnee market chain. Journal of Agricultural Science, 9(8), 1916–17. https://doi.org/10.5539/jas.v9n8p22
- Tadie, M., Taye, M., & Abebe, B. (2019). Determinants of market outlet choices by smallholder tef farmers in Dera District, South Gondar Zone, Amhara National Regional State, Ethiopia: A multivariate probit approach. Journal of Economic Structure, 8(39). https://doi.org/10.1186/s40008-019-0167-x
- Taye, M., Degye, G., & Assefa, T. (2018). Determinants of outlet choices by smallholder onion farmers in Fogera District Amhara Region, Northwestern Ethiopia. Journal of Horticulture and Forestry, 10(3), 27–35. https://doi.org/10.5897/JHF2018.0524
- Tewoderos, M., Degye, G., & Bosena, T. (2020). Determinants Sorghum Market among smallholder farmers in Kafta Humera District Tigeray Ethiopia. South Asian Journal of Social Studies and Economics, 8(1), 1–13. https://doi.org/10.9734/SAJSSE/2020/v8i130200
- Tolesa, A., Bezabih, E., Jema, H., & Belaineh, L. (2014). Impact of wheat row planting on yield of smallholders in selected highland and lowland areas of Ethiopia. International Journal of Agriculture and Forestry, 4(5), 386–393. https://doi.org/10.5923/j.ijaf.20140405.07
- White, J. W., Tanner, D. G., & Corbett, J. D. (2011). An agro-climatological characterization of bread wheat production areas in Ethiopia. NRG-GIS series 01-01. Mexico, D.F.: CIMMYT.
- Yazachew, E., & Kasahun, D. (2011). The national regional government of Oromia physical and socio- economic profile of Arsi Zone and Districts’: Bureau of finance and economic development – regional data and information core process.
- Yonnas, A., Bosena, T., & Mengistu, K. (2019). Determinants of wheat market outlet choice of smallholder farmers: The case of Dembecha District, Amhara National Regional State, Ethiopia. Journal of Poverty, Investment and Development, 50. https://doi.org/10.7176/JPID