
 ?Mathematical formulae have been encoded as MathML and are displayed in this HTML version using MathJax in order to improve their display. Uncheck the box to turn MathJax off. This feature requires Javascript. Click on a formula to zoom.
Abstract
Breeding for nutrient-dense maize cultivars is reliant on introductions of exotic inbred lines enhanced with high levels of the targeted nutrients. Sometimes, the exotic nutrient donor germplasm may not adapt well in new growing environments, thereby reducing seed production when used in hybrid combinations. Therefore, evaluating introduced trait donors for adaptation, through genotype × environment interaction (GEI) analysis is crucial in breeding for quality traits. The objectives of this study were to (i) evaluate grain yield performance of introduced zinc-enhanced, provitamin A, normal and quality protein maize lines across stress and non-stress environments in Zimbabwe, (ii) assess the presence of GEI and (iii) identify high yielding and stable lines that could be used for developing Zn-enhanced hybrids with improved seed producibility. Additive main effects and multiplicative interaction (AMMI) and genotype plus genotype × environment interaction (GGE) biplot analyses were used for stability analysis. GEI effects were highly significant (P ≤ 0.01) for grain yield. Grain yields for the inbred lines ranged from 1.28 to 3.5 t ha−1. The Zn donor G11 (ITZN313) had the highest grain yield of 3.5 t ha−1 across environments, whereas the normal check G24 (CZL1111) had the lowest grain yield. G2 (CLWQHZN14), G4 (CLWQHZN19), G8 (OBATANPA6), G11 (ITZN313) and G18 (CML546) were stable and high yielding and can be used for developing Zn-enhanced hybrids. Five mega-environments were identified, clearly separating stress and non-stress environments. E11 (Chisumbanje WW) was the most discriminating and representative test environment and could be used to identify superior genotypes.
PUBLIC INTEREST STATEMENT
Seed producibility of parental materials of maize hybrids is of paramount importance so as to reduce seed production costs. To identify high yielding and stable maize hybrid parents, evaluation across different growth conditions is necessary. Our study focused on identifying superior and stable maize lines that could be used to develop micronutrient-dense maize hybrids in Zimbabwe. Increasing micronutrient densities in staple crops such as maize is in line with the World Health Organization’s current Sustainable Development Goals (SDGs) to end hunger in all its forms. When used as breeding materials, promising micronutrient-dense maize lines identified in this study could save millions of people in sub-Saharan Africa, currently suffering from various ailments emanating from micronutrient deficiency.
1. Introduction
Maize (Zea mays L.) is a major staple food and energy source in various parts of the world including the sub-Saharan Africa (SSA). In this region, maize and maize-based products constitute more than 38% of the food supply for both children and adults. Despite being an excellent energy source, maize is deficient in micronutrients such as zinc (Zn), iron (Fe) and provitamin A as well as essential amino acids such as lysine and tryptophan (Siwela et al., Citation2020). Consequently, more than two billion people from maize-based regions, including Latin America, Africa and Asia, suffer from various ailments emanating from micronutrient deficiencies, due to monotonous maize diets with limited access to diversified and fortified foods, as well as dietary supplements (Prasanna et al. Citation2020). The deficiency of these key micronutrients causes several health challenges with an overall impact on the physical, mental and cognitive well-being and development of humans (Bhandari & Banjara, Citation2015; Ma et al., Citation2008). Childbearing women, the elderly and pre-school children are among the worst affected, due to increased micronutrient demand (Hwalla et al., Citation2017). The World Health Organization (WHO) of the United Nations estimated that micronutrient deficiency accounts for more than 53% of infant mortality before the age of five (Kiran et al., Citation2014).
Among other nutrient deficiency mitigation measures, including food fortification and clinical supplementation, development of maize with elevated levels of grain Zn, provitamin A and tryptophan could be impactful in reducing malnutrition in rural areas of maize-based countries (Siwela et al., Citation2020; Temple et al., Citation2011). However, the development of these so-called “biofortified” maize cultivars relies on the importation of inbred lines that have high levels of the target nutrients (Maqbool et al., Citation2018). A challenge of such exotic nutrient donors is their adaptation to the new growing environment. Hence, testing the newly introduced germplasm for agronomic performance in local growing environments is necessary. Maize breeding programs aim to select new genotypes that have both high yield potential and broad adaptation (Falconer & Mackay, Citation1996; Sibiya et al., Citation2012). To achieve this, the newly introduced or developed inbred lines, hybrids or open-pollinated varieties are evaluated in multi-environment trials (METs). In METs, genotype sets are grown across several environments to evaluate both the main and interaction effects (Mafouasson et al., Citation2018; Yan & Tinker, Citation2006). This enables breeders to determine if GEI effects are significant or not.
In METs, grain yield performance of a genotype across different environments can vary, and this indicates high GEI. High GEI may change the ranking of genotypes in different environments, which is known as cross-over interaction (Bocianowski et al., Citation2019b). This further complicates the selection of superior genotypes for target environments. In the absence of GEI, the superior genotype remains the best performing genotype in all environments (Tena et al., Citation2019). Therefore, GEI poses great challenges to plant breeders because it complicates efficient selection and identification of superior cultivars (Mebratu et al., Citation2019; Ndhlela et al., Citation2014). Measuring GEI is important in optimizing breeding strategies for selecting cultivars that are well adapted to specific environments (Zewdu et al., Citation2020). Most GEI studies, however, focus on evaluating maize testcross hybrids, while this knowledge is equally important for parental inbred lines. Understanding the grain yield performance of hybrid parental inbred lines across environments is crucial, since grain yield is directly related to the seed producibility. Highly productive inbred lines indicate a good foundation for the development of successful commercial hybrids (Worku et al., Citation2016). Apart from identifying high yielding and stable genotypes across environments, METs also identify experimental sites that best represent the target environment (Gasura et al., Citation2015; Makumbi et al., Citation2015). Therefore, MET experimental data can be partitioned into three variance components, the environmental (E), genotype (G) and GEI components. Although the environmental variance component is generally the largest, breeders mainly focus on the genotypic (G) main effects and GEI for efficient cultivar selection.
Several statistical methods have been proposed to study GEI. Each of the methods used so far has its own advantages and limitations, and usually breeders use them interdependently. Because of this, several parametric and non-parametric statistical analyses were developed to study GEI (Farshadfar et al., Citation2011; Mohammadi et al., Citation2014). These include the additive main effect and multiplicative interaction analysis (AMMI; Gauch, Citation1992), site regression (SREG; Setimela et al., Citation2010) also known as genotype (G) main effects and genotype × environment (GE) interaction effects (thus GGE), partial least square (PLS), stability analysis and factorial regression (A. Pacheco et al., Citation2015). However, AMMI and GGE are the most widely used analyses (Gauch, Citation2006). AMMI is a hybrid model involving both additive and multiplicative components of a two-way data structure (Choukan, Citation2011). This model separates the additive variance from the multiplicative variance and then applies principal component analysis (PCA) to the interaction portion explaining the interaction pattern in more detail (Gauch & Zobel, Citation1996). Thus, AMMI, through PCA, further partitions the GEI component into individual genotypic and environmental scores (Abakemal et al., Citation2016; Yan et al., Citation2000). AMMI analysis has been reported to be effective in analysing GEI, because it captures a large portion of the GEI sum of squares, clearly separating the main and interaction effects, which allows efficient selection of stable maize cultivars (Bocianowski et al., Citation2019b; Haruna et al., Citation2017). The second most popular multivariate statistical tool for studying MET data in different breeding programmes is the site regression of genotype plus GE interaction (GGE) biplot model (Tena et al., Citation2019). This is a linear-bilinear model that removes the environmentally main effect and considers the genotype (G) plus the genotype × environment (GE) interaction. The main advantage of the GGE biplot model over AMMI is that it allows the detection of GEI in terms of the crossover interaction, which ultimately ranks genotypes in terms of performance across environments (Abakemal et al., Citation2016; Yan & Kang, Citation2003). Hence, the model is powerful in depicting which-won-where patterns of MET data, facilitating easy identification of stable and high yielding maize genotypes as well as environments with discriminating ability and representativeness.
The objectives of this study were to (i) evaluate grain yield performance of introduced zinc (Zn) enhanced, provitamin A, normal and quality protein maize (QPM) inbred lines across stress and non-stress environments in Zimbabwe, (ii) assess the presence of GEI using AMMI and GGE biplot analysis and (iii) identify high yielding and stable inbred lines that can be used as parents for developing Zn-enhanced hybrids with potential success as commercial hybrids due to improved seed producibility.
2. Materials and methods
2.1. Experimental site
The experiment was conducted for 2 years during both summer and winter seasons of 2019 and 2020, at 11 experimental sites in Zimbabwe with different management levels (Table ) which were coded as E1 to E11. Combined heat and drought stress and low nitrogen (N) trials were planted in well-established screening sites managed by the International Centre for Maize and Wheat Improvement Centre (CIMMYT) and the Department of Research and Specialist Services (DRSS) in Zimbabwe. Both Chiredzi and Chisumbanje are located in the lowveld and experience relatively high temperatures in the winter season, making it possible to grow summer crops during the winter period. All sites except for Chisumbanje are characterized by deep red clam loam soils with good drainage. Chisumbanje has black alluvial clay soils.
Table 1. Description of the 11 experimental sites used during 2019 and 2020
2.2. Plant materials and experimental design
Twenty-four inbred lines (coded G1 to G24) from different nutritional categories were evaluated for GEI across stress and non-stress environments, E1 to E11. Eleven inbred lines (G1 to G11) were Zn donors introduced to Zimbabwe from CIMMYT-Mexico and the International Institute of Tropical Agriculture (IITA) in Nigeria (Table ). G12 to G18 were locally used lines from the normal, provitamin A, and quality protein maize (QPM) nutritional backgrounds, and six commercial checks G19 to G24 were included (Table ). Genotypes in all trials were planted in an 8 × 6 alpha (0,1) lattice design (Patterson & Williams, Citation1976) with two replications at each site. Plots were single rows of 4 m long with spacings of 0.75 (inter-row) and 0.25 m (in-row), respectively, giving a final plant density of 53333 plants ha-1 at all experimental sites.
Table 2. Description of the 24 maize inbred lines evaluated for agronomic performance across 11 sites during 2019 and 2020 cropping seasons
2.3. Trial management and data collection
Standard agronomic practices were applied at all sites during the trial implementation period. Weed control was done using both pre- and post-emergence herbicides and in some cases hand weeding was applied. Supplementary irrigation was applied when necessary in all trials during the early vegetative stages. Inbred lines were exposed to drought stress by withholding irrigation 2 weeks before anthesis up to 21 days post flowering so that drought stress would coincide with flowering, which is the most sensitive growth stage. Similarly, the low N trials were grown in low N screening sites, developed by continuously depleting N to less than 7 ppm, which is estimated to cause 30% maize yield reduction (Bänziger et al., Citation2000). At harvesting, grain yield data was recorded using plants in the net plot area as the two border plants close to the alley were discarded.
2.4. Statistical analysis
The MET grain yield data was adjusted to 12.5% moisture content and analysed using the Genotype × Environment Analysis with R (GEA-R) statistical package (A. Pacheco et al., Citation2015) and Genstat 18th version (VSN International, Citation2017) for both AMMI and SREG (GGE biplot) analyses. The AMMI model combined the conventional analysis of variance (ANOVA) and PCA into a single analysis with both additive and multiplicative variance components (Choukan, Citation2011; R.M. Pacheco et al., Citation2005). This means that in the first component (additive), the traditional ANOVA procedures were applied to estimate both genotypic and environmental main effects. The second part applied the PCA, which used the Gollob’s F-test (Gollob, Citation1968) to determine the ratio between the mean square for axis n against the mean square error, thereby depicting the number of multiplicative terms that were retained after residuals for the main effects were removed (A. Pacheco et al., Citation2015). The first and second principal component axes for biplots generated by the GEA-R statistical package were referred to as Factor 1 and 2, respectively.
The AMMI model used in this study is:
Where Yij is the yield of the ith genotype in the jth environment; µ is the grand mean; Gi and Ej are the genotype and environment deviations from the grand mean, respectively; βn is the eigenvalue of the PC analysis axis n; ϒin and δjn are the genotype and environment principal component scores for axis n; N is the number of principal components (factors) retained in the model and εij is the error term.
The GGE biplot method was used for visualizing patterns and interactions without environmental effects. Unlike GEA-R, the first and second principal component axes of biplots generated in Genstat 18th version statistical package were referred to as PCA1 and PCA2, respectively. The first principal component (PCA1 or Factor 1) represented responses of the genotypes that were proportional to the environments and the second principal component (PCA2 or Factor 2) showed cultivation environments that were not proportional to the environments, and those were responsible for genotype by environment crossover interaction. The GGE biplot model used is similar to the one used for AMMI. For stability analysis, four methods were used, the Francis coefficient of variation, CV% (Francis & Kannenberg, Citation1978), the Eberhart and Russell mean square deviation s2di (Eberhart & Russell, Citation1966), the determination coefficient R2 (Pinthus, Citation1973) and the Wricke’s ecovalence Wi (Wricke, Citation1962).
3. Results
3.1. AMMI analysis
The combined ANOVA and AMMI analysis for the 24 inbred lines evaluated over 11 environments across two seasons is shown in Table . The ANOVA showed that there were highly significant differences (P ≤ 0.01) for genotype, environment, and their interactions. The grain yield of the inbred lines was significantly affected by the environment, which explained 33.1% of the total variation (both additive and multiplicative effects). Genotype main effects explained 26.4% of the total variation, while the GEI captured 40.5% of the total variation. PCA was applied to further partition the GEI in the AMMI model. The first two principal component axes (Factor 1 and Factor 2) were highly significant and explained 34.2% and 25.6% of the total variation, respectively, and cumulatively 59.8% of the total variation.
Table 3. AMMI analysis of variance for 24 normal and biofortified inbred lines across 11 environments
In the AMMI biplot (Figure ), genotypes that are more stable are closer to the origin, and these genotypes show consistent grain yields across all the test environments. In this regard, inbred line G2 (CLWQHZN14), G4 (CLWQHZN46), G15 (CML144), G14 (TL115798), G17 (CZL16160) and G9 (ITZN344) were the most stable genotypes, implying that their performance in terms of grain yield was similar across all environments. Several authors have demonstrated that either environments or genotypes that have large negative or positive Factor 1 scores have high interactions (Abera et al., Citation2004; Mebratu et al., Citation2019). Similarly, genotypes or environments with Factor 1 scores close to zero have small interactions (Choukan, Citation2011; Tena et al., Citation2019).
Figure 1. AMMI biplot of Factor 1 and Factor 2 scores for 24 normal and biofortified inbred lines grown across 11 environments.
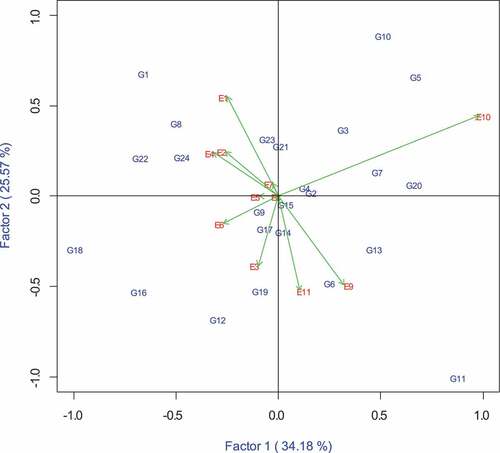
Using this principle, small interactions were observed in environments E5 (Kadoma RS), E7 (Gwebi opt) and E8 (Chiredzi HMDS), whereas large interactions were observed in E1 (ART opt), E9 (Chiredzi WW), E10 (Chisumbanje HMDS) and E11 (Chisumbanje WW). The distance between two genotypes or environment vectors (their end points) estimated the level of interaction between the genotypes and environments (Choukan, Citation2011; Mafouasson et al., Citation2018). Environments that had the longest vector length had the greatest discriminating ability, implying that they classify better to the genotypes. Therefore, E10 (Chisumbanje HMDS) had the longest vectors and thus had the most discriminating power (Figure ).
Table shows the grain yield means for both individual sites and across the sites of the 24 inbred lines. Genotypes that had above-average means were G1 (CLWQHZN12), G2 (CLWQHZN14), G4 (CLWQHZN19), G5 (CLWQHZN49), G8 (OBATANPA6), G10 (ITZN324), G11 (ITZN313), G16 (CZL16154) and G18 (CML546). G11 had the highest mean for grain yield of 3.5 t ha–1 across all environments. The lowest yielding genotypes were G19 (CML511), and the checks G23 (CML312) and G24 (CZL1111) with 1.32, 1.42 and 1.28 t ha–1, respectively. In Figure , genotypes G9, G14, G15 and G17 were near the origin, indicating good stability, but their grain yield averages were below the grand mean. Using this criterion, the Zn donors G2 and G4 combined both high stability and high yield potential and, therefore, qualify as the most ideal inbred lines. Genotypes G11, G10, G18, G5, G16 and G8 were not stable, although they had higher average main effects for grain yield. Environments E2 (CIMMYT opt), E4 (RARS opt), E9 (Chiredzi WW) and E11 (Chisumbanje WW) had the highest individual site means (Table ). Therefore, these environments were the most favourable in terms of grain performance for most of the genotypes. The least favourable environments for most inbred lines were E3 (CIMMYT LN), E6 (DRSS LN) and E8 (Chiredzi HMDS).
Table 4. Mean grain yield (t ha−1) of 24 normal and biofortified inbred lines evaluated across 11 environments in Zimbabwe
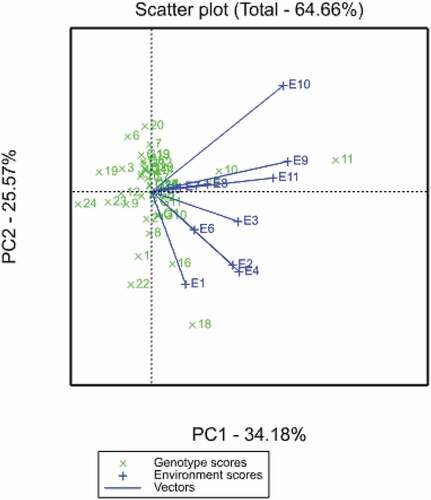
Figure shows the vector view of the GGE biplot generated in GenStat for the correlation among environments. The cosine of the angle between two genotypes or environment vectors indicates the correlation between them. Environments that have an angle of less than 90° (acute) between them such as E1, E2, E3, E4 and E6 classify the genotypes in a similar manner. Similarly, obtuse angles between environments mean that these environments classified genotypes differently (negative correlation). Right angle between environments means no correlation. In this regard, E2 (CIMMYT opt) and E4 (RARS opt) were not correlated with E10 (Chisumbanje HMDS). It was observed that all the environments in the main rain season clustered together, except for E5 (Kadoma RS) and E7 (Gwebi opt), that clustered with all environments used during the winter season.
Figure 2. GGE-scatterplot based on environment-focused scaling for environments.
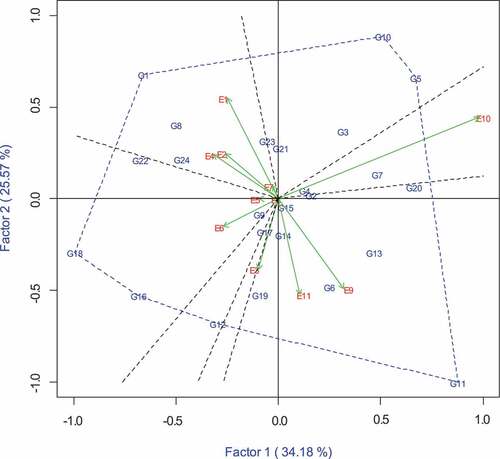
3.2. “Which-won-where” interaction pattern
The power of the GGE biplot is the ability to show which-won-where interaction patterns, making it easier for plant breeders to select superior genotypes for particular environments. The perpendicular lines (Figure ) that radiate from the biplot origin are called sectors, and clearly show genotypes that perform better in each environment. The polygon is formed by connecting the black dotted lines and the vertex genotypes (G1, G10, G5, G11, G12, G16 and G18). These vertex genotypes have the longest vectors in their respective directions, and therefore these genotypes performed best in all the environments contained in the respective sectors. The rest of the genotypes such as G3, G7, G8, G13, G21 and G23 are contained in the polygon because they have small vectors, implying that they were less responsive to the environments contained in the sector.
The polygon was divided into seven sectors, and clusters of environments that are contained in each sector are called mega-environments. Only sectors that contain one or more environments are mega-environments. Therefore, two sectors, one with G3, G5, G10, and G21 and the other one with G12 did not define any mega-environment. Hence, in this study, five mega-environments were observed. G11 (ITZN313) had the highest grain yield performance in the mega-environment that contained E9 (Chiredzi WW) and E11 (Chisumbanje WW). Similarly, G1 (CLWQHZN12) was the best performer in the mega-environment that contained mostly optimum environments E1 (ART opt), E2 (CIMMYT opt), E4 (RARS opt) and E7 (Gwebi opt). G18 (CML546) had the highest yield in the mega-environment that contained stress environments E5 (Kadoma RS), E6 (DRSS LN) and E8 (Chiredzi HMDS). Although the sector that contained E10 (Chiredzi HMDS) had no vertex genotype, the Zn donor, G7 (CLWQHZN69) performed well in this environment.
Figure 3. GGE biplot showing which-won-where pattern of the 24 normal and biofortified inbred lines (G) evaluated over across 11 environments.
3.3. Stability analysis
The GGE-biplot analysis also provides a comparison of genotypes or environments with the ideal genotype or environment (Figure ). In this comparison biplot, the ideal genotype is located in the innermost concentric ring. The ideal genotype combined both high grain yield and stability across a wide range of environments. Ideal genotypes or environments have the longest vectors in PCA1 and smaller values for PCA2 scores. Therefore, the distance between the genotype and the centre of the innermost concentric ring depicts its stability and yield potential. Based on this, the three Zn donors G11 (ITZN313), followed by G10 (ITZN313), G5 (CLWQHZN49) and G18 (CML546) were the best genotypes showing high grain yield under both optimum and stress conditions. Similarly, the ideal or reference environment showed large PCA1 scores and zero PCA2 scores and indicates greatest discriminating ability in classifying genotypes and representativeness when compared to other environments. Environments E2 (CIMMYT opt), E4 (RARS opt), E9 (Chiredzi WW) and E11 (Chisumbanje WW) were closer to the inner concentric ring, and therefore were identified as the ideal environments.
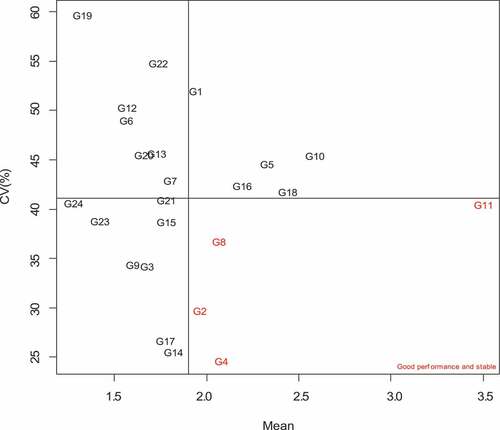
In this study, four stability parameters were used namely the Francis coefficient of variation, CV% (Francis & Kannenberg, Citation1978), the Eberhart and Russell mean square deviation from regression, s2di (Eberhart & Russell, Citation1966), determination coefficient, R2 (Pinthus, Citation1973) and Wricke’s ecovalence, Wi (Wricke, Citation1962). The stability coefficients are shown in Table . The smaller the coefficient values for all the stability parameters used except for R2, the more stable the genotype is. The results show that nearly all stability parameters identified G2, G4, G9 and G17 as the most stable genotypes. Comparing the efficiency of these parameters, Eberhart and Russell (s2di), determination coefficient (R2) and Wricke’s ecovalence (Wi) showed consistent results in ranking of genotypes. For instance, G12 was ranked 21st with the Francis CV%, whereas the rest of the stability methods ranked this genotype 14th or 15th (Table ). This was also observed for G21, which was ranked 12th (CV%), but ranked in the top six stable varieties using the other stability parameters. The biplot shown in Figure was constructed using the Francis coefficient of variation (CV%).
Figure 4. GGE comparison biplot based on genotype-focused scaling for comparing the 24 normal and biofortified inbred lines with the ideal genotype.
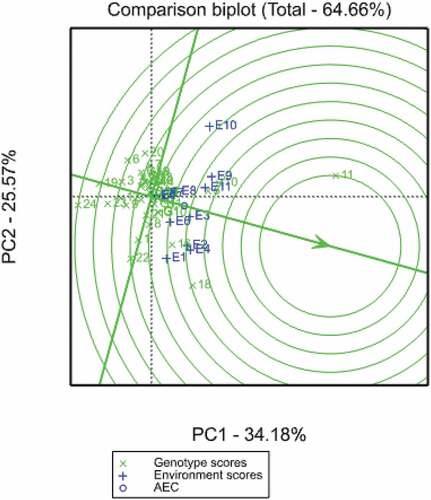
Table 5. Stability analysis of 24 normal and biofortified maize inbred lines evaluated across 11 environments in Zimbabwe
Figure 5. Stability analysis biplot of the 24 normal and biofortified inbred lines (G) evaluated over across 11 environments using the Francis coefficient of determination (CV%).
3.4. Discussion
GEI studies are very important in maize breeding, since they provide a way of assessing the performance of genotypes for stability and adaptability across environments (Farshadfar et al., Citation2011). In this way, efficient genotypes can be identified and in the case of hybrids, recommendations for commercialization can be made based on hybrid performance in particular environments. Similarly, high yielding and stable inbred lines across environments can also give a good indication of their seed producibility or even combining ability (Worku et al., Citation2016). In addition, the inclusion of the GEI matrix increases the prediction accuracy in statistical models used for predicting the performance of untested genotypes and thereby saves testing costs (Bocianowski et al., Citation2019b; Worku et al., Citation2016). Although several studies have demonstrated significant GEI of grain yield performance of inbred lines (Bisawas et al., Citation2014; Bocianowski et al., Citation2019b), such studies focusing on biofortified introduced germplasm are still very limited. Currently, breeding for biofortified cereals is being promoted globally.
The results of the present study demonstrated highly significant differences (P ≤ 0.01) for the genotype (G) and environmental (E) main effects. Similarly, the GEI was highly significant (P ≤ 0.01), implying that normal and biofortified genotypes responded differently across environments. The large proportion and significance of the sum of squares of the environments indicated that the experimental sites used in this study were different and this resulted in variation of grain yield of the inbred lines (Table ). A large contribution of the environment was reported in normal maize hybrids in earlier studies (Ertiro et al., Citation2017; Mafouasson et al., Citation2018; Sibiya et al., Citation2012). Large sums of squares for environments demonstrated that the inbred lines were evaluated in contrasting testing locations and therefore their performance was determined by adaptability to particular environments. Differences in environmental main effects are useful in GEI studies since they facilitate identification of high yielding and stable genotypes across varying environmental conditions. Similarly, genotype main effects were highly significant, contributing about 26.4% of the total variation. This demonstrated that grain yields for inbred lines responded differently to the environments where they were grown. Li et al. (Citation2018) suggested that the grain yield performance of maize inbred lines varies more across environments compared to hybrids. Whilst the present study evaluated only the inbred lines, future studies should compare the stability of biofortified parental lines and hybrids across environments. The identification and selection of superior biofortified inbred line introductions with high yield potential under both stress and non-stress environments, is likely to give rise to highly productive and stable nutrient-dense hybrids that could facilitate quick adoption by stakeholders. The highly significant differences (P ≤ 0.01) for the GEI for grain yield of both normal and biofortified inbred lines justify the need for extensive testing of such germplasm over diverse growing conditions before recommendations (Badu-Apraku et al., Citation2003).
The results of the AMMI biplot analysis of 24 inbred lines revealed a fairly narrow range of grain yield performance (1.28 to 3.5 t ha−1; Table ). The highest grain yield across sites was observed from a Zn donor line G11 (ITZN313). In addition, several Zn donors from either CIMMYT or IITA were among the best performing inbred lines in terms of grain yield (Table ). This is quite encouraging and gives hope to plant breeders in pursuit of developing high yielding Zn-enhanced hybrids, since several studies have reported the inferiority of biofortified genotypes in terms of grain yield (Bänziger & Long, Citation2000; Maqbool et al., Citation2018). The high grain yield for maize inbred lines suggests good seed producibility in hybrid combinations, which reduces the cost of seed production. Although some scientists reported that heterosis is more important than mid-parent yield in determining potential use of inbred lines, some reported positive correlation between grain yield of parental inbred lines and their corresponding hybrids under stressed growing conditions (Zaidi et al., Citation2007). Therefore, the seven Zn donors G1 (CLWQHZN12), G2 (CLWQHZN14), G4 (CLWQHZN19), G5 (CLWQHZN49), G8 (OBATANPA6), G10 (ITZN324), and G11 (ITZN313) could be useful as potential parents for developing high yielding Zn-enhanced hybrids in Zimbabwe.
The normal inbred lines G16 (CZL16154) and G18 (CML546) were among the highest yielding inbred lines across environments. Such inbred lines could be impactful if used as parents for developing normal stress tolerant commercial hybrids. In fact, CML546 was the winning genotype across drought, low nitrogen and random stress conditions. Through validation of the existence of tolerance genes for such stress factors, the inbred line could be recommended as a specific trait donor in different breeding programs. The polygon view of the GGE biplot was divided into seven sectors and defined into five mega-environments, as defined by Yan and Tinker (Citation2006). Two sectors with genotypes G3 (CLWQHZN19), G5 (CLWQHZN49), G10 (ITZN324), G12 (HPYDL18190) and the provitamin A check G21 (CLHP0478) did not define any mega-environment. This implies that these inbred lines had the poorest grain yield performance in some or all environments. The existence of mega-environments reveals that inbred lines responded differently to environments, suggesting differences in mechanisms for stress tolerance (Haruna et al., Citation2017; Yan & Rajcan, Citation2002). The polygon biplot showed that G11 (ITZN313) was the winning genotype in Chiredzi and Chisumbanje under well-watered conditions and could be grown in the winter for seed production in such environments. These sites are characterized by excessively high temperatures, and based on its origin (West Africa), ITZN313 could be highly adaptable to extremely hot conditions. G1 (CLWQHZN12) performed best in terms of grain yield under optimum conditions and therefore could be less adapted to stressful conditions.
The GGE biplot analysis for grain yield performance and stability of the 24 normal and biofortified inbred lines showed that PCA1 (Factor 1) explained 34.18%, whereas PCA2 (Factor 2) explained 25.57% of the total variation. Cumulatively, the two principal axes accounted for 58.75% of variation. This suggested that the two principal component axes contributed a fairly large proportion of the total sum of squares and that this contribution was sufficient to describe the GEI pattern of the environment centred data. Most of the stability parameters used in this study identified G2 (CLWQHZN14), G4 (CLWQHZN19), G8 (OBATANPA6), G11 (ITZN313) and G18 (CML546) as the most ideal genotypes (Table and Figures to 5). Although G11 had the highest grain yield performance across environments, it was more responsive to environmental changes when compared to G2 and G4. These Zn donors showed consistency in terms of high yield and stability and could be selected as the best parents for developing Zn-enhanced hybrids in Zimbabwe. On the other hand, the normal inbred line CML546 was less responsive to unfavourable environments. Despite their below-average means for grain yield, the QPM inbred lines G14 (TL115798) and G15 (CML144) were stable across environments, and this implies that they can be grown in both stress and non-stress environments without significant yield changes. All the provitamin A inbred lines, G12 (HPYDL18190) and G13 (CLHP0213) were similar in terms of grain yield performance and stability. Although the final selection of the inbred line parents does not solely depend on the yield performance, the seed yield producibility of the selected parents is crucial in developing successful commercial hybrids. Thus, the seed yield potential of the inbred lines reflects the potential success of their respective commercial hybrids. Therefore, based on the results of this study, the poorest inbred lines could be omitted for future hybrid development since they may not be attractive to seed producers.
Five mega-environments were identified in the polygon view of the GGE biplot. Mega-environments were for the optimum environments in the main season, the well-watered environments in the winter, random and low N stress, low N stress and HMDS environments. This suggests that the mega-environments were formed based on different management conditions and not on the growing season. This implies that trial management might have contributed more to the environmental differences as well as how different inbred lines responded to different environments (Bocianowski et al., Citation2019b). This shows that genotypes have different adaptive mechanisms for each of the environments (Bruce et al., Citation2002; Pixley & Bjarnason, Citation2002). Different rainfall amounts and distributions, irrigation regimes, as well as biotic and abiotic stress constraints could have been encountered in different environments (Ertiro et al., Citation2017; Mafouasson et al., Citation2018; Mebratu et al., Citation2019). Furthermore, most optimum environments used in this study showed similarity in terms of genotypic response and this suggests that similar information could be obtained from any one of the test environments. Hence, this could reduce multi-location evaluation costs. Similarly, all winter environments, including well-watered and combined heat and drought sites, were positively correlated.
To be useful for plant breeding, a test location should have high discriminating power, providing information about the differences in performance of genotypes and representativeness to a growing environment (Mohammadi et al., Citation2014; Yan et al., Citation2007). Environments with longer vector lengths have the highest discriminating power and therefore provide more information about the performance of the genotypes (Haruna et al., Citation2017; Tena et al., Citation2019). Therefore, E10 (Chisumbanje HMDS), E9 (Chiredzi WW), and E11 (Chisumbanje WW) were all informative in terms of discriminating grain yield performance of genotypes. Since this site is used for combined heat and drought screening, E10 (Chisumbanje HMDS) could also be useful in culling drought-susceptible genotypes. In addition, environments with shorter vector lengths show a very weak correlation with environments with long vectors. Such sites could be treated as independent test environments and therefore are all useful. According to the GGE biplot (Figure ), E11 (Chisumbanje WW) had the smallest angle with the AEC abscissa as well as the long vector and, therefore, can be identified as the most discriminating and representative test environment in Zimbabwe. Grouping of sites into mega-environments can help to identify core testing environments that can be used to identify superior genotypes and thereby reduce testing costs. However, further validation of all the findings of this study, including multiple year evaluations can help to confidently group the identified mega-environments into seed production environments (Worku et al., Citation2016; Yan & Tinker, Citation2006).
3.5. Conclusions
This study showed that environment, genotype, and GEI had highly significant effects on grain yield performance of normal and biofortified inbred lines tested over stress and non-stress environments. Thus, these genotypes responded differently to changes in environments. The AMMI analysis revealed that environment main effects contributed a larger proportion of the total sum of squares when compared to the genotype main effects and the GEI. Test environments were divided into five mega-environments that clearly distinguished optimum from stress environments. The Zn donor, G1 (CLWQHZN12) was the winning genotype under optimum conditions. G18 (CML546) was well adapted to drought and low N stress environments. These inbred lines could be good sources of alleles for developing high yielding Zn-enhanced hybrids. G2 (CLWQHZN14), G4 (CLWQHZN19), G8 (OBATANPA6), G11 (ITZN313) and G18 (CML546) were the most stable and high yielding inbred lines, implying good seed producibility and reduction of seed production costs when used as parents for commercial hybrids. E11 (Chisumbanje WW) was identified as the most discriminating and representative test environment in Zimbabwe. Such sites could be useful for the identification of superior genotypes, as well as for seed production in Zimbabwe.
Notes on contributors
In the past decades, global breeding efforts were concentrated on developing conventional or normal maize varieties with good tolerance to multiple stress factors. Breeding for high yielding and stable biofortified maize varieties was lagging behind. Development of maize varieties with elevated levels of micronutrients (provitamin A and zinc) and essential amino acids (lysine and tryptophan) could be impactful in reducing hidden hunger in developing maize-based regions. International research organizations, namely HarvestPlus, International Maize and Wheat Improvement Centre (CIMMYT) and International Institute of Tropical Agriculture (IITA) have spearheaded maize biofortification, targeting these micronutrients. Our research was conducted at CIMMYT-Zimbabwe in collaboration with the University of the Free State, South Africa, with the following objectives:
To out-source micronutrient-dense germplasms from abroad and integrate them into local breeding programs.
To evaluate adaptability of exotic breeding materials in local growth conditions.
To develop and commercialize biofortified maize varieties with superior and farmer-preferred traits.
Author contributions
Conceptualization, N.M. and M.L.; investigation, N.M.; resources, T.N. and M.L.; writing–original draft preparation, N.M.; writing–review and editing, T.N., A.v.B., M.L.; data analysis; N.M.; supervision, M.L., T.N., A.v.B.; funding acquisition, T.N. and M.L. All authors approved the manuscript.
Acknowledgements
We would like to thank all the personnel at CIMMYT research stations in Harare, Chiredzi and Chisumbanje for managing all the trials. We also thank Dr. Jill Cairns and Dr. Cosmos Magorokosho for their guidance and advice.
Disclosure statement
No potential conflict of interest was reported by the author(s).
Data availability statement
All the datasets generated in the current study are available from the corresponding author upon reasonable request.
Additional information
Funding
References
- Abakemal, D., Shimelis, H., & Derera, J. (2016). Genotype-by-environment interaction and yield stability of quality protein maize hybrids developed from tropical-highland adapted inbred lines. Euphytica, 209(3), 757–19. https://doi.org/10.1007/s10681-016-1673-7
- Abera, W., van Rensburg, J. B. J., Labuschagne, M. T., & Maartens, H. (2004). Genotype-environment interactions and yield stability analyses of maize in Ethiopia. South African Journal of Plant and Soil, 21(4), 251–254. https://doi.org/10.1080/02571862.2004.10635058
- Badu-Apraku, B., Abamu, F. J., Menkir, A., Fakorede, M. A. B., & Obeng-Antwi, K. (2003). Genotype by environment interactions in the regional early variety trials in West and Central Africa. Maydica, 48, 93–104. https://www.webofscience.com/wos/woscc/full-record/WOS:000185935000002?SID=EUW1ED0E63mVpt2R6bnyqd2yHL1HJ
- Bänziger, M., Edmeades, G. O., Beck, D., & Bellon, M. (2000). Breeding for drought and nitrogen stress tolerance in maize: From theory to practice. CIMMYT.
- Bänziger, M., & Long, J. (2000). The potential for increasing the iron and zinc density of maize through plant-breeding. Food and Nutrition Bulletin, 21(4), 397–400. https://doi.org/10.1177/156482650002100410
- Bhandari, S., & Banjara, M. R. (2015). Micronutrients deficiency, a hidden hunger in Nepal: Prevalence, causes, consequences, and solutions. International Scholarly Research Notices, ID 276469, 1–9. https://doi.org/10.1155/2015/276469
- Bisawas, A., Sarker, U., Banik, B. R., Rohman, M. M., & Talukder, M. Z. A. (2014). Genotype x environment interaction for grain yield of maize (Zea mays L.) inbreds under salinity stress. Bangladesh Journal of Agricultural Research, 39(2), 293–301. https://doi.org/10.3329/bjar.v39i2.20431
- Bocianowski, J., Nowosad, K., & Tomkowiak, A. (2019b). Genotype by environment interaction for seed yield of maize hybrids and lines using the AMMI model. Maydica, 64, M13. https://core.ac.uk/download/pdf/237014896.pdf
- Bruce, W. B., Gregory, O. E., & Barker, T. C. (2002). Molecular and physiological approaches to maize improvement for drought tolerance. Journal of Experimental Botany, 53(366), 13–25. https://doi.org/10.1093/jexbot/53.366.13
- Choukan, R. (2011). Genotype, environment and genotype × environment interaction effects on the performance of maize (Zea mays L.) inbred lines. Crop Breeding Journal, 1, 97–103. https://doi.org/10.22092/CBJ.2011.100349
- Eberhart, S. A., & Russell, W. A. (1966). Stability Parameters for Comparing Varieties 1. Crop Science, 6(1), 36–40. https://doi.org/10.2135/cropsci1966.0011183X000600010011x
- Ertiro, B. T., Beyene, Y., Das, B., Mugo, S., Olsen, M., Oikeh, S., Juma, C., Labuschagne, M., Prasanna, B. M., & Lübberstedt, T. (2017). Combining ability and testcross performance of drought-tolerant maize inbred lines under stress and non-stress environments in Kenya. Plant Breeding, 136(2), 197–205. https://doi.org/10.1111/pbr.12464
- Falconer, D. S., & Mackay, T. F. C. (1996). Introduction to quantitative genetics. Longman.
- Farshadfar, E., Mahmodi, N., & Yaghotipoor, A. (2011). AMMI stability value and simultaneous estimation of yield and yield stability in bread wheat (Triticum aestivum L.). Australian Journal of Crop Science, 5, 1837–1844. https://www.cropj.com/farshadfar_5_13_2011_1837_1844.pdf
- Francis, T. R., & Kannenberg, L. W. (1978). Yield stability studies in short-season maize. A descriptive method for grouping genotypes. Canadian Journal of Plant Science, 58(4), 1029–1034. https://doi.org/10.4141/cjps78-157
- Gasura, E., Setimela, P., & Souta, C. (2015). Evaluation of the performance of sorghum genotypes using GGE biplot. Canadian Journal of Plant Science, 95(6), 1205–1214. https://doi.org/10.4141/cjps-2015-119
- Gauch, H. G. (1992). Statistical analysis of regional yield trials: AMMI analysis of factorial designs. Elsevier.
- Gauch, H. G. (2006). Statistical analysis of yield trials by AMMI and GGE. Crop Science, 46(4), 1488–1500. https://doi.org/10.2135/cropsci2005.07-0193
- Gauch, H. G., & Zobel, R. W. (1996). AMMI analyses of yield trials. In M. S. Kang & H. G. Gauch (Eds.), Genotype by environment interaction (pp. 85–122). CRC Press.
- Gollob, H. F. (1968). A statistical model which combines features of factor analytic and analysis of variance techniques. Psychometrika, 33(1), 1. https://doi.org/10.1007/BF02289676
- Haruna, A., Boakyewaa, A. G., Buah, S. S., Kanton, R. A., Kudzo, A. I., Seidu, A. M., Kwadwo, O. A., & Tejada Moral, M. (2017). Analysis of genotype by environment interaction for grain yield of intermediate maturing drought tolerant top‐cross maize hybrids under rain‐fed conditions. Cogent Food and Agriculture, 3(1), 1333243. https://doi.org/10.1080/23311932.2017.1333243
- Hwalla, N., Al Dhaheri, A. S., Radwan, H., Alfawaz, H. A., Fouda, M. A., Al-Daghri, N. M., Zaghloul, S., & Blumberg, J. B. (2017). The prevalence of micronutrient deficiencies and inadequacies in the Middle East and approaches to interventions. Nutrients, 9, 229–256. https://doi.org/10.3390/nu9030229
- Kiran, K. T., Radhika, K., Kumar, A. A., & Padma, V. (2014). Association studies of grain iron and zinc concentrations with yield and other agronomic traits using F2 populations of two crosses in sorghum (Sorghum bicolor l. Moench). The Journal of Research Angrau, 42, 77–80. https://oar.icrisat.org/9048/#:~:text=Links%3A-,Google%20Scholar,-View%20Statistics
- Li, Z., Coffey, L., Garfin, J., Miller, N. D., White, M. R., Spalding, E. P., de Leon, N., Kaeppler, S. M., Schnable, P. S., Springer, N. M., Hirsch, C. N., & Lukens, L. (2018). Genotype x environment interactions affecting heterosis in maize. PLoS One, 13(1), e0191321. https://doi.org/10.1371/journal.pone.0191321
- Mafouasson, H. N. A., Gracen, V., Yeboah, M. A., Ntsomboh-Ntsefong, G., Tandzi, N. L., & Mutengwa, C. (2018). Genotype-by-environment interaction and yield stability of maize single cross hybrids developed from tropical inbred lines. Agronomy, 8(5), 62. https://doi.org/10.3390/agronomy8050062
- Ma, G., Jin, Y., Li, Y., Zhai, F., Kok, F. J., Jacobsen, E., & Yang, X. (2008). Iron and zinc deficiencies in China: What is a feasible and cost-effective strategy? Public Health Nutrition, 11(6), 632–637. https://doi.org/10.1017/S1368980007001085
- Makumbi, D., Diallo, A., Kanampiu, F., Mugo, S., & Karaya, H. (2015). Agronomic performance and genotype x environment interaction of herbicide-resistant maize varieties in Eastern Africa. Crop Science, 55(2), 540–555. https://doi.org/10.2135/cropsci2014.08.0593
- Maqbool, M. A., Aslam, M., Beshir, A., Khan, M. S., & Tuberosa, R. (2018). Breeding for provitamin A biofortification of maize (Zea mays L). Plant Breeding, 137(4), 451–469. https://doi.org/10.1111/pbr.12618
- Mebratu, A., Wegary, D., Mohammed, W., Teklewold, A., & Tarekegne, A. (2019). Genotype × environment interaction of quality protein maize hybrids under contrasting management conditions in Eastern and Southern Africa. Crop Science, 59(4), 1576–1589. https://doi.org/10.2135/cropsci2018.12.0722
- Mohammadi, M., Sharifi, P., & Karimizadeh, R. (2014). Stability analysis of durum wheat genotypes by regression parameters in dryland conditions. Acta Universitatis Agriculturae et Silviculturae Mendelianae Brunensis, 62(5), 1049–1056. https://doi.org/10.11118/actaun201462051049
- Ndhlela, T., Herselman, L., Magorokosho, C., Setimela, P., Mutimaamba, C., & Labuschagne, M. (2014). Genotype x environment interaction of maize grain yield using AMMI biplots. Crop Science, 54(5), 1992–1999. https://doi.org/10.2135/cropsci2013.07.0448
- Pacheco, A., Rodriguez, F., Alvarado, M., Lopez, M., Crossa, J., & Burgueno, J. (2015). GEA-R (genotype × environment analyses with R for Windows) version 4.0.
- Pacheco, R. M., Vencovsky, D. J. B., Vencovsky, R., Pinheiro, J. B., & Oliveira, A. B. (2005). Use of supplementary genotypes in AMMI analysis. Theoretical and Applied Genetics, 110(5), 812–818. https://doi.org/10.1007/s00122-004-1822-6
- Patterson, H. D., & Williams, E. R. (1976). A new class of resolvable incomplete block designs. Biometrika, 63(1), 83–89. https://doi.org/10.1093/biomet/63.1.83
- Pinthus, M. J. (1973). Estimate of genotypic value: A proposed method. Euphytica, 22(1), 121–123. https://doi.org/10.1007/BF00021563
- Pixley, K. V., & Bjarnason, M. S. (2002). Stability of grain yield, endosperm modification, and protein quality of hybrid and open-pollinated quality protein maize (QPM) cultivars. Crop Science, 42(6), 1882–1890. https://doi.org/10.2135/cropsci2002.1882
- Prasanna, B. M., Palacios-Rojas, N., Hossain, F., Muthusamy, V., Menkir, A., Dhliwayo, T., Ndhlela, T., San Vicente, F., Nair, S. K., Vivek, B. S., Zhang, X., Olsen, M., & Fan, X. (2020). Molecular breeding for nutritionally enriched maize: Status and prospects. Frontiers in genetics, 10, 1392. https://doi.org/10.3389/fgene.2019.01392
- Setimela, P. S., Crossa, J., & Bänziger, M. (2010). Targeting of early to intermediate maize hybrids for yield performance and stability using SREG model. South African Journal of Plant and Soil, 27(3), 207–216. https://doi.org/10.1080/02571862.2010.10639988
- Sibiya, J., Tongoona, P., Derera, J., & Rij, N. (2012). Genetic analysis and genotype × environment (G × E) for grey leaf spot disease resistance in elite African maize (Zea mays L.) germplasm. Euphytica, 185(3), 349–362. https://doi.org/10.1007/s10681-011-0466-2
- Siwela, M., Pillay, K., Govender, L., Lottering, S., Mudau, F. N., Modi, A. T., & Mabhaudhi, T. (2020). Biofortified crops for combating hidden hunger in South Africa: Availability, acceptability, micronutrient retention and bioavailability. Foods, 9(6), 815. https://doi.org/10.3390/foods9060815
- Temple, N. J., Steyn, N. P., Fourie, J., & De Villiers, A. (2011). Price and availability of healthy food: A study in rural South Africa. Nutrition, 27(1), 55–58. https://doi.org/10.1016/j.nut.2009.12.004
- Tena, E., Goshu, F., Mohamad, H., Tesfa, M., Tesfaye, D., & Seife, A. (2019). Genotype × environment interaction by AMMI and GGE-biplot analysis for sugar yield in three crop cycles of sugarcane (Saccharum officinarum L.) clones in Ethiopia. Cogent Food and Agriculture, 5(1), 1–14. https://doi.org/10.1080/23311932.2019.1651925
- VSN International. (2017). Genstat Discovery Software V18.0 (18.0). http://www.genstat.co.uk/
- Worku, M., Makumbi, D., Beyene, Y., Das, B., Mugo, S., Pixley, K., Bänziger, M., Owino, F., Olsen, M., Asea, G., & Prasanna, B. M. (2016). Grain yield performance and flowering synchrony of CIMMYT’s tropical maize (Zea mays L.) parental inbred lines and single crosses. Euphytica, 211(3), 395. https://doi.org/10.1007/s10681-016-1758-3
- Wricke, G. (1962). On a method of understanding the biological diversity in field research. Zeitschrift Für Pflanzenzüchtung, 47, 92–146.
- Yan, W., Hunt, L. A., Sheng, Q., & Szlavnics, Z. (2000). Cultivar evaluation and mega-environment investigation based on the GGE biplot. Crop Science, 40(3), 597–605. https://doi.org/10.2135/cropsci2000.403597x
- Yan, W., & Kang, M. S. (2003). GGE biplot analysis: A graphical tool for breeders, geneticists, and agronomists. CRC Press.
- Yan, W., Kang, M. S., Ma, S., Woods, B., & Cornelius, P. L. (2007). GGE biplot vs. AMMI analysis of genotype-by-environment data. Crop Science, 47(2), 643–655. https://doi.org/10.2135/cropsci2006.06.0374
- Yan, W., & Rajcan, I. (2002). Biplot evaluation of test sites and trait relations of soybean in Ontario. Crop Science, 42(1), 11–20. https://doi.org/10.2135/cropsci2002.1100
- Yan, W., & Tinker, N. A. (2006). Biplot analysis of multi-environment trial data: Principles and applications. Canadian Journal of Plant Science, 86(3), 623–645. https://doi.org/10.4141/P05-169
- Zaidi, P. H., Selvan, P. M., Sultana, R., Srivastava, A., Singh, A. K., Srinivasan, G., Singh, P. R., & Singh, P. P. (2007). Association between line per se and hybrid performance under excessive soil moisture stress in tropical maize (Zea mays L.). Field Crop Research, 101(1), 117–126. https://doi.org/10.1016/j.fcr.2006.10.002
- Zewdu, Z., Abebe, T., Mitiku, T., Worede, F., Abebaw, D., Assaye, B., & Atnaf, M. (2020). Performance evaluation and yield stability of upland rice (Oryza sativa L.) varieties in Ethiopia. Cogent Food and Agriculture, 6(1), 1842679. https://doi.org/10.1080/23311932.2020.1842679