
 ?Mathematical formulae have been encoded as MathML and are displayed in this HTML version using MathJax in order to improve their display. Uncheck the box to turn MathJax off. This feature requires Javascript. Click on a formula to zoom.
Abstract
Despite its growing relevance and far-reaching implications, urban food security has received little attention from the government of Ethiopia. Culturally, food insecurity is commonly expected in rural households. However, it is considerable in urban settings too, which has been hardly recognized in the study area. The general objective of this study was to identify factors determining household food security in urban areas. The study relied on survey data from 365 systematically selected urban household heads. Key informant interviews and FGDs were employed to supplement the structured questionnaire. The binary logistic regression model was used to identify determinants of household food security. The study revealed that only 31% of married households were food insecure, contrary to 80% of single-headed ones. Besides, food insecurity is most prevalent among private house renters, 83%, as opposed to 28% who own their houses. The Foster-Gordon-Thorbecke model revealed that food insecurity’s incident, depth, and severity were 54%, 15%, and 5.6%, respectively. This implies that if the regional government can mobilize to cover 15% of the caloric needs of food-insecure households, it can bring them up to the recommended daily caloric requirement so that food insecurity can be eradicated. At P < 0.05, the binary logistic regression model indicated that sex, house ownership, income, marital status, remittances, and credit services were significant drivers of household food insecurity. The particular characteristics and drivers of urban food security and the vast inequalities within metropolitan regions necessitate customized programs and policies that address the needs of the urban poor. The study recommended that private, government, and NGOs be actively involved and provide top and urgent priority to increase the income-generating capability, stabilize skyrocketing prices, build communal housing, and provide loans with affordable interest rates.
Public Interest Statement
Urban Ethiopia is increasing in multiple forms: population growth, the number and densification of big cities, and urban land expansion. People from the rural sector migrated to the urban sector for a livelihood because of higher employment opportunities, higher wages, better lifestyles, etc., in urban areas, which attract more firms and people towards urban areas.
However, urban food security is becoming an emerging development concern, fundamentally different from food security questions within the rural and agricultural sectors. Yet little is known about the status and determinants of food insecurity in emerging cities like Bahir Dar and Gondar of the Amhara region. Therefore, the study helps development practitioners and policymakers to quantify the challenge and proactively plan the long and short-term plans to reduce the food gap in those emerging regional urban areas.
1. Introduction
According to the State of Food and Nutrition Security in the World (2020), almost 690 million people, or approximately 9% of the global population, did not have enough food or were “undernourished” in 2019. Urban regions have typically been considered as having fewer food insecurity issues than rural places, which may be accurate if merely providing enough food was critical. Food is generally abundant and available in various forms in urban areas, from fresh to prepared to package, and in various retail outlets ranging from traditional markets to corner shops to high-end supermarkets, as well as from local and international formal and informal restaurants and fast food chains. However, abundance does not imply that everyone has equal access to nutritional foods or safe, diversified, healthy, and inexpensive diets (Ruel, Citation2020).
The 2030 Agenda for Sustainable Development puts forward a transformational vision, recognizing that our world is changing, bringing with it new challenges that must be overcome if we are to live in a world without hunger, food insecurity, and malnutrition in any of its forms (FAO, Citation2019). More than 820 million people worldwide are still hungry today, underscoring the immense challenge of achieving the Zero Hunger target by 2030.
Despite overwhelming evidence of rising urbanization in the Global South, the hidden catastrophe of urban food insecurity remains marginal at all regional and local levels (Crush & Riley, Citation2019). Rising food prices exacerbate food instability (FAO, Citation2019) and the bulk of inhabitants in cities rely on the market (exchange economies) to get food (Crush & Frayne, Citation2010). As a result, these city dwellers are impoverished; the majority are socially disadvantaged and underserved regarding infrastructure and institutional assistance. The issue is also supported by the work of various researchers, who note that much of the present literature on food security in Africa has concentrated on the rural poor, with little attention paid to the urban poor, whose livelihoods are as vulnerable (Crush & Riley, Citation2019). Food insecurity in Ethiopia has exacerbated the country’s already precarious economy, mainly rural-urban migration, by increasing indolent people in many towns. Urban population growth (annual %) in Ethiopia was reported at 4.6 % in 2021, according to the World Bank collection of development indicators compiled from officially recognized sources (UN, Citation2018). With this growth rate, Ethiopia’s urban population will exceed 50 million by 2025.
Developing nations have lately seen faster urbanization than industrialized countries, with an average annual rate of change in an urban population of 2.34 and 0.50 percent for 2018., (UN Citation2018). According to the same U.N. assessment, by 2050, around 67% of the developing world and 87% of the developed world will be urbanized. Ethiopia, Africa’s second-most populated country after Nigeria, had a total population of 96.5 million in 2018, with 20.8 percent living in metropolitan areas (CSA, Citation2017). Urbanization is a relatively new phenomenon in Ethiopia. While it is lower than the norm for African countries (21 percent vs. 37 percent; WFP-Ethiopia, Citation2009). Its yearly pace of expansion (4.6 percent) is quicker than the continent’s (4 percent) existing metropolitan centers are growing while new ones are sprouting up.
The Amhara region, formerly known as Region 3, has a population of over 21 million, with roughly 12.3% living in cities (2021 est). More than 44.4% of the overall population of the region is impoverished (earning less than a dollar daily), making the region’s food security situation more hazardous than the national average (37%) (UNDP Ethiopia, Citation2018).
Even though Ethiopia has enormous natural resources, most of its socio-economic metrics are severely poor. As a result, chronic and transitory food insecurity is prevalent and severe in the country’s rural and urban areas (FAO, Citation2014). Like many developing countries, Ethiopia’s food security and vulnerability evaluations have traditionally focused on rural areas. However, several pieces of research in the sector have focused on the country’s rural areas (Aragie & Genanu, Citation2017; Hussein & Janekarnkij, Citation2013; Yehuala et al., Citation2018), to name a few. However, such incomplete assessments do not verify realities at the ground level and mask the country’s genuine urban food insecurity problem. Furthermore, such studies do not investigate the fundamental causes of household food insecurity in specific regional urban settings.
Food insecurity varies by location, socio-economic status, and living circumstances. As a result, researching food insecurity in major regional cities is difficult. The findings may provide insight into development planners’ efforts to fight the problem at the local level. Urban food security is receiving special attention since ensuring national food security is one of the cornerstones of the country’s long-term economic development and poverty reduction (UNDP Ethiopia, Citation2018).
A closing discussion describes high-level trends and under-researched areas of food security in Ethiopia, according to a systematic review based on 267 articles linked to food security in Ethiopia (Cochrane, Citation2019). Such a fast shift of civilization to urban settings has resulted in food insecurity affecting significant cities in the Amhara region and Ethiopia. Food insecurity has distinct consequences in cities. That is why the study is interested in investigating the status and determinants of food security that will add to the knowledge in emerging large cities of the Amhara Region.
Ethiopia originally developed a food security policy in 1996 and launched a food security program in 1998 (FDRE, Citation2002). However, food insecurity and undernutrition have been critical societal issues since then. As a result, knowledge about the subject in the studied region is scarce. When we reviewed local literature, many used caloric intake and the household food insecurity access scale (HFIAS), and others used either the Household Hunger Scale (HHS) or the Household Food Consumption Score (FCS) independently, which could not help to identify specific realities and depth of the issue in emerging regional cities. Several studies in Ethiopia have primarily focused on food availability and access (Asenso-okyere et al., Citation2013; Beyene, Citation2016; Gezimu Gebre, Citation2012; Motbainor et al., Citation2016; Wolderufael, Citation2015), while others used a 24-hour or seven-day recall approach to capture the food dimension (Fekadu & Mequanent, Citation2010) who classified into two. However, this study uses the FGT Index to assess the status, depth, and severity of food insecurity and what variables influence households’ food insecurity in the research region in rising big towns of Amhara regional states’ focusing on Bahir Dar and Gondar.
1.1. Conceptual Framework of the Study
Figure shows how demographic, socio-economic, and institutional variables explain urban food insecurity. Marital status, house ownership, higher income, food price, remittance, and access to institutional support such as access to credit enhance household food security. On the other hand, price fluctuations, low income, large family sizes, and unemployment lead to household food insecurity. Moreover the expected signs of the independent variables are indicated in Table .
Figure 1. A schematic diagram showing the relationship between predictor variables and household food in/security.
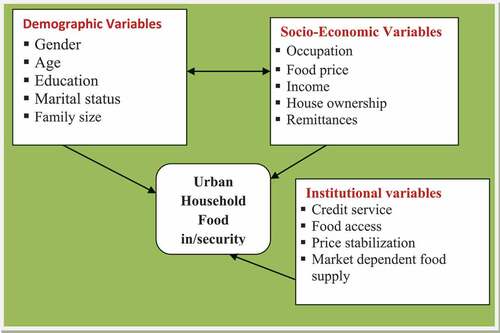
Table 1. Summary Table of Sample kebeles and Households
Table 2. The expected sign of the explanatory variables
2. Description of the Study Area
2.1. Description of Bahir Dar City
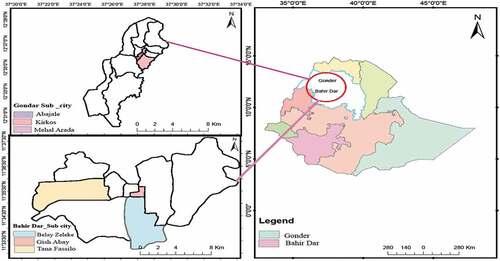
Figure , shows the map of Bahir Dar and Gondar cities. Bahir Dar town (“sea shore” in Amharic) is the capital city of the Amhara National Regional State and the seventh largest city in Ethiopia (Kindu et al., Citation2020). The town is 565 km northwest of the capital, Addis Ababa, and has an average altitude of 1830 m a s l. The absolute location of Bahir Dar City is about 11° 37’ north and 37° 25’ east. According to CSA (Citation2017), the total population of Bahir Dar city is about 332,865. Of which 165, 864 are male, and 166, 992 are female. The town is situated on the banks of Abay (the Blue Nile—the longest river in the world), right after the river flows out of Lake Tana, which is the source of its beauty. Bahir Dar has six urban sub-cities, (Belay-zeleke, Atse—Tewodrose, Dagmawi-minilike, Tana-Fasilo, Sefeneselam and Shume-abo). The urban sub-city size is only about 1.5% compared to the size of Lake Tana’s surface area (3111 km2). In 2002, Bahir Dar was awarded the UNESCO Cities for Peace Prize for successfully addressing the challenges of rapid urbanization (Achenef, Citation2020).
Figure 2. Map of Bahir Dar & Gondar city, Ethio-GIS.
Bahir Dar is a city unlocking its tourism potential, but it is rising. This is, in part, due to the natural beauty of the city and its cultural and historical treasures. Bahir Dar is well known for its wide, clean avenues with palm trees and colorful flowers. However, increasingly, it is becoming known as a city that hosts large conferences and sporting events. Of course, Bahir Dar has long been a city for its notable tourist attractions, including Lake Tana, Ethiopia’s largest lake and the principal reservoir of the Nile; the Blue Nile Falls; ancient monasteries that lie on Lake Tana. Besides, it is believed that it has been the holding place of the Ark of the Covenant for centuries. These are some of the tourist attractions that have made Bahir Dar one of the most visited places in Ethiopia. Recently-built additions, like the new Bahir Dar Stadium, which can accommodate 50,000 spectators, also significantly attract tourists to the city (Ethiopian Business Review: Addis Ababa, Citation2022).
2.2. Description of Gondar City
Gondar is situated in the Northwest of Ethiopia, Amhara National Regional State. As can be seen from Figure , the absolute location of Gondar is 1203’ north and 37°28’ east. Gondar is 727 km from Addis Ababa, the capital city of the federal government of Ethiopia, and 180 km from Bahir Dar, the capital city of Amhara National Regional State. Gondar has a total of 192.3 km2 with undulating mountainous topography (Tegegne et al., Citation2016). The city is grouped into six administrative sub-cites (Jantekel, Arada, Zobel, Fasil, Maraki, and Azezo-Tsuda) with their own legislative, executive, and judiciary organs. According to the Central Statistics Authority, hereafter (CSA, Citation2021), the total population of Gondar city was 443, 156 of which 217, 107 were male and 226, 054 were female. Gondar is a significant destination for urban-rural migrants and a major tourist and business hub in North West Ethiopia, contributing to population growth in the city (Tegegne et al., Citation2016). The city of Gondar, in Northern Ethiopia, won the prestigious status of a classified The United Nations Educational, Scientific and Cultural Organization”, hereafter, UNESCO World Heritage Site, on 26 October 1979, mainly because in it stands the castle compound locally known as the Atsie Fasil Ghimb. This palace compound encapsulates much of the country’s political and religious history between the mid-seventeenth century and the mid-nineteenth century when Gondar was the capital of the Christian kingdom of Abyssinia (Nurhssen, Citation2016).
However, life is worsening in metropolitan cities with an alarmingly growing urban population and migration, skyrocketing prices, and a high unemployment rate. Poor infrastructure, inaccessibility of essential services, the severe problem of urban residential houses, and various urban evils make life unaffordable and very difficult for poor households in both cities.
3. Research Methodology
3.1 Research Design: The study employed a concurrent mixed methods research design composed of quantitative and qualitative research methods. The rationale for selecting both methods is due to the need to provide a more vigorous analysis, as both are insufficient to capture the trends and details of a situation (Ivankova et al., Citation2006). A quantitative and qualitative research approach was employed since food security studies are complex and multidimensional and need both methods at a time
3.2 Sampling techniques: Gondar and Bahir Dar, the two major cities of the Amhara Region, were selected purposively based on the understanding that it reflects the realities of typical large towns and cities of the region, which play a considerable role in the regional urban food security program and poverty reduction. Including more than one city is believed to show historical and spatial variations concerning vulnerability causations and food insecurity situations. The study employed multi-stage sampling techniques. First, six sample urban kebele administrations were selected from the two big cities using simple random sampling. Accordingly, Belay-zeleke, Gish-Abay, and Tana-Fasilo, from Bahir Dar and Jantekel, Arada, and Fasil from Gondar city were selected. Second, to determine sample size, the (Kothari, Citation2004) formula was employed as shown below:
Where n = sample size, z = value of standard variation at 95% confidence interval (1.96), p = sample proportion = 35% (0.35) and q = 1–p (Kebede, Citation2013), N = the total number of the urban household population, e = the estimate should be within 5% of the actual value.
Finally, using the sample size formula, 346 households were selected for the household survey. However, for fear of missing data with an increment of 10% additional sample, the appropriate sample size was determined to be 382. Morse (Citation2000) indicated that it is advisable to oversample by 10%—20% in case there are non-responses. In this regard, 17 questionnaires (4.5%) were not correctly filled for the final analysis making the total sample to be 365 as indicated in Table .
In the qualitative sampling, five key informants in sample kebeles of each city who had lived for a long time and have a wealth of experience and knowledge to provide detailed information took part in the interview process. As a result, one male and one female household head, the kebele administrator, a development agent, and a food security expert participated. Besides, a total of two focus group discussions in the sample cities based on their chief experiences and exposure to the problems under investigation were employed for the study. Each focus group discussion includes eight participants from different socio-economic classes, the elderly, youth, and male and female-headed households.
3.3. Data Collection Techniques
Both quantitative and qualitative data collection methods were employed to obtain primary and secondary data. This study’s primary data collection methods include a household survey questionnaire, focus group discussions, and key informant interviews. Secondary data were obtained from documents/reports of regional or city sector offices, particularly from the city office of Finance and Economic Development.
Survey questionnaire: quantitative data gathered in this study involved collecting information through a structured questionnaire administered to sampled household heads in a sample of six kebeles. A questionnaire survey was developed based on the objectives and literature reviews. As a result, the questionnaire contains questions on the demographic and socio-economic characteristics of the sample households, the type and amount of foods consumed per month and within 24 hours before the survey, and the significant determinants of food insecurity were included in the questionnaire. A pretest was provided for some selected sample households to check the validity of the questionnaire. It provided valuable feedback and allowed the principal investigator to evaluate the extent to which the questions generated the desired responses, the interview duration, and the patterns of the expected results. The principal investigator trained the enumerators to present and explain each question to the participants. Expressly, enumerators were advised to inform each participant of the purpose of the study. Besides, they were trained about the ethical issues that should be kept confidential before the interview.
Key Informant Interviews: Key informants in both cities were interviewed to understand the households’ food security situation. The principal investigator conducted the interview using pre-prepared interview guiding questions that will supplement the findings from the household survey. With the participants’ awareness, a mobile phone was used to record their voices and to take pictures.
Focus Group Discussions:A total of two focus group discussions in the sample cities were undertaken based on prepared guiding questions to supplement the quantitative data. FGD guiding questions help guide the conversation and obtain relevant information pertinent to the study’s objective. The FGD checklists were semi-structured and focused on the realities and problems associated with food prices, housing, income, access to credit services, remittance received, and the major determinants.
3.4. Data analysis techniques
Both quantitative and qualitative data analysis techniques were employed to investigate people’s perception of food security and the severity of food insecurity and to explore the effect of soaring food prices and private rental houses in the study areas. The information collected from key informants, FGD participants, and direct observation was documented and analyzed thematically and textually to corroborate the structured questionnaire. Accordingly, two themes were identified: the status of household food insecurity and the significant determinants. Such themes were, in turn, associated directly or indirectly with household food security outcomes.
In addition, MAXQDA version 2020 was used for qualitative data analysis. Qualitative data, mainly participant opinions and perceptions, were obtained from open-ended questionnaires, key informant interviews, focus group discussions, and personal observations and were analyzed qualitatively using common expressions and thoughts.
On the other hand, the quantitative data was coded, edited, and entered into the statistical package (SPSS version 22) for data analysis. Descriptive statistics such as frequencies, tables, and percentages were used for data presentation, whereas inferential statistics such as Chi-square and T-test were used to show relationships or differences. The Binary logistic regression model and the Foster-Greer-Thorbecke model were used for the study.
3.4.1. The Binary Logistic Regression Model
A binary logistic regression model was employed to identify determinant variables affecting households’ food /security. Such a model is suitable when the dependent variable is a dummy, in this case, household food security. Household food security is measured using dietary energy supply (kcal). In calculating the kcal intake of the sample households, the amounts of calories available to a household were determined using a modified version of the regional food balance model, also used by (Smith & Subandoro, Citation2007) and (Messay, Citation2009). The results were then converted into kilograms using the food conversion table and changed into kilocalories adopted (FAO, Citation2003; Fekadu & Mequanent, Citation2010; Messay, Citation2009). These results were then divided by the number of household members as adult equivalent and the number of days in the recall period.
This study used a minimum of 2100 kilocalories per capita daily to identify secure and insecure food households. This is because the government of Ethiopia has set the minimum acceptable weighted average food requirement per adult equivalent per day to 2100 kcal (Abebaw et al., Citation2021; Bogale & Shimelis, Citation2009). In this regard, households whose per capita available kilocalorie was more significant than the minimum demand (> 2100 kcal) were categorized as food secure (coded as 0), while families experiencing kilocalorie deficiency (< 2100 kcal) were considered food insecure (coded as 1). As shown in the conceptual framework (Figure ), demographic, socio-economic, and institutional variables were predictors of the model. Assumptions of the model, such as multicollinearity, non-linearity, and large sample size, were considered. Besides, the model’s fitness was checked using the Pearson chi-square test, Hosmer-Lemonshow test, classification table, and pseudo R square.
3.4.2. Measurement of Incidence, Depth, and Severity of Household Food Insecurity
Among the various measures of food insecurity, the Foster—Greer-Thorbecke (FGT) food security index is the most commonly applied in food security analysis (Abebaw et al., Citation2021). This index was initially suggested by (Foster et al., Citation1984) and had several desirable properties that have been enhanced in recent years for food insecurity analysis (Abebaw et al., Citation2021); (Idrisa et al., Citation2008; KHATRI-CHHETRI & Lall, Citation2006; TSEGAY, Citation2009). This model was used for the present study to measure the household head count index (incidence of food insecurity), food insecurity gap (depth of food insecurity), and the square of food insecurity gap (severity of food insecurity) among the food insecure households. Amsalu et al. (Citation2012) indicated that the headcount ratio describes the percentage of sampled households whose per capita income or consumption is below a predetermined subsistence level of energy (2100 kcal). Alem (Citation2007) added that the headcount index measures the extent of undernourishment of households.
On the other hand, the food insecurity gap, FGT (α = 1), measures how far the food insecurity of households, on average, is below the subsistence level of energy. Therefore, the FGT index measures the mean of household food insecurity gaps raised to the aversion parameter a, representing the severity of food insecurity. The weights attached to the sample respondents were calculated based on the calorie requirement to adult equivalent recommended by the government of Ethiopia (Bogale & Shimelis, Citation2009). The mathematical formula of the FGT model is specified as follows:
Where: n = the number of sample households,
q = is the number of food-insecure households,
m = is the cut-off between food security and food insecurity (expressed here in terms of caloric requirement),
yi = is the food calorie intake per adult of the ith household, and
a = is the weight attached to the severity of food insecurity
In this model, if m < yi, the household is food secure, and if m > yi, the household is food insecure (Abebaw et al., Citation2011a). Suppose the weight attached to the severity of food insecurity is zero. In that case, the ratio measures the incidence of food insecurity, whereas α = 1 measures the food security gap (depth of food insecurity), and α = 2 measures the severity of household food insecurity. In other words, if the food security gap is squared, the result could be the severity of food insecurity. Thus, the index of severity, F (α) = 2, gives greater attention to the most food-insecure households by weighting them according to the square of their shortfall below the subsistence level (Abebaw et al., Citation2011b; TSEGAY, Citation2009). After the extent of food insecurity was measured and calculated, it was verified whether there were statistical differences between the variables and the independent variable.
4. Results and Discussions
4.1. Demographic variables and Food Security status of households
Sex of household: As seen in Table , about 44% of male-headed households were food insecure, and the rest were secure. On the other hand, 70% of female-headed households were food insecure, and 30% were food secure. This implies that female-headed households are more food insecure compared to male-headed households. These results were statistically significant at P < 0.001. Concerning this, one female-headed household in Gishabay Keble suggested the magnitude of the problem (being a female-headed household head) her opinion in the following ways:
She started by saying: many female-headed households in my kebele, including mine, are double burdens working in and outside the house. I have four children, and currently, all of them are students. Hence, buying food, learning equipment, and paying house rent made life more complex. I tried to be a member of the safety net beneficiaries, but I could not participate in the program due to corruption. However, I can qualify for the criteria to be a recipient. I do not know what I will do in the future to feed and teach my children (Female-headed household, March 2021).
Table 3. Demographic Characteristics and kilocalorie intake of households per adult equivalent per day
Marital Status: As shown in Table , 194 respondents were married, and 171 were single. While looking at married household heads, 61 (31%) are food insecure, and 133 (69%) are food secure. On the other hand, in single-headed households, 136 (80%) are food insecure, and 35 (20%) are food secure. The positive relationship between married couples and food security is related to the economic scale of consumption items purchased and the pooling of available resources in one way or another. Married households may reduce expenditures that would have been spent separately.
Household size: Household size refers to the total number of household members living and consuming from the same household and is expressed in adult equivalent. It is an important variable that determines the state of household food security. Thus, it was hypothesized to have a negative association with food security since an increase in household size implies more people being fed from limited resources.
When looking at (Table ) shows households with the smallest size (1–3), 44 (53%) are food insecure, and 39 (47%) are found to be food secure. In comparison, households with family sizes of 4–6 are 244. Of these, 140 (57%) are food insecure, and 104 (43%) are food secure. Finally, the third category of household size is (>7), which is 38. Among these, 24 (63%) are food insecure, and 14 (38%) are food secure. From this, we can conclude that as household size increases, the chance of food security decreases. A study in Mozambique, for instance, shows that large household size is negatively associated with food insecurity (James & Marie, Citation1999).
4.2. Socio-economic & Institutional Variables
Food expenditure: As shown in (Table ), food security status and expenditure have a positive and significant relationship at P < 0.01. This means that as household food expenditure increases, the chance of food security also increases. This is because more expenditure means more sources of income and lowers household food insecurity. However, at present, higher prices of food and related materials decrease the purchasing capacity of urban households. Much of the income is devoted to food, which indicates poverty. Concerning this, Efsa (Citation2008) argued that food price increases lower real income and exacerbates food insecurity and malnutrition among the poor by limiting the quantity and quality of food consumed.
Table 4. Socio-economic & institutional variables and Kilocalorie consumption/A.E./day
Household Income: Income plays a crucial role in a household’s accessibility to food. The survey result showed a positive relation between monthly income and food security. As can be seen in Table , food security, holding other variables constant, increases as monthly income increases. The result corresponds with the prior expectation and the possible explanation that income determines the purchasing power of the household with the prevailing price. So, households with higher daily income per adult are less likely to become food insecure than low-income households.
Housing ownership: It was a two-category variable differentiating privet house renters and having their own houses (including kebele and government houses). According to Table , from the total sample of households, food insecurity was most prevalent among private house renters (61%). Among them, the majority (83%) are food insecure, and only a few (17%) are found to be food secure. On the other hand, those who own houses, including kebele, and very few government own houses comprise 39% of all the sample households. From this, the majority (72%) are food secures, and just a few (28%) are found food insecure, which indicates how much housing ownership in urban cities plays a vital role in household food security.
Access to credit: Credit is a means to boost production and expand income-generating activities (Aliou & Manfred, Citation2001; Diagne, Citation2015). Based on the results, those households that do not have access to credit services 63% (Table ). Out of this, 72% were food insecure, and the remaining were food secure. Contrary to this, those households with access to credit have 136 (37%). Among these, 50 (37%) are food insecure, and the majority, 86 (73%), are food secure. Thus, a household with access to credit does initiate investment in various activities and achieves food security. Therefore, it is hypothesized that a family with access to credit is more likely to be food secure.
In a focus group discussion held in Fasilo sub-city, Bahir Dar, a female-headed household owner, Aleminesh Zerfu, 52 years old, stated that: after I took credit from Amhara credit and saving institution, my two children and I were working hard and changing our life. I can even send my daughter to a privet college (Alemnesh Zerfu, Fasilo sub-city Bahir Dar).
4.3. Households’ Incidence, Depth, and Severity of Food Insecurity
The results of the summary of the household incidence, depth, and severity of food insecurity, are presented in Table . One hundred ninety-seven sample households (54%) could not meet their minimum subsistence requirements, and 168 households (46%) could meet their minimum subsistence requirements. The result showed that in 2020/21, in Bahir Dar and Gondar cities, the headcount ratio, shortfall, and severity of food insecurity were 54%, 15%, and 5.6%, respectively.
Table 5. FGT: Food Insecurity Index Result
Thus, the headcount ratio from the food insecurity index indicated that the incidence of food insecurity was 54%, which implies that 54% of the sample households cannot get the minimum recommended calories for subsistence, 2,100 kcal per day per adult equivalent. The finding is much higher than the research result (Wolderufael, Citation2015), who studied the status of urban Amhara, and the author found that the headcount, depth, and severity were 34%, 6%, and 2%, respectively.
The food insecurity gap, a measure of the depth of food insecurity, pointed out that each food-insecure household needed 15% of the daily caloric requirement to meet the recommended daily caloric requirement level. The finding implies that families should be supplied with 15% of the minimum daily calorie requirement to eliminate food insecurity. The average extent of the calorie deficiency gap for the sampled households was, therefore, 315Kcal/A.E./day, which means, on average, 315Kcal/A.E./day of additional food energy would be needed to lift the households out of food insecurity. Then, at least in theory, food insecurity could be eliminated. Moreover, the squared food insecurity gap result from the food insecurity index determined that the severity of food insecurity in the study area was 5.6 percent.
Based on FGT indices, he discussed finding out the status of food/security in the Amhara region. The result shows that in the urban Amhara region, the headcount ratio, shortfall, and severity of food insecurity were 34.1%, 6.1%, and 2.5%, respectively (Wolderufael, Citation2015). As stated, the result is higher than the whole Amhara region (Wolderufael, Citation2015).
According to (Aragie & Genanu, Citation2017), who studied the level and determinants of food security in the North Wollo zone and employed the same technique, the percentages of food insecure and secure households were 42% and 58%, respectively. The calculated value for the food insecurity gap was 14 percent, and the severity of food insecurity is about 7.15 percent.
In line with this, the result is more than DireDawa, (Feleke & Bogale, Citation2010a), which stated that the headcount ratio revealed that 43% of sampled households were food insecure. The gap and severity of food insecurity were estimated to be 13 and 5.9%, respectively.
In addition to this, the status of food insecurity in Bahir Dar and Gondar is much higher than in a study conducted in the Oromiya region, where the three FGT indices results, headcount index, food insecurity gap, and severity of food insecurity, were found to be 0.375, 0.1095, 0.0419 respectively (Hana & Dereje, Citation2016).
A disaggregated analysis of the extent of food insecurity by location presents a complete picture of the food consumption pattern of the region. The results of the summary of the household incidence, depth, and severity of food insecurity by location of households are also presented as follows: Food insecurity is relatively higher in Bahir Dar with a food insecurity headcount index of 129 (55%), shortfall index 5.3% and severity of 1.3 % respectively, than Gondar counterpart of 68 (52%), 4% and 1.2% (Table ).
A qualitative description confirms such a finding: As a young single mother of 40 years old, having two kids who came from Gonder, she said, “I was living a happy life with my two kids and husband. Unfortunately, when my husband left due to the civil war, we began suffering and were forced to move to Bahir Dar in search of a cheap rental house and seeking job opportunities. However, nothing is good, and life is getting worse here too. It is the story of many of my friends who lost their partners and were displaced due to a civil war like mine”.
Table 6. Comparison of FGT between sample cities
4.4. Determinants of Household Food Security
The binomial logistic regression model was used to identify determinants of household food security in the study area. Eleven predictor variables were selected to explain the criterion variable (household food security). Out of the total predictor variables, eight variables were significant at 1% and 5% probability levels (Table ). The omnibus test of model coefficients has a Chi-square value of 2.42 on 1% degrees of freedom, which is enormously significant at p < 0.01, indicating that the predictor variables selected have a high joint effect in predicting the status of a household’s food security status. Hosmer and Lemeshow’s test of 0.092 showed that the model is fitted. The predictive efficiency of the model showed that out of the 365 sample households included in the model, 92% were correctly predicted.
Table 7. Binary logistic regression results
The multicollinearity among independent variables was checked, and no significant violations were observed. The model’s fitness was assessed using pseudo-R2, and the combined independent variables explained about 92 % of the variances in the model.
Sex: is a positive and significant (b = .2.609, s.e = .765, p = 0.001) predictor of the probability of being food secure, with the OR indicating that for every one unit increase in the male-headed household, the odds of becoming food secure has changed by a factor of 13.590 (meaning the odds are increasing), with 95%, CI of 3.307 to 60.813. The finding is consistent with the results (Aragie & Genanu, Citation2017). The number of Food insecure female households is higher in proportion than males.
Contrary to this, assuming other variables are kept constant at their mean values, a household headed by a male is more likely to be food insecure than a female-headed household. A possible reason may be that female household heads are more responsible and pay attention to their family. Therefore, having a woman as head of household implies higher caloric availability due to differences in spending priorities between males and females (Feleke & Bogale, Citation2010b).
Marital status: is a positive and significant (b = 2.984, s.e = .836, p = 0.000) predictor of the probability of being food secure, with the OR indicating that for every one unit increase in the married household, the odds of becoming food secure have changed by a factor of 19.770 (meaning the odds are increasing), with 95%, CI of 3.841 to 101.756. The result is consistent with the findings of Feleke and Bogale (Citation2010a), which revealed a negative relationship between food security due to the economic scale of consumption items purchased by couples and the pooling of available resources. Accordingly, married households reduce expenditures that would have been spent separately.
Credit service: is a positive and significant (b = 4.501, s.e = .973, p = 0.000) predictor of the probability of being food secure, with the OR indicating that for every one unit increase on a credit service received by households, the odds of becoming food secure has changed by a factor of 13.645 (meaning the odds are increasing), with 95%, CI of 3.145 to 59.200. The result for the urban sample shows that other things being constant, the odds ratio in favor of household vulnerability to food insecurity decreased by a factor of 13.645 as the credit service of the family increased by one unit. This implies the importance of receiving credit services in improving a household’s food security status. It is because credit service equips individuals with an additional and extra chance to pursue other alternative means to make a living. The finding is consistent with the results of (Feleke & Bogale, Citation2010b), which revealed that the variable under consideration is negatively related to food insecurity. The possible explanation is that credit allows the household to be involved in income-generating activities so that derived revenue increases the household’s financial capacity and purchasing power to escape the risk of food insecurity.
Ownership of house: is a positive and significant (b = 3.988, s.e = .836, p = 0.000) predictor of the probability of being food secure, with the OR indicating that for every one unit increase in ownership of house of households, the odds of becoming food secure has changed by a factor of 53.920 (meaning the odds are increasing), with 95%, CI of 10.466 to 277.793. The sign of the coefficients of housing ownership of the household head showed a positive and significant relationship with food security at a 5% probability level. It is because an increase in housing ownership will have an effect. After all, ownership of the house and its decrease in rental house expenses will change expenditure. Thus, housing ownership increases the stable income so that the capacity of the households to consume more will grow.
According to a Female household head Mrs, Zewdie, 42 yrs old, from Arada kebele, Gondar, expressed as follows: One of the most severe causes for food insecurity is the highest monthly rental expense she paid for two small rooms with her four children from her minimal and insignificant income earned from selling local drinks (Araki and Tella).
Income: is a positive and significant (b = 7.103, s.e = 1.516, p = 0.000) predictor of the probability of being food secure, with the OR indicating that for every one unit increase in household income, the odds of becoming food secure has changed by a factor of 1215.225 (meaning the odds are highly increasing), with 95%, CI of 62.320 to 23,696.773.
The finding is consistent with the results of (Ejigayhu Sisay, Citation2012). Food insecurity, holding other variables constant, decreases by a factor of 6.1% as monthly income increases by one level. According to (Motbainor et al., Citation2016), monthly household income is the other significant predictor of household food insecurity. It was found that households with the lowest quartile of monthly income were more likely to be food insecure than the higher quartile.
Age: The results for the urban sample families reveal that household head age has a positive and substantial influence on food security status. H.H. Age is a positive and significant (b = 1.758, s.e = .639, p = 0.006) predictor of the probability of being food secure, with the OR indicating that for every one-unit increase in household age, the odds of becoming food secure have changed by a factor of 5.798 (meaning the odds are increasing), with a 95% confidence interval of 1.658 to 2 0.282. Other factors being equal, the odds ratio in favor of household susceptibility to food insecurity fell by a factor of 5.798 as household age increased by one unit. The outcome is consistent with theoretical evidence that as H.H.’s age grows, the experience may boost awareness of the potential be nefits of diverse livelihood options and improve H.H.’s quality of life.
According to the findings (Ejigayhu Sisay, Citation2012), the age of the household head was discovered to be contradictory to what we expected. The results revealed that age had a favorable and significant impact on family food insecurity. Even though it goes against our assumptions, it is connected to the effects we witnessed in the descriptive section. One probable cause is that when a person’s age increases, they may lose their energy and employment and become unable to participate in other income-generating activities. Keeping other parameters constant, the marginal effect on the side of food insecurity increases by a factor of 0.6% when the age of the
household head increases by one year. Among the elements included in the model, sex, marital status, remittance, credit obtained, and house ownership were shown to be important in affecting family susceptibility to food insecurity, as were income, food spending, and age. Education, employment, and family size, on the other hand, were shown to be insignificant in affecting household food security.
5. Conclusion and the way forward
5.1. Conclusion
Urbanization and urban migration resulted in alarming population pressure implying increased food demand. Food accessibility and affordability are the main factors for household food insecurity in urban settings. In addition, poverty, irregular household incomes, unemployment, and dynamic and complex livelihoods are the root cause of urban household food insecurity. But, food security status and determinants in all emerging cities of the Amhara region were not inclusively studied. Therefore, this study was conducted only in Bahir Dar and Gondar cities as a benchmark to provide valuable information for stakeholders.
Understanding the causes and current state of food security would assist policymakers in developing and implementing more effective policies and programs for the poor, ultimately aiding in improving food security in the growing urban settings. This study aimed to objectively quantify the degree and drivers of food insecurity in such major cities in the Amhara Region. Descriptive statistics, the Foster-Greer-Thorbecke (FGT) model, and Binary Logistic Regression were used to examine the data. The qualitative sections were also presented thematically and using qualitative descriptions.
The study found differences in food security status among the urban poor. The study’s findings revealed that food insecurity was widespread and severe among the urban poor. Among the factors studied, housing ownership contributes the most to households’ food insecurity. As a result, households with low income, single parents, female household heads living in rental dwellings, and who do not get remittances and access to credit were the most food insecure and poor in the research location. On the other hand, the research found that investments in income generation and diversification, communal housing, access to training, credit services, and price stabilization had an important influence on reducing urban food insecurity.
The binary logistic regression model revealed that eight of the eleven dependent variables (house hold age, gender, marital status, income, food expenditure, housing ownership, access to credit services, and remittance received) are found to be statistically significant determinants of household food security in the study cities. Furthermore, descriptive and qualitative statistics reveal that households in Bahir Dar are more likely to be insecure than those in Gondar.
Building a future with more food-secure families necessitates appropriate policies and an enabling environment, which requires a thorough knowledge of the status and drivers of food security, which vary significantly from one location to the next. It necessitates the use of a combination of mixed strategies and policies, as well as elements that have a substantial impact on food security status. As a result, the concerned bodies must devise new income-generating activities, price stabilization, communal housing, and commercialization policies centered on small-scale businesses that can alleviate growing urban poverty and improve food security in the target cities and many other similar towns and cities in general.
Based on the findings, a clear majority of households in the sample experience a regular inability to access “sufficient, safe, and nutritious food to maintain a healthy and active life to access food to achieve,” per FAO’s definition of food security (FAO, Citation2008). These urban households regularly worry about having enough food and, sometimes, cannot access sufficient food to meet their needs.
Many local governments in Ethiopia lack the institutional capacity to rapidly implement effective policies to meet the needs of the growing numbers of urban poor. Yet local governments do have options to shore up household food security. For example, our results suggest that ensuring access to credit and saving institutions, training and financial assistance quality training, and education opportunities for poor urban dwellers may strengthen food security in the long term. But overarching urban policies in the medium term—such as transportation and water and sanitation infrastructure improvements—can reduce poverty levels and disease risk and may reduce vulnerability to food insecurity among low—and middle-income households.
Finally, our findings remind us of the critical role of governance in food systems within urban areas. Both informal and formal governance arrangements for food retailing influence household food purchases and food security. Through infrastructure and improved urban services, local governments can strengthen household food security directly by reducing the economic burden of procuring food, the rising cost of basic needs, and higher rental house prices.
Even though the planet is now more urban than rural, urban poverty and economic inequality are at record highs. Sustainable cities will depend on ensuring that the growing numbers of urban poor are food secure. If the future of African countries lies primarily within cities, then to feed the future, policy and research agendas that focus on ensuring urban food security must be pursued.
All authors have read and approved the final manuscript
Ethical Statement
Ethics approval and consent to participate
Not applicable
Consent for publication
Not applicable
Availability of data and materials
The datasets used and/or analyzed during the current study are available from the corresponding author on reasonable request.
Acknowledgements
I would like to express my deepest gratitude to Dr. Tesfamaryam, Dr. Cherie, Ass professor Mulualem and Anteneh Mekuria for their unreserved support and assistance throughout the paperwork.
Disclosure statement
No potential conflict of interest was reported by the author(s).
Additional information
Funding
Notes on contributors

Dersolegn Mekonen
Dersolegn Mekonen Geleta. I have received my BA from Addis Ababa University and my MA in Geography and Environmental Studies from Bahir Dar University. I am a lecturer at Debre Tabor University in the Faculty of Social Science and the Department of Geography and Environment. I present award-winning papers such as the first African graduate scholars conference organized by Bahir Dar University (2020).
I have also participated in the Annual National Conference of the Institute of Disaster Risk Management and Food Security Studies at Bahir Dar University, 2023, and the International Conference on Water, Energy, and Food Security organized by Florida International University (2022) to mention a few. Dersolegn’s research focuses on rural and urban livelihood, food security, poverty, and population-related issues. This manuscript is the result of one of the objectives of my dissertation.
Arega Bazezew Berlie
Arega Bazezew is my principal and internal advisor; he is a Professor and got his Doctor of Philosophy (Ph.D.) in 2013 from South Africa. He is a senior lecturer, researcher, and advisor at Bahir Dar University, Department of Geography and Environmental Studies. He published many articles on Livelihoods, Food security, Vulnerability, Climate change, and Drought.
Tesfahun Kassie
Tesfahun Kassie is my co-advisor; he is an Assistant Professor and got his Doctor of Philosophy (Ph.D.) in 2017 from Bahir Dar University. He is a senior lecturer, researcher, and advisor at Bahir Dar University, Institute of Disaster Risk Management, and Food Security Studies. He published many articles on Disaster, Vulnerability; Resilience, Urban Risk; Livelihood vulnerability; Food Security.
References
- Abebaw, S., Betru, T., & Wollie, G. (2021). Prevalence of household food insecurity in Ethiopia during the COVID-19 pandemic: Evidence from panel data. https://doi.org/10.1016/j.sciaf.2022e01141
- Abebaw, S., Penporn, J., & Vute, W. (2011a). Dimensions of Food Insecurity and Adoption of Soil Conservation Technology in Rural Areas of Gursum District, Eastern Ethiopia (Vol .31, pp. 308–318). Kasetsart journal (social science), Thailand.
- Abebaw, S., Penporn, J., & Vute, W. (2011b). Dimensions of Food Insecurity and Adoption of Soil Conservation Technology in Rural Areas of Gursum District, Eastern Ethiopia, 308–22. 0125–8370.
- Achenef, A. (2020). Impacts of Urban Growth on Bahir Dar City—Google Search, 16(8), 41–50. https://doi.org/10.3968/11831
- Alem, S. (2007). Determinants of food insecurity in rural households in Tehuludere Woreda, South Wello Zone of the Amhara Region. Addis Ababa University School of Graduate studies.
- Aliou, D., & Manfred, Z. (2001). Access to Credit and Its Impact on Welfare in Malawi. Washington, DC: International Food Policy Research Institute.
- Amsalu, M., Bekabil, F., & Beyene, T. (2012). Empirical analysis of the determinants of rural households food security in Southern Ethiopia: The case of Shashemene District. Corpus ID: 34773193. SEMANTIC SCHOLAR.
- Aragie, T., & Genanu, S. (2017). Level and Determinants of Food Security in North Wollo Zone (Amhara Region – Ethiopia). Journal of Food Security, 5(6), 232–247. https://doi.org/10.12691/jfs-5-6-4
- Asenso-okyere, K., Mekonnen, D. A., & Zerfu, E. (2013). VIP@determinants of food security in selected agro-pastoral communities of Somali and Oromia Regions, Ethiopia. Journal of Food Science and Engineering, 3, 453–471.
- Berlie, A. B. (2020). The invisible crisis of Urban food security in Amhara Regional State, Ethiopia. Journal of Hunger & Environmental Nutrition, 1–20. https://doi.org/10.1080/19320248.2020.1838983
- Beyene, F. (2016). VIP@analysis of rural household resilience. In Bulletin of the Seismological Society of America, 106(1), 6489. http://www.bssaonline.org/content/95/6/2373%5Cnhttp://www.bssaonline.org/content/95/6/2373.short%0Ahttp://www.bssaonline.org/cgi/doi/10.1785/0120110286%0Ahttp://gji.oxfordjournals.org/cgi/doi/10.1093/gji/ggv142%0Ahttp://link.springer.com/10.1007/s00024-01
- Birhane, T., Shiferaw, S., Hagos, S., & Katia Sarla, M. (2014). Urban food insecurity in the context of high food prices: A community based cross sectional study in Addis Ababa, Ethiopia. BMC Public Health, 14(1), 680. https://doi.org/10.1186/1471-2458-14-680
- Bogale, A., & Shimelis, A. (2009). Household level determinants of food insecurity in Rural Areas Of Dire Dawa, Eastern Ethiopia, 1 Feb, 2010. https://hdl.handle.net/1807/55561
- Cochrane, L. (2019). Food security in Ethiopia: review of Research, 2005-2016. Ethiopian Journal of Applied Science and Technology, 9(1), 1–10.
- Crush, J., & Frayne, B. (2010). The Invisible Crisis: Urban Food Security in Southern Africa. 1.
- Crush, J., & Riley, L. (2019). Rural Bias and Urban Food Security. November https://doi.org/10.4324/9781315191195-3
- CSA. (2017). Ethiopian Population and housing census. Ethiopia: Development Partner Group.
- CSA. (2021). Population size of towns by sex, region, zone and weredas as of July 2021. In Central Statistical Authority of Ethiopia.
- Diagne, A. (2015). Impact of access to credit on income and food security in Malawi. AGRIS, International Food Policy Research Institute.
- Efsa. (2008). Methods used to assess household food insecurity. FAO Handbook, 136, 296–302.
- Ejigayhu Sisay, A.-K. E. (2012). Determinants of food insecurity Addis Ababa City, Ethiopia. Interdisciplinary Description of Complex Systems, 10(2), 159–173.
- Ethiopian Business Review: Addis Ababa. (2022).
- FAO. (2003). Food and Agriculture Organizations of the United Nations, FAO Food and Nutrition Paper 77,. Rome, 3-6 December 2002.
- FAO. (2008). The state of food insecurity in the World-high food prices and food security – Threats and opportunities. United Nations Food and Agricultural Organization, 30(3). http://dx.doi.org/10.1016/j.jada.2009.07.007%0Ahttp://dx.doi.org/10.1016/S1499-2671(10)
- FAO. (2019). The state of food security and nutrition in the World 2019. The State of Food Security and Nutrition in the World 2019. https://doi.org/10.4060/ca5162en
- FAO, IFAD, WFP. (2014). The state of food insecurity in the world. Strengthening the enabling environment for food security and nutrition (pp.52).
- FDRE. (2002). Sustainable Development and Poverty Reduction Program. Addis Ababa, Ethiopia. IMF.
- Fekadu, B., & Mequanent, M. (2010). Determinants of food security among rural households of Central Ethiopia: An empirical analysis. Quarterly Journal of International Agriculture, 49(892–2016–65219), 299–318.
- Feleke, A., & Bogale, A. (2010a). Determinants and dimensions of household food insecurity in Dire Dawa Town, Ethiopia. East African Journal of Sciences, 3(2), 134–141. https://doi.org/10.4314/eajsci.v3i2.53655
- Feleke, A., & Bogale, A. (2010b). VIP@determinants and dimensions of household food insecurity in Dire Dawa Town, Ethiopia. East African Journal of Sciences, 3(2), 134–141.
- Foster, J., Greer, J., & Thorbecke, E. (1984). A class of decomposable poverty measures. Econometrica: Journal of the Econometric Society, 761–766.
- Gezimu Gebre, G. (2012). Determinants of food insecurity among households in Addis Ababa City, Ethiopia. Interdisciplinary Description of Complex Systems, 10(2), 159–173. https://doi.org/10.7906/indecs.10.2.9
- Hana, M. E., & Dereje, H. B. (2016). Analysis of household food insecurity and its covariates in girar jarso woreda, Oromia Regional State, Ethiopia. Journal of Economics and Sustainable Development, 7(3), 16–30.
- Hussein, W., & Janekarnkij, P. (2013). VIP@determinants of rural household food security in Jigjiga district of Ethiopia. Kasetsart Journal - Social Sciences, 34(1), 171–180.
- Idrisa, Y. L., Gwary, M. M., & Shehu, H. (2008). Analysis of food security status among farming households in Jere local government of Borno state, Nigeria, 7, 199–205.
- Ivankova, N. V., Creswell, J. W. & Stick, S. L. (2006). Sequential explanatory design: From theory to practice, 1–34. https://doi.org/10.1177/1525822X05282260
- James, L. G., & Marie, T. R. (1999). Are determinants of rural and Urban food security and nutritional status different? Some insights from Mozambique, 27(11), 1955–1975.
- Kebede. (2013). Ethiopia national food consumption survey. Ethiopian Public Health Institute, 3, 54–67.
- KHATRI-CHHETRI, A., & Lall, M. A. H. A. R. J. A. N. (2006). Food insecurity and coping strategies in Rural Areas of Nepal. K.
- Kindu, M., Angelova, D., Schneider, T., Döllerer, M., Teketay, D., & Knoke, T. (2020). Monitoring of urban growth patterns in rapidly growing Bahir Dar city of northwest Ethiopia with 30 year Landsat imagery record. ISPRS International Journal of Geo-Information, 9(9), 1–19. https://doi.org/10.3390/ijgi9090548
- Kothari, C. R. (2004). Research methodology, method and techniques (Second Revised Edition).
- Messay, M. (2009). Causes of rural household food insecurity: A case from Kuyu District, Central Ethiopia, 11(4). .
- Morse, J. M. (2000). Determining Sample Size. Qualitative Health Research, 10(1), 3–5. https://doi.org/10.1177/104973200129118183
- Motbainor, A., Worku, A., & Kumie, A. (2016). Level and determinants of food insecurity in East and West Gojjam zones of Amhara Region, Ethiopia: A community based comparative cross-sectional study. BMC Public Health, 16(1), 1–13. https://doi.org/10.1186/s12889-016-3186-7
- Nurhssen, S. (2016). The role of tourism on local economic development of Gondar City, Amhara Regional State, Ethiopia. https://doi.org/10.4172/2375-4389.1000207
- Ruel, M. (2020). Growing cities, growing food insecurity: How to protect the poor during Rapid Urbanization
- Smith, L. C., & Subandoro, A. (2007). Measuring food security using household expenditure surveys. https://doi.org/10.2499/0896297675
- Tegegne, A. D., Negewo, M. A., Desta, M. K., Nedessa, K. G., & Belaye, H. M. (2016). City Profile, Gondar. In SEs (pp. 1–29). SEMANTIC SCHOLAR. Corpus ID: 244918083.
- Tsegay, G. (2009). Determinants of food security in rural households of the Tigray Region.
- UNDP Ethiopia. (2018). Ethiopia‘s Progress towards Eradication of Poverty (2018 – 2027).
- UN. (2018). United Nations Development Report: Department of Economic and Social Affairs publication, 2018.
- WFP-Ethiopia. (2009). Food Security and Vulnerability in Selected towns of Oromia Region: Vulnerability Assessment and Mapping (VAM). Addis Ababa, Ethiopia.
- Wolderufael, M. B. (2015). Analysis of Households Vulnerability and Food Insecurity in Amhara Regional State of Ethiopia: Using Value at Risk Analysis. Ethiopian Journal of Economics, 23(2), 37–78. https://doi.org/10.22004/ag.econ.259401
- Yehuala, S., Melak, D., & Mekuria, W. (2018). The status of household food insecurity: The case of West Belesa, North Gondar, Amhara Region, Ethiopia. International Journal of Scientific Research and Management, 6(6), 06. https://doi.org/10.18535/ijsrm/v6i6.ah02