
 ?Mathematical formulae have been encoded as MathML and are displayed in this HTML version using MathJax in order to improve their display. Uncheck the box to turn MathJax off. This feature requires Javascript. Click on a formula to zoom.
Abstract
While rice farming is essential for livelihoods of smallholder farmers and the economy, there is limited evidence of specific socioeconomic determinants of paddy sale and profitability of Cambodian farmers. The study analyzes factors influencing sale and profitability of paddy production in Battambang Province using primary data collected from randomly selected 242 paddy farmers in the northwest of Cambodia. The data were analyzed using the log-linear ordinary least squares regression. The results show that paddy farming is profitable with the benefit-cost ratio of around 2.0. Besides, smallholders obtained larger profitability than medium- and large-scale farmers due to the diseconomies of scale. Fertilizer, pesticide, harvesting, and seed costs were major cost items for paddy production in the study area. Education level of household heads, household size, land are under paddy, the quantity of paddy consumed at home, the quantity of paddy retained for seed recycling, varieties of rice, and distance to markets significantly influenced paddy sale to markets, while education level of household heads, farming experience, household size, varieties of rice, selling price, cost of seed, and cost of fertilizer were found to influence the profitability of paddy production. Farm policies should aim at increasing paddy fields, expanding irrigation systems, promoting premium rice varieties, and supporting the farm gate price of paddy produce, while reducing the prices of inputs, particularly seed and fertilizer.
1. Introduction
Rice remains the most significant crop for food security, poverty reduction, and rural employment across the globe and especially in Asia (Bandumula, Citation2018). In the history of Cambodia, rice has been grown for more than 2,000 years, being the driver of food security, poverty reduction, income growth, and national export (Kea et al., Citation2016b; Kiritani, Citation1979). Rice production has increased rapidly over the last few decades from nearly zero in 2000 to about 1.45 million tonnes in 2021 (United States Department of Agriculture, Citation2021), ranked the 2nd and 5th in export to the European Union and China in 2020 (Cambodia Rice Foundation, Citation2020). This increment was due to the targeted policy to boost rice production and exports by expanding irrigation and providing various economic incentives including zero import tariff on inputs such as seeds, fertilizer, and pesticide. However, Cambodia failed to meet the 1-million-tonne goal of rice export by the end of 2015 as was set in the rice policy, where the main constraint was inadequate supply from smallholder farmers.
Literature reports productivity and profitability of paddy production in different areas of Cambodia (Bunthan et al., Citation2018; Frederic et al., Citation2017; Srean et al., Citation2018), showing that growing productivity and profitability of paddy farmers are due to the adoption of improved varieties, efficient use of fertilizer and pesticide, and improved access to land, labor, water, and credit. However, Cambodia’s paddy production remains dependent on and vulnerable to climate stresses including floods and droughts (Kea et al., Citation2016b). Floods and droughts had negative effects on paddy production at 6.5% during 2013–2015. Furthermore, De Silva et al. (Citation2014) reported that fertility of lowland rainfed soil significantly fluctuated. The insufficient availability of irrigation (less than 50% of cropland) implies susceptibility to water deficit stresses (Chun, Citation2014). Adaptive strategies to these problems include climate-smart agricultural practices such as the adoption of stress-tolerant varieties, integrated pest management, precision irrigation, and improved postharvest handling (Arunrat et al., Citation2017). The intensity of the adoption of improved practices is affected by socioeconomic and biophysical characteristics of farms, as well as institutional accessibility (Mariano et al., Citation2012).
The majority of Cambodian farmers cultivate paddy once a year during the wet season, as opposed to Thai and Vietnamese farmers producing double and triple crops a year, respectively (Japan Development Institute, Citation2010; Khut Inserey, Citation2013). Although Cambodia introduced improved varieties in the 1990s, enabling the second cropping during the dry season, farmers in practice found their gross margins as low as 32% due to the 50 % higher input costs than in the wet season (Japan Development Institute, Citation2010). Other issues include low education levels and small landholding size. Landholding of typically below two hectares (ha) (FAO, Citation2014) hampers farms’ suitability to modern technologies such as mechanized harvesting, high-yielding varieties, and complementary agronomic practices. Low education constrains farmers from obtaining skills and knowledge from extension services rendered by the government and non-governmental organizations. Ghimire and Suvedi (Citation2018) report that educated farmers tend to adopt innovations earlier than the less educated. They further point out that the adoption of certain technologies requires adequate parcel size and intensive use of resources, which may not be compatible with smallholders. Paddy farmers apply fertilizer and pesticides as major inputs while the higher cost affects their profitability. Thus, understanding the factors associated with the profitability and market sale of paddy produce will guide policy makers in determining and improving the farm policy for smallholder paddy producers.
Empirical literature provides a broad view of factors influencing the profitability of smallholder agriculture (Akter et al., Citation2019; Fakkhong & Suwanmaneepong, Citation2016; Modeste et al., Citation2018; Onoja & Herbert, Citation2012; Rugube et al., Citation2019; Xaba & Masuku, Citation2012) and paddy production (Kea et al., Citation2016a; Rido, Citation2014). However, evidence remains limited regarding the specific socioeconomic factors affecting the sale and profitability of smallholder paddy production in Cambodia.
The objective of the study is to quantitatively analyze factors associated with profitability and sale of paddy using primary data collected from smallholders in Battambang Province, northwest Cambodia. Battambang is a relatively understudied province and yet one of the most important provinces in terms of quality paddy production for both domestic and export markets. Cambodia’s premium rice has been grown in Battambang due to the high soil fertility and elevation for growing high quality fragrant rice almost around the year. Recently, Battambang wears the crown for being the “rice bowl” of Cambodia (Samnang & Chanthol, Citation2018; Srean et al., Citation2018).
2. Materials and methods
2.1. Study area
Battambang Province of northwestern Cambodia (Figure ) is recognized as the rice bowl of the country. In the 2019–2020 agricultural season, the province produced 1.18 million tonnes of paddy, ranked second after Prey Veng (1.40 million tonnes) (Chhim, Citation2021). Agricultural land accounted for 573,493 ha, of which rice-based farming systems (341,870 ha) and cash crops (228,198 ha) were the main types of cropping systems practiced in Battambang Province (Chhim, Citation2021).
Figure 1. Map of the study area.
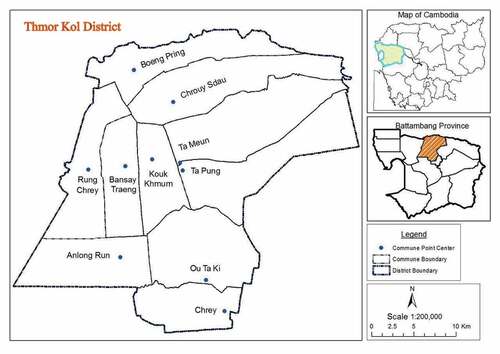
Of the 14 districts in the province, Thmor Kol district was purposively selected for the household survey because of the significant volume of paddy production, where 159,417 tonnes and 37,408 tonnes were produced in the wet and dry seasons, respectively, in the 2019–2020 agriculture year (Chhim, Citation2021). Moreover, Thmor Kol is the rice business center for Battambang Province, being the main hub connecting the northwest region with both Phnom Penh and Thailand. In addition, biophysical conditions, household economies, and agricultural systems in this district are similar to those in the other districts of the province and this district is thus suited to providing broader implications.
2.2. Data collection and sampling
The primary data were collected by a household survey with rice farmers using a semi-structured questionnaire in June and July 2016. The questionnaire consisted of both open- and closed-ended questions to collect information including, but not limited to, the areas under rice cultivation, socioeconomic characteristics of households, access to infrastructure in the area, and access to institutional support. The secondary data were collected from various sources including the Ministry of Agriculture, Forestry and, Fisheries and the Department of Agriculture, Forestry, and Fisheries of Battambang. Furthermore, data were gathered from published books, journal articles, research reports, and open-access documents to supplement the primary information.
Applying Cochran’s formula (Cochran, Citation1977), the minimum suggested sample size was obtained as follows:
where n is the minimum suggested sample size, N is the rice farmer population (households) of Thmor Kol district, Z is the Z score, P is the proportion of variability in the population (assumed to be 0.5), and e is the margin of error. Inserting the population of 17,200, 5% level of precision, and the Z score of 1.96, the minimum suggested sample size was calculated as 242.
The proportionate random sampling was applied to select farmers from 10 communes (Ta Pung, Ta Meun, Ou Ta Ki, Chrey, Anlong Run, Chrouy Sdau, Boeng Pring, Koak Khmum, Bansay Treang, and Rung Chrey) that produced the three main types of paddy (white, jasmine, and fragrant). The sampling frame is presented in Table .
Table 1. Proportionate sampling of rice farm households
2.3. Data analysis
Descriptive statistics, such as mean, median, percentage, and standard deviation, were used to describe the socioeconomic characteristics of the sampled rice farmers. Inferential statistics, such as the chi-square test and student t-test, were used to find the relationship between socioeconomic characteristics and farm size. The ordinary least squares (OLS) regression was employed to analyze the factors influencing the volume of rice sale to markets and profitability of farmers (Bosena et al., Citation2011; Dessie, Citation2018; Okal et al., Citation2017). Accordingly, the study analyzed two dependent variables: quantity of paddy sold and profitability of rice farming, whereas 20 factors (24 variables) were considered to influence the dependent variables.
For the rice sale model, the log-linear form (Jaji et al., Citation2018) of specification was adopted as follows:
where Y1 is the volume of rice (in tonne) sold by farmers to markets, b0 is the intercept term, b1, b2, …b24 are the coefficients of the independent variables X1, X2, … , X24, respectively, and is the random error term. The log-linear form was adopted because the level form of rice sale exhibited an asymmetric distribution with a long right tail, which could be normalized by the log transformation. Hence, the estimated coefficient has the following relation:
This means that when X increases by one unit, Y changes by % on average, holding all other variables unchanged. For instance, in the case of b being 1, Y doubles when X increases by one unit.
The profitability, revenue, and benefit-cost ratio were calculated as per the following formula as outlined by Ishaq et al. (Citation2003):
where is the profitability (KHR/ha), R is the revenue (KHR/ha), FC and VC are the fixed cost and variable cost of paddy production and marketing per area (KHR/ha), respectively, PP is the price of paddy (KHR/kg), QP is the quantity of paddy sold per area (kg/ha), BCR is the benefit-cost ratio. The variable cost items included land preparation cost, seed, transplanting, fertilizer and pesticide, spraying, weeding, irrigation, harvesting, transportation, and bag, while land rent and interest payment were included as fixed cost.
For the profitability model, the linear form (Geremewe, Citation2019; Lakapunrat & Thapa, Citation2017) was adopted as follows:
where Y2 is the profitability of paddy farming (in million KHR/ha), b0 is the constant term, b1, b2, …b24 are the coefficients of the independent variables X1, X2, … , X24, respectively, and is the random error term. Thus, the estimated coefficient has the following relation:
This means that when X increases by one unit, Y changes by b on average, holding other variables constant.
Table shows the independent variables included in the quantitative analysis for rice sale as the dependent variable, highlighting the expected signs of independent variables. Gender of the household head was set as a dummy variable (1 if male, 0 otherwise) and was expected to have either a positive or negative relationship with the volume of rice sold by the farm household. Boniphace et al. (Citation2014) showed that female headed households tended to sell larger quantities of rice to markets, whereas Hailu (Citation2016) obtained opposite findings on potato quantity supplied to markets. Age of the household head was expected to have either a positive or negative effect on the volume of rice sold by the farm household. Moono (Citation2015) reported that age of the household head had a negative and significant effect on market participation of rice farmers in Zambia. On the other hand, Khanal and Maharjan (Citation2014) showed positive impacts of age on the volume of rice seeds sold to markets in rural Nepal.
Table 2. Description of the independent variables in quantitative analysis for volume of rice sale
Education of the household head was an ordinal variable (primary school, secondary school, and high school) and was included as a set of dummy variables. More educated farmers were expected to have a higher ability to adopt better technologies and, therefore, supply more produce to markets (Ayalew, Citation2015). Endris et al. (Citation2020) found that experience in farming had a positive and significant effect on volume marketed. Household size was treated as a numerical variable, which was predicted to have either a positive or a negative effect on volume marketed. Kassa et al. (Citation2017) found the positive association between household size and quantity of banana supplied in the market in Southwest Ethiopia. On the other hand, Kyaw et al. (Citation2018) found that household size had a negative influence on the volume of rice sold in the market in Myanmar. If the household size is equal, then having more family members participating in rice farming is expected to increase rice production and sale to markets (Lefebo et al., Citation2016). Gani and Hossain (Citation2015) revealed that farm size positively influenced households’ participation in output markets. Access to irrigation facilities showed a significant positive influence on the volume of rice seed sale to markets (Khanal & Maharjan, Citation2014). Varieties of rice (jasmine rice, fragrant rice, and white rice) were included as dummy variables. As farmers grew more than one variety concurrently, the three varieties were not necessarily mutually exclusive. Thus, three dummies each representing one of these varieties were included. Adoption of any of these verities was expected to have higher marketable surplus compared with non-adoption of the same variety (Eliste & Zorya, Citation2015). Furthermore, use of farm inputs, such as seed and fertilizer, increased crop productivity (Bolakhe et al., Citation2022; Rehman et al., Citation2019). Therefore, it is anticipated that both seed and fertilizer inputs would have a positive relation with paddy sales volume.
Household rice consumption and seed recycling were included as control variables expected to have negative effects on sale to markets. Balirwa and Waholi (Citation2019) reported from Uganda that milk farmers’ household consumption was negatively related with surplus for sale. Tolno et al. (Citation2016) found negative associations between seed recycling and product availability for markets. Workye et al. (Citation2019) found positive effects of output prices on the quantity of rice sold to markets in Southwest Ethiopia. Kyaw et al. (Citation2018) found positive effects of road condition as a dummy variable (1 if good, 0 otherwise) and negative effects of distance to the market on the volume of rice sale. Nabay et al. (Citation2020) found negative effects of transportation cost (KHR/km) on sale to markets. Kyaw et al. (Citation2018) argued that access to market information helped increase farmers’ knowledge of practices and markets, leading to higher productivity and marketable surplus. Likewise, farmers who participated in extension programs related to rice production and marketing had better understanding of new technologies, such as high-yielding varieties and other improved farming practices (Siziba et al., Citation2011). Access to credit had a positive influence on rice sale according to Anthony et al. (Citation2021).
Table lists the independent variables included in the quantitative analysis for rice profitability as the dependent variable, with the anticipated signs of independent variables. Gender of the household head (1 if a man and 0 otherwise) was expected to have either a positive or a negative relationship with the profitability of rice production. In Ladkrabang, Thailand, male farmers had higher profitability in rice production than female farmers (Fakkhong & Suwanmaneepong, Citation2016). On the other side, female farmers had better profit than male farmers in vegetable production in different regions (Kebede et al., Citation2017; Shrestha et al., Citation2022). The profitability of rice production was predicted to be positively or negatively affected by the age of the household head, which was treated as a continuous variable. Rice farming profits in Nigeria were positively linked with farmer age, according to Onoja & Herbert (Citation2012). Conversely, negative effects of age on profitability were found among farmers in the Caribbean (Patterson-Andrews & Pemberton, Citation2014).
Table 3. Description of the dependent and independent variables in quantitative analysis for profitability of rice farming
Modeste et al. (Citation2018) showed that farmers with higher levels of education were more likely to adopt innovative farming techniques and proper postharvest management, leading to higher profitability. Moreover, they mentioned that the experience of farmers had positive effects on the profitability of farmers. The size of the household was specified as a numerical variable, which was anticipated to have either a positive or a negative impact on the profitability of rice production. Centes et al. (Citation2017) revealed that the larger the household, the less profitable farmers were. On the other hand, in Shiselweni region of Eswatini, vegetable production profitability was positively correlated with household size (Rugube et al., Citation2019). Patterson-Andrews and Pemberton (Citation2014) found a positive effect of household labor on farm profitability. Rice production profitability was hypothesized to be positively correlated with the amount of cultivated land. The more cultivated land, the more total production, and hence the higher profitability (Mwatawala et al., Citation2019). Srean et al. (Citation2018) emphasized the importance of water access for rice profitability in northwest Cambodia.
Varieties of rice were represented by the set of dummy variables (1 if the variety was grown, 0 otherwise) for each of jasmine rice, fragrant rice, and white rice. Kebede et al. (Citation2017) revealed that crop varieties grown by farmers affected profitability. Bunthan et al. (Citation2018) found positive impacts of both jasmine and fragrant rice on profitability of rice in Battambang province, Cambodia. According to Okam et al. (Citation2016), while amounts of seed and fertilizer significantly contributed to rice production, the high costs of these inputs negatively affected the profitability. Thus, both seed cost and fertilizer cost were expected to have a negative influence on the profitability. Due to substitution in use, the higher quantity retained for household use, the less quantity provided to the market, and the lower the profitability (Tolno et al., Citation2016). Farmers usually stored their harvest for future seeds in traditional ways, which led to lower yields and less profit. According to Srean et al. (Citation2018), large seed quality affected rice farming profitability. Rice production profitability was expected to be negatively impacted by both household consumption and the retention of seeds. Tumukunde et al. (Citation2020) revealed that the selling price had a positive influence on rice farming profitability, while transportation costs had a negative impact. The profitability of potatoes was shown to be significantly enhanced by increased access to market information (Mwatawala et al., Citation2019). Farmers would benefit from better road conditions and a shorter journey to markets, which would lower transportation costs and boost farm profitability (Mdoda & Obi, Citation2019; Shrestha et al., Citation2022). Shrestha et al. (Citation2022) also stressed the relevance of access to extension and credit in improving the profitability of vegetable production.
The Variance Inflation Factor (VIF) can be used to examine the potential multicollinearity across the independent variables. Although different researchers apply different thresholds such as 3, 5, and 10, as a rule of thumb, a VIF exceeding 5 indicates a high degree of correlation arising from the inclusion of that independent variable. Table shows that the VIF was below 5 for all the independent variables included in our analysis, indicating no serious multicollinearity problem.
Table 4. Variance inflation factor (VIF) for the set of covariates included in both of the regression analyses
3. Results
3.1. Profile of the farmers
According to the Royal Government of Cambodia, rice farmers are classified into three groups based on landholding size: small-scale farmers (own farmland of less than 2.0 ha), medium-scale farmers (2.0 to less than 5.0 ha), and large-scale farmers (5.0 ha or larger). From the interviews with the 242 farmers, it was found that 40% of the respondents were small farmers, 33% were medium farmers, and 27% were large farmers (Figure ). Moreover, the average farm size was 0.93, 2.89, and 9.39 ha per household of the small, medium, and large farmers, respectively (Table ), where the difference was significant (p = 0.000).
Figure 2. Distribution of farmers by landholding size in the study area.
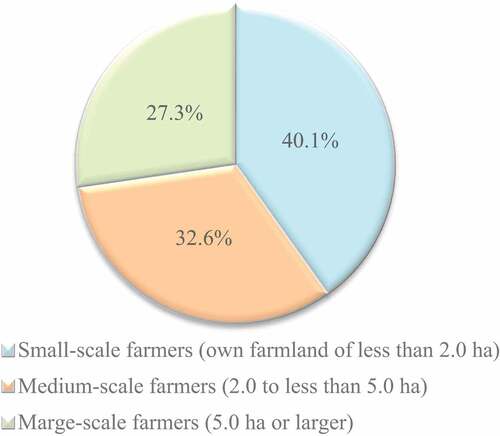
Table 5. Distribution of landholding size in the study area
Table highlights the socioeconomic profile of the sampled rice farmers. More than 70% of the small- and medium-scale farmer respondents were male and nearly 60% of the male were in the group of large-scale farmers. The chi-square test indicates that there were differences in gender composition across the three farm size segments (p = 0.076). For age categories, approximately 30% of the small-scale farmers were 41–50 years old, while less than 10% were under 30. As for medium-scale farmers, the largest proportion (25%) of them were in the age group 51–60 years and over 20% of them were above 60 years. Nearly 18% of the medium-scale farmers were under 30 years old, and the same proportion was found in each of the 30–40 year-old and 41–50 year-old segments as well. Moreover, a larger proportion of the large-scale farmers (27%) were in the age group 30–40 years old, followed by 41–50 (24 %), and about 21% of them were in the age group 51–60. A smaller proportion (9%) of them were under 30, and the same proportion were above 60. Nonetheless, the chi-square test indicates no significant difference in age across the three farm size segments (p = 0.176).
Table 6. Profile of the sampled rice farmers: distribution of socioeconomic variables by landholding category
Regarding the education level of the small farmers, about a half of them had attended primary school, more than 20% were from secondary school and illiterate, and less than 5% had completed high school. For the medium farmers, about a half were from primary school and less than one third were illiterate. More than a half of the large farmers had finished Grade 6, about 20% were from secondary school, and 15% had never attended school. The chi-square test indicates no significant difference in the education level across the three farm size segments (p = 0.523). The largest proportion of the small and medium farmers had 3–4 household members, followed by households with 5–6 members. About 5% of the small farmers and 10% of the medium farmers had more than six members in their family. For the large farmers, however, about 25% had more than six persons per household. The chi-square test indicates a significant difference in household size across the three farm size segments (p = 0.000). Regarding household labor, the small farmers had more family labor than the medium and large farmers (p = 0.002). The experience in rice farming is represented by the number of years of rice cultivation. In the study area, more than a half of the small farmers had over 30 years of experience in rice farming, which was not the case with the medium and large farmers (p = 0.002).
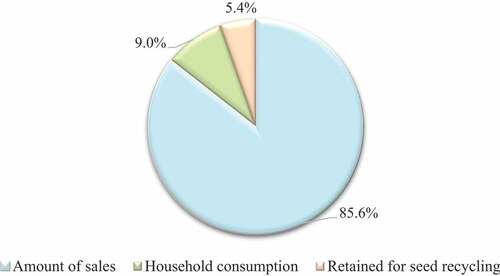
In general, farmers divide their rice harvest into three use patterns, namely retention as seeds, household consumption, and sale for income (Serey & Lee, Citation2018). Approximately 85% of the total production was sold by farmers. Less than 10% of the production was kept for household consumption and about 5% was retained for seed recycling (Figure ).
Figure 3. Proportion of different uses of rice harvest in the study area.
The average production by the small, medium, and large farmers was 5.7, 10.7, and 27.1 tonnes per farm, respectively, where the difference was significant (p = 0.000) (Table ). The average volume of rice sale of the small, medium, and large farmers was 4.6, 9.0, and 24.0 tonnes, respectively (p = 0.000). The average household consumption by the small, medium, and large farmers was 0.9, 1.2, and 1.7 tonnes per annum, respectively (p = 0.000). The average quantity of rice retained for seed recycling of the small, medium, and large farmers was 0.3, 0.6, and 1.5 tonnes per farm, respectively (p = 0.000).
Table 7. Quantity of production, sale, household consumption, and seed recycling (tonne)
The average yield of the small, medium, and large farmers was 3.8, 3.5, and 3.2 tonnes/ha, respectively, where the difference was significant (p = 0.000) (Table ).
Table 8. Yield (tonne/ha) of three groups of rice farmers
Approximately 70%, 36%, and 42% of the small, medium, and large farmers, respectively, had access to irrigation for their rice fields, where the difference among the three groups was statistically significant (p = 0.000) (Table ). Around 80% of all farmers had access to roads with good conditions, with no difference among the three groups (p = 0.847). Many farmers had access to market information, with no difference across the three groups. About 20%, 14%, and 11% of the small-, medium-, and large-scale farmers had access to extension services, respectively. Yet, the difference was not statistically significant (p = 0.341). The majority of farmers had access to credit, with no significant difference among the groups (p = 0.513). It was found that most (80%) of the small farmers produced jasmine rice, while it was less popular among the medium (56%) and large (41%) farmers. Among the large farmers, white rice was the most popular varieties (49%).
Table 9. Access to irrigation facilities, road condition, access to market, access to extension service, and access to credit
The average rice price for the small, medium, and large farmers was 997,000, 940,000, and 966,000 KHR/tonne, respectively, with a significant difference among the three groups of farmers (p = 0.022) (Table ). The average revenue per ha for the small, medium, and large farmers was 3,829,000, 3,294,000, and 3,092,000 KHR/ha, respectively, with a significant difference among the three groups (p = 0.000).
Table 10. Price and revenue of rice of three group farmers
Small farmers appeared to spend more on seed cost per area (251,000 KHR/ha) compared with medium farmers (213,000 KHR/ha) and large farmers (214,000 KHR/ha), but the difference was not statistically significant (p = 0.112) (Table ). Likewise, fertilizer cost per area (494,000 to 532,000 KHR/ha on average) was not statistically different across the three groups of farmers.
Table 11. Seed and fertilizer costs per area for three size groups of rice farmers
The average transportation cost per tonne for the small, medium, and large farmers was about 41,000, 33,000, and 31,000 KHR, respectively, where the difference was statistically significant (p = 0.020) (Table ). The average distance to markets was 6.0, 3.6, and 2.7 km for the small, medium, and large farmers, respectively, where the difference was significant (p = 0.000).
Table 12. Transportation cost and distance to market of three groups of rice farmers
The average profitability per area for the small, medium, and large farmers was 2,104,000, 1,710,000, and 1,312,000 KHR/ha, respectively, with a significant difference (p = 0.000) across the three farm size segments (Table ). The result is consistent with the well-known inverse relation between farm profitability and farm size in developing countries (Otsuka et al., Citation2016; Salaisook et al., Citation2020). Moreover, the average profitability was 539, 480, and 396 KHR/kg for the small, medium, and large farmers, respectively, with a significant difference (p = 0.000).
Table 13. Profitability of rice production for three size groups of farmers
Table shows the average variable and fixed costs per area, revenue per area, profitability, and the benefit-cost ratio of paddy production among farmers in the study area. The cost per area was 1.7 million KHR/ha on overall average, whereas it was 1.8 million KHR/ha for large-scale farmers, followed by 1.7 million KHR/ha for small-scale farmers and 1.6 million KHR/ha for medium-scale farmers. On the other hand, revenue per area was 3.4 million KHR/ha on average, whereas the highest average revenue per area was found among small-scale farmers (3.8 million KHR/ha), followed by medium-scale farmers (3.3 million KHR/ha) and large-scale farmers (3.1 million KHR/ha). The profitability was 1.8 million KHR/ha on overall average, whereas it was highest for small-scale farmers (2.1 million KHR/ha), followed by medium-scale (1.7 million KHR/ha) and large-scale farmers (1.3 million KHR/ha).
Table 14. Average cost and profit of paddy production per ha in Battambang Province
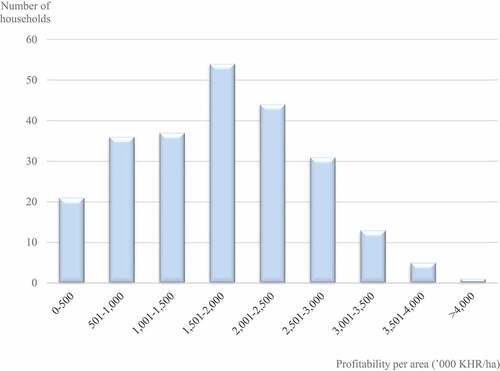
The frequency distribution of rice sale was significantly skewed to the right (Figure ). If this variable was included in regression analysis as the dependent variable, the estimated standard errors would be biased (Jaji et al., Citation2018). By taking the logarithm, the variable was distributed nearly normally (Figure ). Therefore, the log-transformed quantity of rice sale was used as the dependent variable. In contrast, the frequency distribution of rice profitability was nearly normal (Figure ), and thus the variable was included in regressions without log-transformation. On the other hand, the Breusch Pagan test indicated the presence of heteroscedasticity and thus, the robust standard errors were applied to correct it.
Figure 4. Frequency distribution of paddy sale.
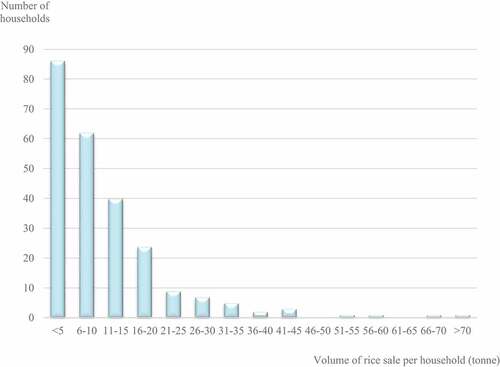
Figure 5. Frequency distribution of natural logarithm of paddy sale.
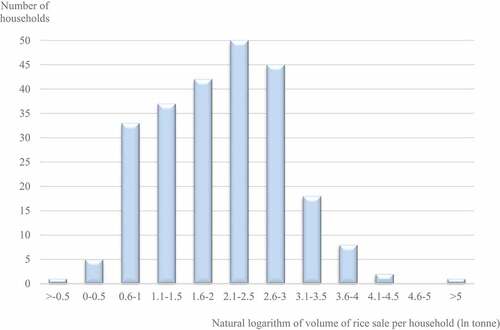
Figure 6. Frequency distribution of profitability of paddy production.
3.2. Factors influencing the volume of rice sale
Out of the 20 independent factors, seven were found to significantly influence rice sale, namely education, household size, land size, rice variety, household consumption of own rice produce, seed recycling, and distance to the nearest market (Table ). Those who had graduated from high school had 30% larger volume of rice sale on average compared with those who had not finished primary school, holding the covariates unchanged. Household size had a positive effect on rice sale. As household size increased by one member, the volume of rice sale increased by 4% on average.
Table 15. Log-linear ordinary least squares regression for volume of rice sale
As area planted to paddy increased by one ha, paddy sale increased by 8% on average, holding the other variables constant. Farmers growing fragrant rice (mainly Sen Kra Ob variety) had 29% higher paddy sale on average than those not growing fragrant rice. A one-tonne increase in household annual consumption from own harvest led to an increase in paddy sale by 7% on average. For a one-tonne increase in quantity of paddy retained as seed for the next season, paddy sale increased by 18%. Distance to the nearest market was negatively associated with the volume of paddy sale. A decrease in distance by one km led to an increase in paddy sale by 10%.
3.3. Factors influencing the profitability of rice farming
Out of the 20 independent factors, seven were found to significantly influence rice profitability per ha of land, namely education, farming experience, household size, rice variety, seed cost, fertilizer cost, and selling price (Table ). Education level (primary and secondary school) of the household head had a positive influence on the profitability. Those who had completed primary and secondary school had their profitability higher by 213,000 KHR/ha and 252,000 KHR/ha, respectively, than those who had not completed primary school. An increase in experience in paddy production by one year led to an increase in profitability by 13,000 KHR/ha. In contrast to the case of paddy sale, household size negatively influenced profitability. As the household size increased by one member, rice profitability decreased by 42,000 KHR/ha. Both of the improved varieties showed positive influences on the profitability. Those who cultivated jasmine rice had their profitability higher by 320,000 KHR/ha than those who did not cultivate it. Similarly, those who produced fragrant rice had their profitability higher by 717,000 KHR/ha than those who did not.
Table 16. Ordinary least squares regression for profitability of rice farming
The profitability of rice farming decreased by 1,228,000 KHR/ha when fertilizer cost increased by 1,000,000 KHR/ha. Likewise, an increase in seed cost by 1,000,000 KHR/ha reduced their profitability by 940,000 KHR/ha. The coefficient of farm gate price was positive and significant. An increase in farm gate price by 1,000,000 KHR/tonne led to an increase in profitability by 1,266,000 KHR/ha.
4. Discussions
The result shows that fragrant rice was higher-yielding and jasmine rice fetched price premia. Due to its higher yield and superior quality, fragrant rice is produced for export purposes. While this variety has a short shelf life (3 months) and is primarily grown in the dry season (irrigated), it requires a greater amount of water, fertilizer, and labor (Kea et al., Citation2016b). On the other hand, jasmine rice is grown during the wet season and has a longer shelf life (6 months) but less than white rice (8 months). Zorya et al. (Citation2016) reported that Cambodian farmers mainly produced white rice, while they increasingly adopted jasmine and fragrant rice due to higher prices for export markets. Jasmine and fragrant rice is primarily grown in Battambang Province, accounting for 10% and 30% of the area planted and total production, respectively (Eliste & Zorya, Citation2015).
It must be noted that the majority of large- and medium-scale farmers produced local varieties (white rice) while small-scale farmers tended to produce improved varieties (jasmine and fragrant rice). There are a few possible reasons for this observation. First, large-scale fields tend to be located in rainfed lowland where floods occur in the wet season. Nesbitt (Citation1997) and Nguyen et al. (Citation2011) suggest that local varieties are more resistant to deep water than premium varieties: Traditional rice varieties have the elongation ability and thus can tolerate standing water deeper than 40 cm, while jasmine rice and other improved varieties typically tolerate standing water of 40 cm or below. Another reason is the general popularity of white rice among consumers. Notwithstanding the rising export demand for jasmine and fragrant rice, white rice remains crucial in serving domestic consumers who are familiar with the taste and texture of traditional varieties.
The result highlights that most large-scale farmers in this study did not have access to irrigation. This is because large-scale farms were mainly located in rainfed lowland. Khmer Rumdol Meas (Citation2017) report that farmers would shift from a single-crop local rice variety to double-crop premium varieties if they had better access to irrigation in the wet season.
All farmers were involved in selling paddy in considerable amounts after retaining some for seed recycling and household consumption. This helps them repay the loan for pesticides and fertilizer upon harvesting. Khmer Rumdol Meas (Citation2017) report that farmers retained 12% and 6% of harvest for household consumption and seed recycling, respectively, and sold the rest due to credit repayment and lack of storage. On average, farmers allocated paddy harvest for 4-month consumption and bought milled rice at lower quality and price for consumption in the rest of the year. Large-scale farmers tended to retain larger quantities of seeds in preparation for climate shocks (drought/flood) and insect attacks. They claimed that they would use double seed if the rainy season was delayed or the field was flooded after planting.
The study further found that seeds, fertilizer, pesticides, and harvesting were the major cost items for paddy production in the study area. Srean et al. (Citation2018) also found in the same area that fertilizer and pesticides together constituted the largest proportion of the cost of paddy production. However, farmers in the study area spent less on fertilizer and pesticides compared with farmers in Svey Rieng Province (Serey & Lee, Citation2018) where the combined cost for fertilizer and pesticides was 896,000 KHR per ha and 728,000 KHR per ha in wet and dry seasons, respectively. Moreover, with limited family labor availability, farmers often hired harvesting machines for cutting and threshing their paddy. In the study area, it was found that most of the farmers practiced the direct seeding method, which requires more seed than the transplanting method. Khmer Rumdol Meas (Citation2017) reported that farmers shifted from the transplanting method to the direct seeding method due to the lower cost of hand broadcasting. Nonetheless, the direct seeding method requires a higher seed rate (e.g. 150–200 kg/ha), causes unbalanced plant densities, and attracts more weed.
Literature (Bunthan et al., Citation2018; Chhun et al., Citation2020; Iwahashi et al., Citation2021) documents that paddy yield varies depending on the cultivar, fertilizer inputs, location, and availability of water. Yu and Fan (Citation2011) indicate that a 1% increase in fertilizer use raises paddy yields by 0.1% and 0.2% in wet season and dry season, respectively. Our study showed that yield for white, jasmine, and fragrant rice was 3.13 tonnes/ha, 3.50 tonnes/ha, and 3.87 tonnes/ha on average, respectively. Bunthan (Citation2018) also found a higher yield in jasmine and fragrant rice compared with white rice. Overall, the average yield that farmers produced white rice was smaller than jasmine and fragrant rice.
Large-scale farmers spent slightly more on fertilizer and pesticides, though not so different from small-scale farmers. On the other hand, small-scale farmers applied a higher seed rate than large-scale farmers. Consequently, small-scale farmers obtained a higher yield on average. In general, in developing countries, smallholders tend to have higher yields than large holders because family labor is more productive than hired labor due to the incentive compatibility (Akter et al., Citation2019; Otsuka et al., Citation2016). Castilla et al. (Citation2020) and Okam et al. (Citation2016) found that fertilizer application did not affect yield significantly (Castilla et al., Citation2020; Okam et al., Citation2016). In other words, the intensification to increase agricultural yields may be achieved by efficient use of appropriate inputs. Besides, it was found that the price of jasmine and fragrant seeds was higher than that for white rice, resulting in small-scale farmers spending more on seed.
The study revealed that farmers who had completed high school education tended to sell larger volume of rice to markets than those who had not completed primary education. Ahmed (Citation2020) and Dibaba and Goshu (Citation2018) report that highly educated farmers have capacity to adopt improved practices. Moreover, those who had completed secondary education tended to enjoy higher profitability. Adnan et al. (Citation2021), Modeste et al. (Citation2018), and Mwatawala et al. (Citation2019) show that farm profitability can increase remarkably by enhancing the education level of farmers.
In our study, longer experience with paddy farming led to higher profitability of paddy production. Farming experience represents skills and knowledge of agronomic practices and market linkage accumulated over the years of agricultural production. Ouattara et al. (Citation2022) emphasize that skills and knowledge of the nursery, transplanting, and irrigation management were key to enhancing paddy yield, in their study in Côte d’Ivoire. Srean et al. (Citation2018) found in Battambang Province, Cambodia that experienced farmers encountered fewer challenges in paddy production. Modeste et al. (Citation2018) revealed that experienced farmers had better access to inputs for growing modern varieties of soybean, compared with those less experienced. In Tanzania, Mwatawala et al. (Citation2019) found that experiences with production and marketing resulted in greater profits of farms. Similar findings have been reported in other developing countries as well (e.g., Okam et al., Citation2016; Salaisook et al., Citation2020).
The results highlighted contrasting effects of household size, i.e., positive on sale and negative on profitability. Larger households were likely to produce larger quantities of paddy to feed the members and earn from sale (Ahmed, Citation2020; Gani & Hossain, Citation2015). Paddy area size has a positive effect on sale due to greater marketable surplus (Anthony et al., Citation2021; Donkor et al., Citation2021). Geremewe et al. (Citation2019) indicate that area planted to potato had positive effects on the quantity of harvest and supply to markets. On the other hand, larger households were more likely to have larger expenses in order to support family expenditure and were less inclined to wait for the output price to rise as they have to earn quickly (Centes et al., Citation2017). In contrast, Rugube et al. (Citation2019) reported positive association between household size and paddy profitability. On the other hand, in the profitability regression, the coefficient of production scale was negative with the p-value being 0.112. Albeit very weak significance, a negative effect on profitability would be consistent with the inverse relation theory in developing counties (Akter et al., Citation2019). It can be more difficult to adequately manage large farms than small farms, especially the monitoring of hired labor (Otsuka et al., Citation2016). In this case, poor management and increased input costs on large farms may be the cause of the low profit margins among larger farmers (Dang, Citation2017; Teshome et al., Citation2021). However, Mwatawala et al. (Citation2019) and Rugube et al. (Citation2019) revealed opposite findings.
As the covariates including land size were controlled in the model specification, the results on the rice varieties basically implied that fragrant rice was higher-yielding and jasmine rice fetched price premia. Bunthan et al. (Citation2018) found that producers of jasmine and fragrant rice had a higher profit margin than producers of white rice. Srean et al. (Citation2018) showed that the adoption of improved rice varieties resulted in greater quantities of sale and profitability in general compared with exclusive production of traditional varieties. Our results concur with Fakkhong and Suwanmaneepong (Citation2016). The negative effects of costs of farm inputs (seed and fertilizer) on profitability were expected, given that the production scale was controlled in the model. Moreover, the larger magnitude of the fertilizer coefficient than that of the seed coefficient suggests room for improvement in allocative efficiency by shifting the expense from fertilizer to seed. The majority of farmers tend to apply excessive amounts of synthetic fertilizer, adversely affecting the profitability (Srean et al., Citation2018). As expected, output price had positive effects on profitability, which is in line with various literature, such as Khounthikoumane et al. (Citation2021) and Tumukunde et al. (Citation2020) arguing that a higher price would incentivize farmers to increase their production of the crop relative to other crops. Household consumption had positive effects on sale, which contrasts with our expectation. Literature evidence is mixed. Our finding is consistent with Boniphace et al. (Citation2014) and inconsistent with Balirwa and Waholi (Citation2019). The latter found that an increase in milk consumption by dairy farm households led to a reduction in volume of milk sold. Likewise, seed retention had positive effects on sale. Diepart (Citation2010) alluded to negative effects of seed retention on sale due to the decline in the yield performance through seed recycling, resulting in reduced supply to markets. One possible explanation for our results on consumption and retention is that households with larger demand for consumption and retention may attempt to produce sufficient volume of paddy through intensification and tend to end up with larger surplus.
Distance to market had negative effects on paddy sale, suggesting that larger paddy farms tended to locate around marketplaces. As distance to the market is an indication of travel time and total transport cost, farms closer to markets are more suitable to commercial agriculture in general (Jagwe et al., Citation2010; Martey et al., Citation2012). Ayalew (Citation2015) and Goshme et al. (Citation2018) argue that distance to the market negatively affects sale volume of fruit and sesame, respectively.
5. Conclusion
Smallholder paddy farmers in rural Cambodia face difficulties accessing output markets and achieving decent profits. The study analyzed the factors influencing the volume of paddy sale to markets and the profitability of paddy production in Battambang Province, northwest of Cambodia using primary data collected from 242 farmers and log-linear regression analysis. Small-scale farmers gained higher profitability than large- and medium-scale farmers, due to the preferred variety, seed rate, and the output price. The empirical results showed that higher education of the household head significantly raised paddy sale and profitability, where sale was more associated with high school level education while profitability was linked to primary and secondary level education. Larger area sown to paddy contributed to higher volume of sale. While household size affected rice sale significantly, household labor availability did not. Households with larger quantities of consumption of own harvest and seed recycling sold paddy to markets in greater quantities. Distance to the nearest marketplace negatively affected output sale. The improved rice varieties, namely jasmine and fragrant, showed positive effects on paddy sale and profitability. Household heads with longer years of paddy farming tended to have larger quantities of paddy sale. Higher prices of paddy contributed to higher profitability, while higher seed costs and fertilizer costs lowered the profitability.
The findings suggest that the government prioritize promotion of formal education for those in rural area. Another implication is the need to expand arable land and irrigation systems to secure water inputs in both the wet and dry seasons. Furthermore, farmers should be informed and encouraged to produce more of fragrant and jasmine rice to enhance profitability of paddy production. To reduce input costs, the government should implement policies to support market transactions for trading farm inputs for agricultural production, such as seed and fertilizer. Provision of direct and indirect subsidies and tax and non-tax incentives may be another option as long as it will not excessively distort the markets. Additionally, price support for paddy sold by smallholders would help increase profitability, thereby contributing to poverty reduction. Lastly, the result weakly suggests the inverse relation between farm size and profitability, which is common in low-income communities around the world. Authorities are expected to promote small-scale operation of paddy production rather than consolidation of farmland into large-scale estates until the wage level becomes sufficiently high.
The study faces several limitations. First, the data used in this study were collected in 2016, collection of updated data would help understand how the situation has evolved in the last several years. Second, this study focused on one district. It is desirable to expand the geographical scope to cover other districts, as well as to compare rice marketing across districts to draw cross learnings. Lastly, the study looked at how sales volume and profitability were affected by various factors. Future research should investigate farmers’ choice of marketing channels since each channel has a unique set of pros and cons.
Acknowledgments
The authors acknowledge the Asian Institute of Technology (AIT), Thailand and the Royal University of Agriculture, Cambodia for providing financial assistance in the form of a scholarship granted to the first author for her Ph.D. study.
Disclosure statement
No potential conflict of interest was reported by the author(s).
Additional information
Funding
References
- Adnan, K. M., Sarker, S. A., Tama, R. A. Z., & Pooja, P. (2021). Profit efficiency and influencing factors for the inefficiency of maize production in Bangladesh. Journal of Agriculture and Food Research, 5, 100161.
- Ahmed, M. A. (2020). Profitability and socio-economic analysis: Evidence from rice production in Lake Geriyo of Adamawa State, Nigeria. FUW Trends in Science & Technology Journal, 5(2), 360–31.
- Akter, T., Parvin, M. T., Mila, F. A., & Nahar, A. (2019). Factors determining the profitability of rice farming in Bangladesh. Journal of the Bangladesh Agricultural University, 17(1), 86–91. https://doi.org/10.3329/jbau.v17i1.40668
- Anthony, L., Alabi, O. O., Ebukiba, E. S., & Gamba, V. (2021). Factors influencing output of rice produced and choice of marketing outlets among smallholder farming households, Abuja, Nigeria. Sarhad Journal of Agriculture, 37(1), 262–277. https://doi.org/10.17582/journal.sja/2021/37.1.262.277
- Arunrat, N., Wang, C., Pumijumnong, N., Sereenonchai, S., & Cai, W. (2017). Farmers’ intention and decision to adapt to climate change: A case study in the Yom and Nan basins, Phichit Province of Thailand. Journal of Cleaner Production, 143, 672–685. https://doi.org/10.1016/j.jclepro.2016.12.058
- Ayalew, Y. (2015). Factors affecting fruit supply in the market: The case of Habru. European Journal of Business and Management, 7(4), 309–319.
- Balirwa, E. K., & Waholi, E. (2019). Analysis of market participation behavior among smallholder dairy farmers in Uganda. The Journal of Agricultural Science, 11(3), 109. https://doi.org/10.5539/jas.v11n3p109
- Bandumula, N. (2018). Rice production in Asia: Key to global food security. Proceedings of the National Academy of Sciences India Section B - Biological Sciences, 88(4), 1323–1328. https://doi.org/10.1007/s40011-017-0867-7
- Bolakhe, K., Dhakal, K. H., & Dahal, R. (2022). Economic analysis of potato basic seed production under contract farming in Kavrepalanchok, Nepal. International Journal of Agricultural Economics, 7(1), 4–10. https://doi.org/10.11648/j.ijae.20220701.12
- Boniphace, N. S., Fengying, N., & Chen, F. (2014). An analysis of factors affecting smallholder rice farmers’ level of sales and market participation in Tanzania: Evidence from national panel survey data 2010–2011. Journal of Economics and Sustainable Development, 5(23), 185–205.
- Bosena, D. T., Bekabil, F., Berhanu, G., & Dirk, H. (2011). Factors affecting cotton supply at the farm level in Metema District of Ethiopia. Journal of Agriculture, Biotechnology & Ecology, 4(1), 40–51.
- Bunthan, S., Takahashi, Y., & Izumid, Y. (2018). A Study on Cambodian rice farming: Comparative analysis on aromatic and non-aromatic rice farming in Voatkor Commune, Battambang Province. International Journal of Environmental and Rural Development, 9(1), 71–76.
- Cambodia Rice Foundation. (2020). Cambodia’s rice export summary report. http://www.crf.org.kh/imgs/Summary%20report%20rice%20export%20August%202020.pdf
- Castilla, N. P., Stuart, A. M., Makara, O., Sathya, K., Somany, S., Kumar, V., & Hadi, B. A. R. (2020). Characterization of cropping practices, pest constraints, and yield variation in irrigated lowland rice of Cambodia. Crop Protection, 135, 104906.
- Centes, A., Ruales, J., Soria, R. J., & Seriño, M. N. (2017). Factors affecting profitability of small-scale vegetable production in the Visayas. Annals of Tropical Research, 39, 194–207. https://doi.org/10.32945/atr39sb16.2017
- Chhim, V. (2021). Annual agricultural report of Battabang province 2021 and work plan 2022. Department of Agriculture, Forestry, and Fisheries of Battambang Province.
- Chhun, S., Kumar, V., Martin, R. J., Srean, P., & Hadi, B. A. (2020). Weed management practices of smallholder rice farmers in Northwest Cambodia. Crop Protection, 135, 104793.
- Chun, N. (2014). Improving rice production and commercialization in Cambodia: Findings from the farm investment climate assessment. Asian Development Bank. http://hdl.handle.net/11540/4083.
- Cochran, W. F. (1977). The estimation of sample size. Sampling Techniques, 3, 72–90. https://scholar.google.com.tr/scholar?q=sampling+techniques&btnG=&hl=en&as_sdt=0,5#0
- Dang, N. H. (2017). Profitability and profit efficiency of rice farming in Tra Vinh Province, Vietnam. Review of Integrative Business and Economics Research, 6(1), 191–201.
- De Silva, S., Johnston, R., & Sellamuttu, S. S. (2014). Agriculture, irrigation and poverty reduction in Cambodia: Policy narratives and ground realities compared. CGIAR Research Program on Aquatic Agricultural Systems. Working Paper: AAS-2014-13.
- Dessie, M. (2018). Value chain analysis of red pepper: The case of Mareko District, Guragie Zone, Southern Ethiopia. Agricultural Research & Technology: Open Access Journal, 17(2), 31–39. https://doi.org/10.19080/artoaj.2018.17.556015
- Dibaba, R., & Goshu, D. (2018). Factors affecting market supply of wheat by smallholder farmers in Ethiopia. J. Nat. Sci. Res, 19(8), 56–64.
- Diepart, J. C. (2010). Cambodian peasant’s contribution to rural development: A perspective from Kampong Thom province. Biotechnologie, Agronomie, Société et Environnement, 14(2), 321–340.
- Donkor, E. A., Garnevska, E., Siddique, M. I., & Donkor, E. (2021). Determinants of rice farmer participation in the direct marketing channel in Ghana. Sustainability (Switzerland), 13(9), 5047. https://doi.org/10.3390/su13095047
- Eliste, P., & Zorya, S. (2015). Cambodian agriculture in transition: Opportunities and risks. Economic and Sector Work, Report No. 96308-KH.
- Endris, E., Haji, J., & Tegegne, B. (2020). Determinants of vegetables market supply in case of Habru district, North Wollo Zone, Ethiopia. International Journal of Sciences & Applied Research, 7(4), 1–12. https://doi.org/10.11648/j.ebm.20200601.11
- Fakkhong, S., & Suwanmaneepong, S. (2016). Determinants of profitability of rice farming in Peri-Urban Area, Evidence from Ladkrabang District, Bangkok, Thailand. The Asian Conference on the Social Sciences. The International Academic Forum, June 9-12. Kobe, Japan.
- FAO. (2014, April 6). Country fact sheet on food and agriculture policy trends. Fapda. http://www.fao.org/docrep/field/009/i3761e/i3761e.pdf
- Frédéric, L., Chan, S., & Kim, M. (2017). Technical Report: Cambodian Rice Sector Economic Observatory. Centre for Policy Studies.
- Gani, O., & Hossain, E. (2015). Market participation decision of smallholder farmers and its determinants in Bangladesh. Ekonomika Poljoprivrede, 62(1), 163–179. https://doi.org/10.5937/ekopolj1501163g
- Geremewe, Y. T. (2019). Determinants of potato marketed surplus among smallholder farmers in Sekela District, West Gojjam Zone of Amhara Region, Ethiopia. Food Science and Quality Management, 5(1), 20–26. https://doi.org/10.7176/fsqm/83-06
- Geremewe, Y. T., Tegegne, B., & Gelaw, F. (2019). Determinants of potato (Solanum Tuberosum L.) producers market outlet choices in the case of Sekela district, west Gojjam zone, Amhara national regional state, Ethiopia. Journal of Agricultural Economics and Rural Development, 5(1), 535–541.
- Ghimire, R., & Suvedi, M. (2018). Farmers’ adoption of improved rice varieties in Cambodia. Journal of ISSAAS (International Society for Southeast Asian Agricultural Sciences), 24(1), 41–57.
- Goshme, D., Tegegne, B., & Zemedu, L. (2018). Determinants of sesame market supply in Melokoza District, Southern Ethiopia. International Journal of Research Studies in Agricultural Sciences (IJRSAS), 4(10), 1–6. https://doi.org/10.20431/2454-6224.041000
- Hailu, A. (2016). Value chain analysis of vegetables: The case of Ejere district, West Shoa zone, Oromia national regional state of Ethiopia [ Doctoral dissertation]. Haramaya University.
- Ishaq, M., Sadiq, G., & Saddozai, S. (2003). An estimation of cost and profit functions for offseason cucumber produce in district Nowshera. Sarhad Journal of Agriculture, 19(1), 155–162.
- Iwahashi, Y., Ye, R., Kobayashi, S., Yagura, K., Hor, S., Soben, K., & Homma, K. (2021). Quantification of changes in rice production for 2003–2019 with MODIS LAI data in Pursat Province, Cambodia. Remote Sensing, 13(10), 1971.
- Jagwe, J., Machethe, C., & Ouma, E. (2010). Transaction costs and smallholder farmers’ participation in banana markets in the Great Lakes Region of Burundi, Rwanda and the Democratic Republic of Congo. African Journal of Agricultural and Resource Economics, 6(1), 302–317.
- Jaji, K., Man, N., & Nawi, N. M. (2018). Factors affecting pineapple market supply in Johor, Malaysia. International Food Research Journal, 25(1), 366–375.
- Japan Development Institute. (2010). Cambodia Mekong river basin agriculture and logistics system development project. Engineering and Consulting Firms Association, Japan.
- Kassa, G., Yigezu, E., & Alemayehu, D. (2017). Determinants of smallholder market participation among banana growers in bench Maji Zone, Southwest Ethiopia. International Journal of Agricultural Policy and Research, 5(11), 169–177.
- Kea, S., Li, H., & Pich, L. (2016a). An analysis of technical efficiency for household’s rice production in Cambodia: A case study of three districts in Battambang Province. Global Journal of Human Social Science Research, 16(3), 1–21. https://doi.org/10.20944/preprints201610.0135.v1
- Kea, S., Li, H., & Pich, L. (2016b). Technical efficiency and its determinants of rice production in Cambodia. Economies, 4(4), 1–17. https://doi.org/10.3390/economies4040022
- Kebede, B., Ewang, P. N., & Ndemo, E. (2017). The analysis of profitability of smallholder potato growers in Bore District, Guji Zone, Oromia Regional State, Ethiopia. Journal of Resources Development and Management, 38(2017), 1–6.
- Khanal, N. P., & Maharjan, K. L. (2014). Factors influencing farmers’ behavior in rice seed selling in the market: A case study in the Tarai region of Nepal. Agricultural and Food Economics, 2(1), 14. https://doi.org/10.1186/2193-7532-1-14
- Khounthikoumane, S., Chang, J. B., & Lee, Y. (2021). Profit efficiency of rice farms in wet-season lowlands in champhone district, Savannakhet Province, Lao PDR. Agriculture (Switzerland), 11(7), 657. https://doi.org/10.3390/agriculture11070657
- Khut Inserey. (2013). Cambodia must up its game in rice exports. The Asia Foundation. https://asiafoundation.org/2013/05/01/cambodia-must-up-its-game-in-rice-exports/.
- Kiritani, K. (1979). Pest management in rice. Annual Review of Entomology, 24(1), 279–312. https://doi.org/10.1146/annurev.en.24.010179.001431
- Kyaw, N. N., Ahn, S., & Lee, S. H. (2018). Analysis of the factors influencing market participation among smallholder rice farmers in Magway Region, Central Dry Zone of Myanmar. Sustainability (Switzerland), 10(12), 4441. https://doi.org/10.3390/su10124441
- Lakapunrat, N., & Thapa, G. B. (2017). Policies, socioeconomic, institutional and biophysical factors influencing the change from rice to sugarcane in Nong Bua Lamphu Province, Thailand. Environmental Management, 59(6), 924–938. https://doi.org/10.1007/s00267-017-0843-2
- Lefebo, N., Haji, J., Getu, E., & Zemmedu, L. (2016). Determinants of market participation among kocho producers in Hadiya zone, Southern Region, Ethiopia'. Journal of Marketing and Consumer Research, 21, 41–49.
- Mariano, M. J., Villano, R., & Fleming, E. (2012). Factors influencing farmers’ adoption of modern rice technologies and good management practices in the Philippines. Agricultural Systems, 110, 41–53. https://doi.org/10.1016/j.agsy.2012.03.010
- Martey, E., Al-Hassan, R. M., & Kuwornu, J. K. M. (2012). Commercialization of smallholder agriculture in Ghana: A Tobit regression analysis. African Journal of Agricultural Research, 7(14), 2131–2141. https://doi.org/10.5897/AJAR11.1743
- Mdoda, L., & Obi, A. (2019). Analysis of profitability of smallholder irrigated food plots in the Eastern Cape Province of South Africa. Journal of Agribusiness and Rural Development, 53(3), 225–232. https://doi.org/10.17306/j.jard.2019.01265
- Meas, K. R. (2017). Newsletter for the ACIAR Project CSE/2015/044. https://docplayer.net/149932223-C-kbhb-kh-r-r-t-l-s-khmer-rumduol-meas-no-2-october-2017.html
- Modeste, M., Mulyungi, P., Wanzala, F. N., Eric, N., & Aimable, N. (2018). Effect of social-economic factors on profitability of soya bean in Rwanda. International Journal of Scientific & Engineering Research, 9(9), 828–833.
- Moono, L. (2015). An analysis of factors influencing market participation among smallholder rice farmers in Western Province, Zambia [Research Theses 243459]. Collaborative Masters Program in Agricultural and Applied Economics.
- Mwatawala, H. W., Mponji, R., & Sesela, M. F. (2019). Factors influencing profitability of small-Scale tomato (Lycopersicon esculentum) production in Mvomero District, Tanzania. International Journal of Progressive Sciences and Technologies, 14(1), 114–121.
- Nabay, O., Koroma, M., Johnson, A. J., & Kassoh, F. S. (2020). Analysis of the profitability and marketing distribution channels of sweet potato business in Sierra Leone. Journal of Agricultural Extension and Rural Development, 12(2), 26–35. https://doi.org/10.5897/jaerd2019.1123
- Nesbitt, H. J. (Ed.). (1997). Rice production in Cambodia. Internatonal Rice Research Institute.
- Nguyen, Y. T. B., Kamoshita, A., Araki, Y., & Ouk, M. (2011). Farmers’ management practices and grain yield of rice in response to different water environments in Kamping Puoy Irrigation Rehabilitation area in northwest Cambodia. Plant Production Science, 14(4), 377–390. https://doi.org/10.1626/pps.14.377
- Okal, J. O., Omunyin, P. M. E., & Gor, P. C. O. (2017). Determinants of pineapple market supply in Bureti Sub County, Kericho County, Kenya. International Journal of Recent Research in Interdisciplinary Sciences, 4(4), 1–9.
- Okam, C., Yusuf, O., Abdulrahman, S., & Suleiman, A. (2016). Comparative analysis of profitability of rice production among men and women farmers in Ebonyi State, Nigeria. Asian Journal of Agricultural Extension, Economics & Sociology, 10(1), 1–7. https://doi.org/10.9734/ajaees/2016/18391
- Onoja, A. O., & Herbert, C. (2012). Econometric evaluation of rice profitability determinants in Kogi State, Nigeria. Journal of Agricultural Extension and Rural Development, 4(5), 107–114. https://doi.org/10.5897/jaerd11.071
- Otsuka, K., Liu, Y., & Yamauchi, F. (2016). Growing advantage of large farms in Asia and its implications for global food security. Global Food Security, 11, 5–10. https://doi.org/10.1016/j.gfs.2016.03.001
- Ouattara, N. B., Xiong, X., Guo, C., Traoré, L., & Ballo, Z. (2022). Econometric Analysis of the Determinants of Rice Farming Systems Choice in Côte d’Ivoire. SAGE Open, 12(2), 21582440221094605.
- Patterson-Andrews, H., & Pemberton, C. A. (2014). Factors affecting profitability of small scale farming in southern Trinidad & Tobago. International Journal of Food and Agricultural Economics, 2(3), 1–18.
- Rehman, A., Chandio, A. A., Hussain, I., & Jingdong, L. (2019). Fertilizer consumption, water availability and credit distribution: Major factors affecting agricultural productivity in Pakistan. Journal of the Saudi Society of Agricultural Sciences, 18(3), 269–274. https://doi.org/10.1016/j.jssas.2017.08.002
- Rido, T. (2014). Factors affecting cost efficiency of Cambodian rice farming. Forum of International Development Studies, 45(2), 18–38.
- Rugube, L. M., Nsibande, S. P., Masarirambi, M. T., & Musi, P. J. (2019). Factors affecting profitability of smallholder vegetable farmers in the Shiselweni Region, Kingdom of Eswatini (Swaziland). Sustainable Agriculture Research, 8(1), 104. https://doi.org/10.5539/sar.v8n1p104
- Salaisook, P., Faysse, N., & Tsusaka, T. W. (2020). Reasons for adoption of sustainable land management practices in a changing context: A mixed approach in Thailand. Land Use Policy, 96, 104676. https://doi.org/10.1016/j.landusepol.2020.104676
- Samnang, R., & Chanthol, H. (2018). Slum areas in Battambang and climate resilience. Asian Journal for Public Opinion Research, 5(2), 104–126.
- Serey, M., & Lee, Y. (2018). Study on rice value chain in Svay Rieng province, Cambodia. Asian Journal of Agricultural and Environmental Safety, 2018(1), 17–22.
- Shrestha, R. B., Bhandari, H., & Pandey, S. (2022). Profit efficiency of smallholder vegetable farms in Nepal: Implications for improving household income. Frontiers in Sustainable Food Systems, 5, 691350. https://doi.org/10.3389/fsufs.2021.691350
- Siziba, S., Nyikahadzoi, K., Diagne, A., & Fatunbi, A. A. (2011). Determinants of cereal market participation by sub-Saharan Africa smallholder farmers. Learning Publics Journal of Agriculture and Environmental Studies, 2(1), 180–193.
- Srean, P., Eang, B., Rien, R., & Martin, R. J. (2018). Paddy rice farming practices and profitability in northwest Cambodia. Asian Journal of Agricultural and Environmental Safety, 2018(1), 1–5.
- Teshome, A., Deribe, Y., & Sime, M. (2021). Determinants of productivity and profitability performance of smallholder common bean producers in Central Rift Valley of Ethiopia. Anatolian Journal of Economics and Business, 5(1), 27–48.
- Tolno, E., Kobayashi, H., Ichizen, M., Esham, M., & Balde, B. (2016). Potato production and supply by smallholder farmers in Guinea: An economic analysis. Asian Journal of Agricultural Extension, Economics & Sociology, 8(3), 1–16. https://doi.org/10.9734/ajaees/2016/21726
- Tu, V. H., Can, N. D., Takahashi, Y., Kopp, S. W., Yabe, M., & Yildiz, F. (2018). Modelling the factors affecting the adoption of eco-friendly rice production in the Vietnamese Mekong Delta. Cogent Food & Agriculture, 4(1), 1432538. https://doi.org/10.1080/23311932.2018.1432538
- Tumukunde, R., Mulyungi, P., & Mburu, D. M. (2020). Effect of market factors on rice profitability in Rwanda. International Journal of Science and Research, 9(8), 232–237. https://doi.org/10.21275/SR20707183245
- United States Department of Agriculture. (2021). Grain: World markets and trade. Global market analysis. United States Department of Agriculture Foreign Agricultural Service.
- Workye, A., Goshu, D., & Tegegne, B. (2019). Analysis of factors influencing market supply of rice by smallholder farmers in Guraferda District, Southwest Ethiopia. Agriculture, Forestry and Fisheries, 8(5), 95. https://doi.org/10.11648/j.aff.20190805.11
- Xaba, B. G., & Masuku, M. B. (2012). Factors affecting the choice of marketing channel by vegetable farmers in Swaziland. Sustainable Agriculture Research, 2(1), 112. https://doi.org/10.5539/sar.v2n1p112
- Yu, B., & Fan, S. (2011). Rice production response in Cambodia. Agricultural Economics, 42(3), 437–450.
- Zorya, S., Rozemuller, H. B., Dawe, D., Kung, M., & Manythong, C. (2016). Rice sector development and poverty reduction in the greater Mekong subregion: Leveraging the rice value chain for poverty reduction in Cambodia, Lao PDR, and Myanmar ( No. 105285, pp. 1–88). The World Bank.