
 ?Mathematical formulae have been encoded as MathML and are displayed in this HTML version using MathJax in order to improve their display. Uncheck the box to turn MathJax off. This feature requires Javascript. Click on a formula to zoom.
Abstract
This study proposes a model-based design and development of ventilated horticultural product crate from bamboo using a validated computational fluid dynamics and finite element analysis models. The models were used to predict the airflow, pressure and temperature distributions, and mechanical integrity of the crate. The model results were validated using experimental results. Results of the newly developed crate were compared to the commonly used conventional wooden crate. The optimal vent area, vent number, and cooling air velocity were found to be 8%, nine vents, and 1.38 m s−1, respectively. Compared to the conventional crate, the improvement in cooling rate, pressure drop, and flow uniformity was 60%, 98%, and 37.9%, respectively. The maximum deformation in the conventional wooden and newly developed crates was 28.483 mm and 0.329 mm, respectively. The results indicate that the newly developed bamboo-based crate has good air ventilation, good cooling, and best in mechanical integrity. We conclude that the improved bamboo crate is a viable alternative to the present post-harvest packaging constraints.
Public Interest Statement
This research focuses on designing, developing, and testing of a ventilated packaging system for horticultural products from bamboo. Bamboo is a strong, lightweight, quick-growing, and environmentally friendly material that could be used in the development of sustainable optimal packaging system of horticultural produces. The study applied validated Computational Fluid Dynamics and Finite Element Analysis Models to develop an optimal ventilated horticultural produce crate from bamboo. The newly developed bamboo crate showed significant improvement in mechanical strength and cooling performance compared to the conventional wood crate. This sustainable package could have a significant contribution in reducing the post-harvest loss of fresh produces, if it is properly used by farmers, cooperatives, distributors, and retailers.
1. Introduction
Society uses old and primitive ways of horticulture product handling packages; which are produced through trial and error. This trial and error method is known to have drawbacks in terms of mechanical strength and cooling characteristics. Horticultural products are highly perishable, and maintaining the required quality during the post- harvest handling period is very challenging (Talib, Citation2015). Postharvest losses are 20–50 % in unindustrialized nations and 5–25 % in industrialized countries (Kitinoja, Citation2013). The increased demand for quality of horticulture produces leads to exploring new ideas to reduce post -harvest losses (Beukeman, Citation1980; Mennad & Khan, Citation2018).
Bamboo is a lightweight, high-strength, fast-growing, and renewable that makes bamboo a good alternative material in many engineering applications, including packaging of fresh horticultural produces (Mulatu et al., Citation2016).
Packages are usually designed with ventilated holes, which help to maximize cooling and minimize airflow resistance. A good horticulture package should include enough vent holes to permit heat exchange within the packaging system. However, these events should not compromise the mechanical strength of the package (Ambaw et al., Citation2013, Citation2017; Delele et al., Citation2013). There are a variety of fresh horticultural crate designs on the market right now, and most of them were created via trial and error. The main constraints of the present traditional wood horticultural produce packages are overloading, sub-optimized design, insufficient ventilation, uneven temperature, humidity, and air distribution. In the design and development of fresh produce packaging systems, experimental studies are usually expensive, time-consuming, and difficult due to the natural biological variability of produces (Delele et al., Citation2013; Vigneault & Goyette, Citation2003). Nowadays, with the availability of high-performance computers at a reasonable price, computational methods are becoming a cheap alternative to overcome the challenges of experimental studies.
Different model-based studies on horticultural produce packaging systems revealed the applicability of mathematical models in optimizing the design and handling procedure of the packages system. However, many studies are done either using computational dynamics (CFD) or finite element method (FEM). Studies conducted on CFD mainly focused on the prediction of cooling airflow, temperature, and humidity distributions. The studies on FEM focused mainly on the mechanical integrity of the package subjected to an external load (Delele et al., Citation2008, Citation2013; Fadiji, Ambaw, et al., Citation2018; Pathare & Opara, Citation2014). The presence of hand and vent holes on a package results in a 20–50% drop in the compression strength (Ferrua & Singh, Citation2007). Package mechanical strength has an inverse relation with cooling characteristics. A model that has the capacity to simultaneously predict the ventilation, cooling characteristics, and mechanical integrity of the package, is not yet available. A more comprehensive combined CFD-FEM model has the potential to design and develop a package with better performance. This study aims to minimize the current limitations of local horticulture crate packaging by designing and developing an efficient, cheap, and strong bamboo-based horticultural produce package using an integrated CFD-FEM modeling procedure.
2. Materials and methods
2.1 Pre-cooling experimental studies
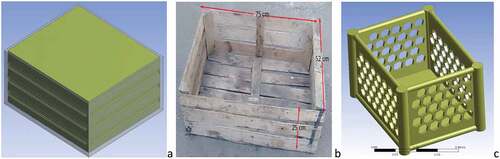
A rectangular-shaped bamboo crate with a size of 400 mm × 300 mm × 250 mm internal dimension and 15 mm thickness, and a capacity of 18 kg was constructed as an initial design (Table ). The selection of this size was based on the size and capacity of the commonly used commercial horticultural carton packages (ISO, Citation2003). The recommended size of the horticulture packaging must be 600 × 400 mm in length and width, according to the international standard (ISO, Citation2003), which provides a series of measurements for rigid rectangular transport packages based on standard plan dimension (module). Sizes less than 110 × 122 mm are too small and should not be used. The length and width of the bamboo crate were fixed to determine the height. In South Africa, the telescopic standard vent package.is 500 × 333 × 270 mm size (Fadiji, Ambaw, et al., Citation2018). Due to its ease of construction, higher compressional strength, and lower pressure drop hexagonal shape vents were used (Delele et al., Citation2013; Ferrua & Singh, Citation2007). Bamboo slats were put together (arranged) to have a hexagonal vent structure without processing to a continuous sheet.
Table1. List of abbrivation
Freshly harvested tomato (18 kg) was used as a simulator. The bulk porosity (ɛ) of (75% filled tomato) was 0.43%. The tomato-loaded crate was positioned at 1 m from the inlet of the rectangular sheet metal air tunnel. The dimensions of the rectangular air tunnel were 175 mm length, 30 mm width, and 25 mm height. It is made of aluminum sheet metal (0.4 mm), and the product was located 100 mm far from the entrance. The gap between the air tunnel and the package was cleared to prevent air leakage. This aids in the even distribution of cold air. An axial fan (40 Watt Ventilator Exhaust Fan, 220-V AC, size 350 mm × 350 mm) was used to force the air at the inlet of the tunnel. The cold air passes through the tomato-stacked crate. Six K-Type thermocouples (PWHT Tech India Pvt Ltd, India) were inserted at entrance, middle, and exit positions in the tomato center on the tomato loaded bamboo crate as shown in Table . Similarly, the Testo-410i anemometer (TESTO, INC, 40 White Lake Rd, Sparta, USA) and Hobo temperature and Humidity Data Logger (HOBO U×100–011) (Greenland Technology Limited, Hong Kong, China) were used to measure cold air velocity and humidity, respectively, as shown in Figure . The cold air was extracted from a rectangular evaporative cooler made of cotton fibers with a cross-sectional area of 0.1225 m2. The reservoir was filled with water (25C) and continuously circulated to remove the heat of incoming air. Water ice was added to the flowing water to achieve the desired air temperature (15°C) at the exit of the evaporative cooler (Mekonen et al., Citation2023).
Figure 1. Experimental setup for precooling of tomato.
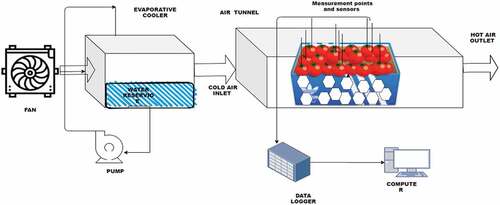
Table 2. Schematically representation of tomato cooling locations
The following variables were assessed during the experiment:
2.1.1 Evaluation of cooling rate
The cooling rate was determined using dimensionless temperature (Y) as determined by EquationEquation 1(1
1 Defraeye et al., Citation2015).
Where: Ta—cooling air temperature, Tpin–initial product core temperature, and Tp–produce core temperature at different times.
2.1.2 Evaluation of pressure drop
Darcy—Forchheimer equation was used to calculate pressure drop as a function of velocity (Delele et al., Citation2010). Predicted pressure drops for inlet cold air superficial velocity 0.5, 0.65,1, 1.5, 2, 2.5, 3, 3.5, 4, and 5 m s−1 were determined.
Where
2.1.3 Evaluation of temperature and velocity distribution
The fruit core temperature and velocity were taken at six different locations (Table ) and standard deviation (RSD) was calculated (Delele et al., Citation2013).
where and Xi are average variables and an instantaneous value is obtained at a specific position as shown in Table .
Table 3. Experimental design and results of RSM analysis
2.2 CFD model and experimental validation
In this study, the Reynolds Averaged Navier—Stokes (RANS) equations were resolved in three dimensions to predict the air flow and the cooling characteristics of the tomato.
The continuity equation
Conservation of momentum
Conservation of energy (solid and air domain) is show in Table .
Table 4. Air domain
where ρ is the density of the fluid, Cpa and Cpp are heat capacity of air and produce (Jkg −1K−1), U is a vector of the velocity (ms−1), µ is the dynamic viscosity of air (Pa·s), kt is turbulent thermal conductivity (Wm−1K−1), ρa is the density of air (kg m−3), Su is Source term, t is time (s), ∇p is pressure drop (pa), Ka and Kp are the thermal conductivity of air and produces (Wm−1K−1), hpa is Convective coefficient, and μt is turbulent eddy viscosity (kg m−1s−1),Ta and Tp is the temperature of air and produces (K), and Qresp is the heat of respiration (Ambaw et al., Citation2017; Mukama et al., Citation2020).
The heat of respiration evolved in tomato was added as an external heat source (su); the term is determined by EquationEquation 1414
14 &Equation15
15
15 .
where Tp is produce temperature, ρp is density of produce, q resp is the respiration coefficient, and the respiration coefficients of tomatoes are f (2.008 × 10⁻²) and g (2.835) (Ibarz & Barbosa-Canovas, Citation2020).
The geometry of the crates (the newly designed bamboo crate (400 mm × 30 mm × 250 mm) and conventional wood package (750 mm × 520 mm × 250 mm) was developed using ANSYS® (V.18) design modular. Tomatoes with an average diameter of 54.5 mm were stacked; this was the average size of the tomatoes that were used in the experiment. The vent area in the conventional wood crate and a newly developed bamboo crate was 2.7% and 16%, respectively, as shown in Figure . The domain was discretized using a high-quality tetrahedral hybrid mesh (skewness < 0.6) and an enhanced wall function with an inflation program. The grid size was 10 mm, and its selection was done after a grid sensitivity analysis of the product temperature using grid size in the range of 5–80 mm.
Figure 2. Conventional wood crate (a and b) and newly designed bamboo crate (c).
A porous media modeling approach was used to simulate the conventional wood package because of the high computational cost. In forced convection heat transfer, the convective heat transfer coefficient for spherical particles, the Reynolds Number (Re) and Prandtl Number (Pr), are determined by EquationEquations 16–16
16 Equation18
18
18 (Vigneault, Citation2010).
where d is the characteristic length of the produce surface (m), k is the cooling fluid’s thermal conductivity, and Nu is the Nusselt number.
Due to its best effect on the wall function, the shear stress transport) (k-ω) SST turbulence model was used. Transient cooling was carried out for 3 h, with 200 s time steps; the selection of this value was based on time step sensitivity analysis as shown in (Figure ). The simulated volume average temperature of fruit was calculated for various mesh sizes (90-5 mm), and the mesh size was selected when the simulated volume average temperature variation was almost zero beyond a particular number of elements (2294874). These values were obtained when the mesh size is 10 mm as shown in Figure . The result shows that using a mesh size less than 10 mm has no merit, and a similar approach has been applied by other studies (Balduzzi et al., Citation2016; Couto, Citation2018; Lee et al., Citation2020). The time step utilized to compute the entire grid determines the computational cost and precision of the output. Based on time-step independent analysis, the time step size in this CFD simulation was 200 s as shown in Figure . The convergence criterion was 10−4 on the energy, momentum, and continuity terms and 10−3 on the viscous term to monitor the residuals using the CFX solver. During simulation, The following assumptions were considered, turbulence flow, spherical shape tomato, mass transfer is assumed negligibly small, uniform initial temperature of the product and constant material properties. The boundary conditions, air domain, and model input parameters are illustrated in Table , Table , Table and Table .
Figure 3. Mesh independence study (a) and Time step sensitivity analysis (b).
Table 5. Porous domain model parameters
Table 6. Thermo-physical properties of tomato
Table 7. Thermo-physical properties of bamboo
The validation of the CFD model was carried out by comparing the simulation and measured values of temperature and pressure. Accuracy of prediction (numerical vs. experimental) velocity, and pressure distributions were calculated using (Delele et al., Citation2010):
where PE—mean percentage error, Xm—measured value, and as simulated values of temperature or pressure in the domain.
2.3 Finite element model of the ventilated crate
The mechanical integrity of the package subjected to an external force applied in a perpendicular direction as a representation of the load exerted by the produce inside it and the loaded crates loaded over it was the focus of the FEM studies as shown in Figure ). The targeted crate was the bottom crate with seven crates loaded over it, where Force 1 is the load from the above-loaded crates and Force 2 is the load from the produce inside the bottom crate. The mechanical properties of both the newly designed bamboo crate and the conventional crate made of eucalyptus wood are shown in Table and , respectively.
Figure 4. Loads and constraints in FEA model (a) newly developed, (b) conventional wood crate.
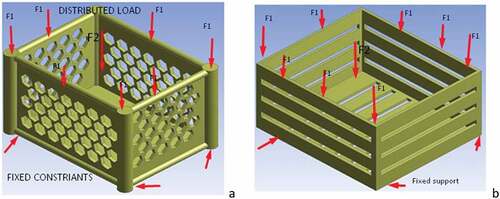
Table 8. Orthotropic elastic constants of bamboo (Abdullah et al., Citation2017; Li, Citation2004; Takeuchi et al., Citation2016
Table 9. Orthotropic elastic constants of eucalyptus wood,Crespo et al. (Citation2017)
Strength is a property determined by the greatest stress the material can withstand before failure. The yield limit of the material is usually selected as the ultimate stress in static evaluation. Bamboo has a tensile strength of 150–320 MPa, while wood has a tensile strength of 34–220 MPa (Fadiji, Coetzee, et al., Citation2018; Yasin & Priyanto, Citation2019). Based on the yield stress limit of bamboo and eucalyptus wood calculated using the permissible limit stress σ where σ is the permissible stress, σs is the yield stress limit, and ns is the safety factor coefficient, the safety factor varies from 1.5 to 2 (Pandiaraj et al., Citation2016). The allowable stress of bamboo is 75–160 MPa, while that of eucalyptus wood is 17–110 MPa.
In this study, the mechanical deformation and stress of the newly designed bamboo crate and conventional eucalyptus woods crate was predicted using ANSYS static structure. In both crates, the overall load applied was equal and in a similar direction, which was down to the bottom crate.
2.4 Optimization of the ventilated bamboo crate
In order to evaluate the effect of multiple factors and their interactions on one or more response variables, an optimal custom design (OCD) Response Surface Method of optimization (RSM) technique was used (Kumar & Sharma, Citation2020). The post-process results of ANSYS CFX and ANSYS static structure were imported. Simultaneously, a CFD and FEA study was conducted. In this study, the factors to be optimized are vent area (1, 5, 10, 15, 20, 25%), vent number (1, 3, 5, 7, 9), and cooling air velocity (0.1–5 m s−1) at cooling air temperature 15°C. These factors were chosen because they had a key influence on mechanical and flow characteristics. The values of the factors were selected based on previous studies (Ambaw et al., Citation2013; Defraeye et al., Citation2013; Delele et al., Citation2013; Thompson et al., Citation2009). The objectives of optimization were to maximize temperature uniformity, maximize cold airflow uniformity, maximize cooling rate, minimize pressure drop, minimize stress concentration, and minimize deformation (Table ).
Table 10. Snapshot of optimization of multiple factors and responses
3. Results and discussion
3.1 Pre-cooling experimental work
In Figure , the average temperature of tomato after 3 h of cooling was lowered to 18°C from an average field temperature of 29.95°C. The temperature was recorded at 30-min interval. The half-cooling time (HCT) is the time it takes to reduce the original produce temperature and cooling temperature by half (Y = 0.5), and the seventh-cooling time is the time it takes to reduce the beginning temperature by seven-eighths (Y = 0.125). From EquationEquation (1)1
1 , the HCT and SECT were 1.74 hr and 5.2 hr, respectively. The cooling rate of tomato was 5.31°C h−1 and 2°C h−1 at the cooling time of 0.5 and 3 h, respectively.
Figure 5. Experimental dimensionless average temperature of tomato after 3 hr. of cooling.
The cooling rate was exponentially decreased over time until the temperature difference between tomato and cooling air temperature was small enough. At 7/8th cooling time, about 87.5% of initial tomato is removed. Afterward, the fruit can be transferred to storage facilities where the remaining heat load can be removed with lower energy costs (Defraeye et al., Citation2015; Han et al., Citation2018). The results from this study were in agreement with previous studies that were conducted on precooling of different horticultural products. Different authors have investigated and pointed out that the cooling rate of horticultural produces decreased exponentially with time (Cherono et al., Citation2018; Defraeye et al., Citation2015; Ghiloufi & Khir, Citation2019a; Zhao et al., Citation2016). The average seven-eighth cooling times for the pre-cooling process under different conditions ranged from 217 to 76 min (Elansari & Mostafa, Citation2020).
3.2 CFD model results and validation
3.2.1 Validation of cooling rate and temperature distribution
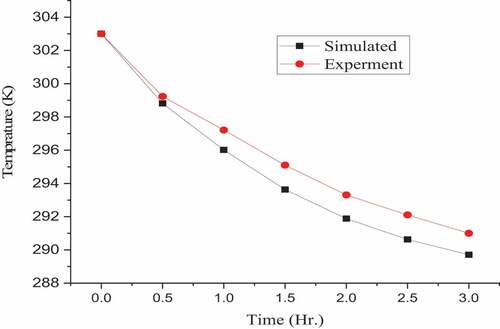
The temperature was recorded at 30-min interval. The simulated or predicted cooling times for HCT and SECT were 1.108 and 3.37 h, respectively. At 0.5 and 3 h, the simulated cooling rate of tomatoes was 7.56 and 1.66°C h−1, respectively. This shows that the core temperature of the produce decreased exponentially with time and the cooling rate was higher at the beginning as shown in Figure . According to Newton’s law of cooling, as the temperature differential between the product and the cooling air decreases, the amount of heat removed decreases. Product quality, shelf life, precooling time, and total product throughput are all affected by cooling rate (Defraeye et al., Citation2015).
Figure 6. Simulated vs. experiment average tomato temperature at 3 hr cooling time.
The temperature gradient decreased from the entrance to the exit. Good heat transfer exists near the entrance rather than the exit as shown in Figure . The region of low cooling rate and high temperature was due to the blockage of cooling air and eddy near the exit of the crate.
The relative percentage variation in volumetric average temperature between simulated and experiment was 5.14%. This indicates that there is a relatively good agreement between the simulated and experimental results with a slight over prediction of the cooling rate. The main reason for the deviation of the predicted result from the experiment could be the literature values and the assumptions that were taken for thermo physical properties of tomato, the actual thermo physical property of the tomato used in this experimental study could be different from those data. Delele et al. (Citation2013) conducted a study on the airflow and heat transfer characteristics of horticulture packaging systems using CFD. The results show that there is a good agreement between the predicted and measured results; the average relative error of the produce temperature was 16.27%. An integral approach to evaluate the cooling rate and cooling uniformity was studied, and the deviation between the predicted and experimental values of the apple surface temperature was 18.7% (Han et al., Citation2018).
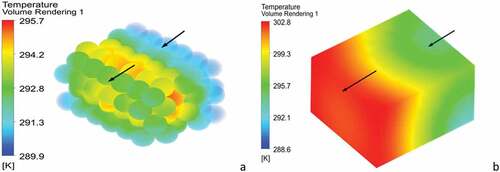
Simulated average temperatures at the inlet, center, and exit were 15.27, 15.33, and 16.53°C, respectively. The temperature uniformity/distributions in the product domain are far from uniform, as shown in (Figure ). This was due to the non-uniform cooling airflow pattern that existed. The average temperatures for the newly developed and real wood crates after 3 h of cooling were 16.71 and 24.65°C, respectively. The temperature reduction observed in the conventional wood crate (Figure ) was only 5.30°C, while, in the newly developed crate, it was 13.24°C (Figure ).
Figure 7. Temperature distribution (a) newly developed and (b) conventional wood crate.
3.2.2 Validation of pressure drop
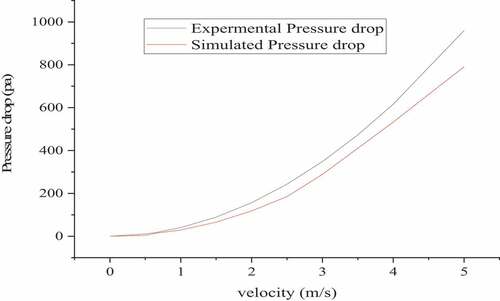
The pressure drop had a direct relation with the cold air superficial velocity. The simulated pressure drop at low velocity (0.5 m s−1), high velocity (5 m s−1), and working velocity (0.65 m s−1) was calculated to be 3.64, 790.62, and 14.18 Pa, respectively. As the velocity increased, the pressure drop increased (Trahana et al., Citation2014; Vigneault & Goyette, Citation2003). In this study, the average relative error between the pressure drop that was calculated using Darcy—Forchheimer equation and simulated using CFD modeling was 25% as shown in Figure . (Ambaw et al., Citation2017) conducted numerical and experimental studies on plastic-based package design, and found an average prediction error of 15% that was higher than the measured values. In their study on ventilated horticultural produce package, Delele et al. (Citation2013) reported 13.8% average relative errors for predicted pressure drop. The relatively high deviation in this study was due to the assumptions used in Darcy—Forchheimer equation. A possible reason for the deviation from literature values is the difference in cooling velocities using different crate geometry, percentage vent area, vent size, shape, and assumptions used. The calculated coefficients of Darcy—Forchheimer equation do not accurately represent the flow characteristics.
Figure 8. Simulated vs. experiment pressure drop at different cooling air velocities.
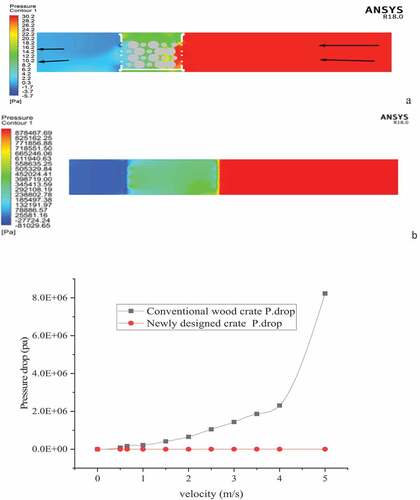
For a constant air flow rate, the conventional wood crate showed a much higher pressure drop than the newly designed bamboo crate as shown in Figure (a, b, c). This is due to the low ventilation area of the wood crate. In the new bamboo-based design, the pressure drop was reduced by 98% from the conventional wood crate Figure . Generally, the newly developed crate is better in terms of the energy consumption and cooling uniformity.
Figure 9. Predicted pressure contour at cooling air velocity (0.65 m/s) in newly bamboo crate (a), conventional wood crate (b), and conventional vs. newly designed crate pressure drop (c).
3.2.3 Validation of velocity distribution
The predicted velocity variation within the bulk of the produce was relatively large; it was in the range of 0–5.38 m s−1. The product in front of the vents was subjected to rather fast-moving air. Channel-like flow was observed near the surface of the confining walls as shown in . Relatively higher velocity was observed at the entrance and exit section, while low velocity was obtained at the center of the product. The homogeneity of the airflow was better at the center of the package compared to the entrance and exit regions. A similar observation was reported by (Dehghannya et al., Citation2011). To achieve a uniform distribution, it is better to operate at low velocities (Mennad & Khan, Citation2018). The percentage improvement in flow homogeneity in the newly developed bamboo crate was 37.9% compared to the wood crate.
Figure 10. Experimental vs. simulated velocity at operating velocity (0.65 m/s) (a), and velocity streamline for the conventional wood crate (b), and newly designed crate (c) at cooling air velocity (0.65 m/s).
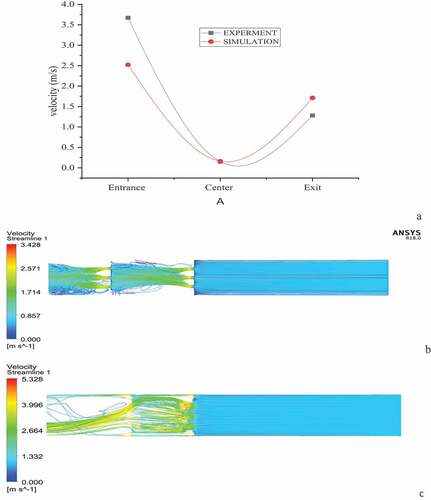
There was a 22.6% relative percentage difference between the simulated and experiment as shown in Figure . The results agree well with literature values, and the significant deviation is due to turbulence fluctuations causing the velocity to fluctuate unexpectedly. Such deviations may arise from measuring points that are not accurate and staking arrangements different in experiment and simulation. (Seyed et al, Citation2013) conducted a study on cooling of apple using an air tunnel system that was taken as a porous domain; the reported relative errors were 23.2% and 9.1% for velocity and temperature, respectively.
3.3 Finite element model
The effect of mesh size was analyzed and mapped against the total deformation; 10 mm mesh size was selected as the optimum size as shown in Figure .
Figure 11. Mesh independence study in FEA.
3.3.1 Total deformation analysis
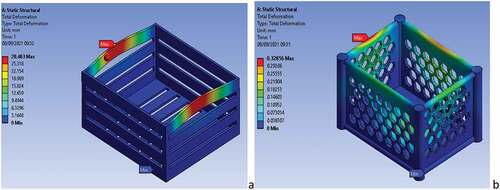
In a conventional wood crate, the maximum deformation predicted was 28.48 mm, and the maximum total deformation in the newly developed bamboo crate was 0.33 mm as shown in Figure (a and b). Maximum deformation was noticed at the top of the crate and decreases down to the bottom of the crate in traditional wood crates. This is due to the geometry and material property difference between the two crates. The newly developed crate had a substantially lower degree of overall distortion than the conventional wood crate (Figure b). In addition, the transverse and pillars in the new design were both capable of carrying the entire applied load.
Figure 12. Total deformations (TD) in a conventional wood crate (a) and newly developed bamboo crate (b).
3.3.2 Stress concentration analysis
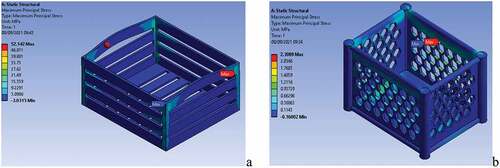
The predicted maximum equivalent stress in a conventional wood crate was 90.33 MPa, while in the newly developed bamboo crate it was 2.78 MPa. The maximum value of the effective principal stress in a conventional wood crate was 52.14 MPa in the corner or bent region, and the corresponding value for the newly developed bamboo crate was 2.31 MPa. If the computed equivalent stress values are less than the allowable stress, then it will not experience distortion or fracture failure as shown in Figure (a and b).
Figure 13. Maximum principal stress (a) conventional wood, (b) newly developed bamboo.
3.4 Parametric effect and optimization of the ventilated bamboo crate
3.4.1 Cooling rate
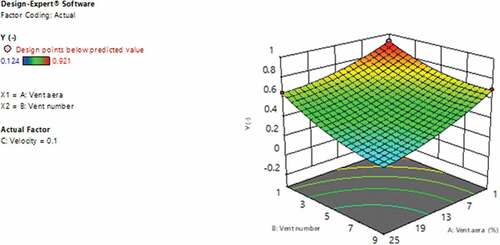
The model F-value of 480.12 and P-values less than 0.0500 imply that the model was significant. The ANOVA result for dimensionless temperature (Y) shows that cooling air velocity significantly affects the cooling rate (P < 0.05). R2 (0.9984) indicated how the model accurately includes most of the data in quadratic polynomial regression. At (4 m s−1), a high cooling rate was achieved with a large number of vents and a large vent area as shown in Figure . At high velocity, the best cooling rate was found at the highest vent area (25%) and highest vent number (9). At low velocity, the cooling rate became small due to the relatively low convective heat transfer coefficient. Eradication of the regions with hardly flow generation can increase ventilation efficiency (Kitazawa et al., Citation2012). The cooling time was significantly decreased when the air inflow velocity was increased. Generally, at high velocity, high vent area, and large vent number, a good cooling rate was achieved. Similar characteristics have been found in many works (De Castro et al., Citation2004; Defraeye et al., Citation2015; Ghiloufi & Khir, Citation2019b).
Figure 14. Effect of vent area and vent number on cooling rate.
3.4.2 Pressure drop
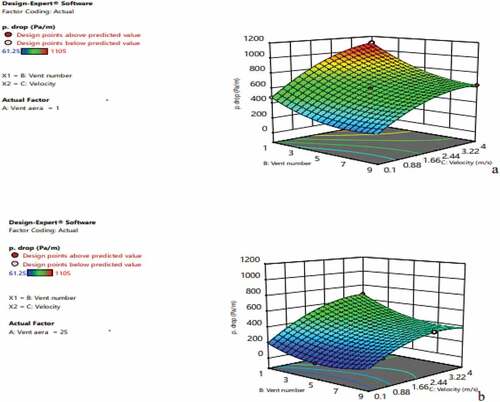
The pressure drop determines how much energy is needed to force the cold air medium. At low vent area and low vent number, the pressure loss was highest at higher velocity. This is due to friction loss and inertial loss dominated, as shown in Figure . The low-pressure drop was found at 0.1 m s−1 and at the highest vent area (25%). Similarly, a high-pressure drop was observed at low vent area (1%) and high velocity (4 m s−1). Some vented holes are likely to be covered by the product surface, and its effect is significant when the vent hole ratio is low. When the total surface vents in the wall of a plastic container are less than 25%, there is a significant influence on pressure loss during forced-air cooling (Pathare & Opara, Citation2014). Larger holes resulted in an increase in air velocity, cooling rate, and air velocity homogeneity, as well as produced lower air pressure drop (Figure ).
Figure 15. Effect of vent area on pressure drop (a) 1% and (b) 25%.
3.4.3 Velocity distribution
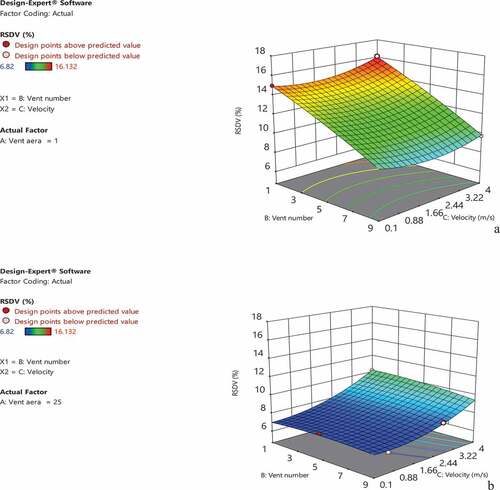
The Model F-value of 105.39 and (P < 0.05) implies the model is significant. R2 (0.9927) indicates that the model accurately includes most of the data in quadratic polynomial regression. Increased superficial velocity resulted in low-velocity homogeneity. At lower velocity, good uniformity was found at higher vent area and higher vent number. Figure (a and b) demonstrates that when the vent area was 1%, the cooling uniformity index RSDv (%) was higher; however, when the vent area was 25%, the RSDv was relatively low. The homogeneity of the flow was higher at higher vent area (25%) and lower velocity (0.1 m s−1); the most heterogeneous flow was recorded at low vent area (1%) and high velocity (4 m s−1) (Figure ). The most non-uniform cooling occurs around the entrance and exit regions of a vented package. Dehghannya et al. (Citation2012) observed a higher heterogeneous influx at lower vent number and vent area.
Figure 16. Effect of vent area on the velocity distribution (a) 1%, and (b) 25%.
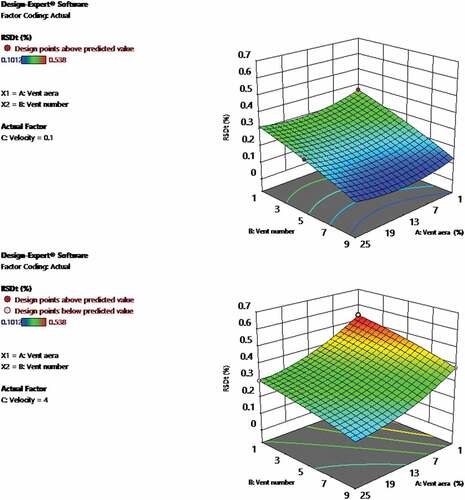
3.4.4 Temperature distribution
The model F-value of the temperature distribution was 16,047.02 and (P < 0.05) that implies the model is significant. The R2 (0.997), the value indicated how the model accurately includes most of the data in quadratic polynomial regression. The homogenous temperature distribution was observed at higher vent number and lower airflow velocity as shown in Figure (a and b). The temperature distribution was very heterogeneous at low vent areas and small vent numbers Figure . (Dehghannya et al., Citation2011) evaluated the performance of a ventilated package with vent areas of 2.4%, 7.2%, and 12.1% and it was found that the lowest vent area (2.4%) had the most cooling heterogeneity, while the highest vent area (12.1%) has good temperature distribution (Figure ). At high cooling velocity, cooling uniformity was better at vent areas more than 14% and large number of vents. De Castro et al. (Citation2005) examined the effect of cooling air flow rate on temperature distribution through ball matrix and it was found that flow uniformity was better at 0.125 L s−1kg−1 than at 0.5 L s−1kg−1.
Figure 17. Effect of velocity on temperature distribution (a) 0.1 m s−1 and (b) 4 m s−1.
3.4.5 Effect of vent area and vent number on mechanical strength
Vent area and vent number had a significant effect on total deformation and stress (p < 0.05), but air velocity has no significant effect on mechanical strength. An increase in vent area and vent number resulted in an increase in total deformation and decreased the buckling resistance. At the maximum vent area (25%) and maximum vent number (9), the highest stress concentration was observed. Fadiji, Ambaw, et al. (Citation2018) observed a similar behaviour in the study that was conducted on ventilated packaging systems on a wide range of ventilation (4–27%) for the corrugated boxes, and (Pathare & Opara, Citation2014) advised to avoid one large ventilation hole for such corrugated boxes.
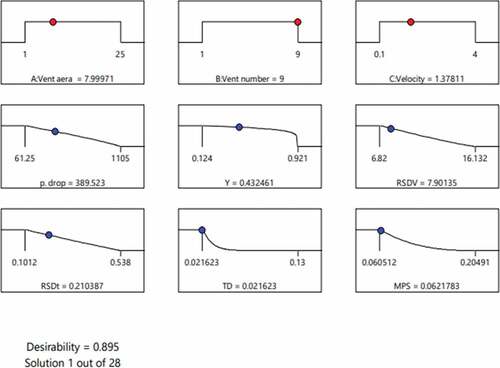
3.5 Optimum results
Based on the optimization study that was conducted on the newly developed bamboo crate, the optimal vent area, vent number, and cooling air velocity were found to be 8%, 9 and 1.38 m s,−1 respectively. The optimal results are shown in Table and Figure Previous studies reported that the ventilation area of the hole above 7% did not produce a significant effect on the cooling rate (Delele et al., Citation2013). Many studies were conducted on the effect of ventilation opening width on pressure loss. (De Castro et al., Citation2005) investigated the pressure loss through vented plastic boxes and recommended a vent-hole ratio of 25–27%. From the viewpoint of energy saving, the optimal vent area was suggested to be between 8% and 16%. About 6% package vent area was recommended by (Ferrua & Singh, Citation2007). The recommended cooling airflow rate for forced air-cooling using ventilated packages is between 0.9 and 1.5 m s−1 (Kitazawa et al., Citation2012; Mukama et al., Citation2020)
Figure 18. Ramp graphs of factors and responses.
4. Conclusion
Experimental and CFD modeling were conducted simultaneously to design and develop horticultural produce crate from bamboo. The study compared the new design with a conventional wood crate. The newly designed bamboo crate was much better in terms of cooling performance and mechanical integrity. There was a strong connection between cooling air velocity and temperature distributions. Better airflow and temperature uniformity were achieved by increasing vent number and vent areas. There was a relatively high velocity at the top, near the inlet and outlet sections, and relatively low airflow near the center and at the edges of the crate. The vent area and vent number significantly affect the mechanical integrity of the crate. Deformation and stress concentration were increased with an increase in the vent area. The optimal newly designed bamboo-based crate has a vent area, vent number, and cooling air velocity of 8%, 9, and 1.38 m s−1, respectively. The new design produced a substantially lower degree of overall distortion than the conventional wood crate. The strength of the newly developed bamboo crate is assured, but the conventional wood crate is susceptible to failure. Generally, based on CFD-FEA analysis, the cooling efficiency, cooling rate, cooling time, flow uniformity, cooling uniformity, and mechanical strength were sufficiently improved in the newly developed bamboo crate. This study could give some indirect information about the expected quality of the produce, the rate of respiration is highly affected by the produce temperature, and the incidence of produce mechanical injury is highly related to the mechanical integrity of the package. In the future, the effect of this package on the quality of the produce during cooling, storage, and retail should be studied. In conclusion, the improved bamboo crate is a viable alternative to the present post-harvest packaging constraints of horticultural produces.
Acknowledgments
Bahir Dar Institute of Technology, Bahir Dar University (BiT-BDU) research office is highly acknowledged for the financial support of the research.
Disclosure statement
No potential conflict of interest was reported by the authors.
Additional information
Notes on contributors
Sisay Wondmagegn Molla
Sisay wondmagegn Molla is an instructor in chemical engineering at Woldia University, has a significant expertise in modelling, process design and energy-related research.
Mulugeta Admasu Delele
Mulugeta Admasu Delele (PhD) is an associate professor at the faculty of chemical and food engineering, Bahir Dar Institute of Technology. He has extensive experimental and modelling research experience in horticultural produce packaging and related postharvest systems.
Tadelle Nigusu Mekonen
Tadelle Nigusu Mekonen is a lecturer at Departments of Chemical Engineering, Gondar Institute of Technology, University of Gondar. He has a research experience in modelling and design of process systems.
Alemayehu Ambaw Tsige
Alemayehu Ambaw Tsige (PhD) is a senior researcher at the South African research chair of Postharvest Technology. He is skilled in CFD modelling and artificial intelligence. He has been working expensively on postharvest systems, artificial neural networks, fruit quality, agricultural engineering, biological wastewater treatment and environmental engineering.
References
- Abdullah, A. H. D., Karlina, N., Rahmatiya, W., Mudaim, S., Patimah, & Fajrin, A. R. (2017). Physical and mechanical properties of five Indonesian bamboos. IOP Conference Series: Earth and Environmental Science, 60 (1). https://doi.org/10.1088/1755-1315/601/1/012014
- Ambaw, A., Delele, M. A., Defraeye, T., Ho, Q. T., Opara, L. U., Nicolaï, B. M., & Verboven, P. (2013). The use of CFD to characterize and design post-harvest storage facilities: Past, present and future. Computers and Electronics in Agriculture, 93, 184–24. https://doi.org/10.1016/j.compag.2012.05.009
- Ambaw, A., Mukama, M., & Opara, U. L. (2017). Analysis of the effects of package design on the rate and uniformity of cooling of stacked pomegranates: Numerical and experimental studies. Computers and Electronics in Agriculture, 136, 13–24. https://doi.org/10.1016/j.compag.2017.02.015
- Balduzzi, F., Bianchini, A., Ferrara, G., & Ferrari, L. (2016). Dimensionless numbers for the assessment of mesh and timestep requirements in CFD simulations of wind turbines. Energy, 97, 246–261. https://doi.org/10.1016/j.energy.2015.12.111
- Beukeman, K. J. (1980). Heat and mass transfer during cooling and storage of agricultural products as influenced by natural convection. Food and Agriculture Organization of the united Nations, (897).
- Cherono, K., Sibomana, M., & Workneh, T. S. (2018). Effect of infield handling conditions and time to pre-cooling on the shelf-life and quality of tomatoes. Brazilian Journal of Food Technology, 21. https://doi.org/10.1590/1981-6723.01617
- Clément , V., James, T., & Stefanie, W. (2009). Designing container for handling fresh horticultural produce. Postharvest Technologies for Horticultural Crops, 2(2), 25–47. 978-81-308-0356-2.
- Couto. (2018). Coupled CFD-response surface method (RSM) methodology for optimizing jettability operating conditions. ChemEngineering, 2(4), 1–19. https://doi.org/10.3390/chemengineering2040051
- Crespo, J., Aira, J., Vázquez, C., & Guaita, M. (2017). Measured via conventional, ultrasound, and 3-D digital image correlation methods in eucalyptus globulus. Bioresources, 12(2), 3728–3743. https://doi.org/10.15376/biores.12.2.3728-3743
- De Castro, L. R., Vigneault, C., & Cortez, L. A. B. (2004). Effect of container opening area on air distribution during precooling of horticultural produce. Transactions of the American Society of Agricultural Engineers, 47(6), 2033–2038. https://doi.org/10.13031/2013.17792
- De Castro, L. R., Vigneault, C., & Cortez, L. A. B. (2005). Effect of container openings and airflow rate on energy required for forced-air cooling of horticultural produce. Canadian Biosystems Engineering/Le Genie Des Biosystems Au Canada, 47, 1–9. https://doi.org/10.13031/2013.19608
- Defraeye, T., Cronjé, P., Berry, T., Opara, U. L., East, A., Hertog, M., Verboven, P., & Nicolai, B. (2015). Towards integrated performance evaluation of future packaging for fresh produce in the cold chain. Trends in Food Science & Technology, 44(2), 201–225. https://doi.org/10.1016/j.tifs.2015.04.008
- Defraeye, T., Lambrecht, R., Ambaw, A., Admasu, M., Linus, U., Cronjé, P., Verboven, P., & Nicolai, B. (2013). Forced-convective cooling of citrus fruit: Package design. Journal of Food Engineering, 118(1), 8–18. https://doi.org/10.1016/j.jfoodeng.2013.03.026
- Dehghannya, J., Ngadi, M., & Vigneault, C. (2011). Abbreviations. Food Control. https://doi.org/10.1016/j.foodcont.2011.02.019
- Dehghannya, J., Ngadi, M., & Vigneault, C. (2012). Transport phenomena modelling during produce cooling for optimal package design: Thermal sensitivity analysis. Biosystems Engineering, 111(3), 315–324. https://doi.org/10.1016/j.biosystemseng.2012.01.001
- Delele, M. A., Ngcobo, M. E. K., Getahun, S. T., Chen, L., Mellmann, J., & Opara, U. L. (2013). Studying airflow and heat transfer characteristics of a horticultural produce packaging system using a 3-D CFD model. Part II: Effect of package design. Postharvest Biology and Technology, 86, 546–555. https://doi.org/10.1016/j.postharvbio.2013.08.015
- Delele, M. A., Tijskens, E., Atalay, Y. T., Ho, Q. T., Ramon, H., Nicolaï, B. M., & Verboven, P. (2008). Author ’ s personal copy Combined discrete element and CFD modelling of airflow through random stacking of horticultural products in vented boxes. Journal of Food Engineering, 89(1), 33–41. https://doi.org/10.1016/j.jfoodeng.2008.03.026
- Delele, M. A., Verboven, P., Ho, Q. T., & Nicolaï, B. M. (2010). Advances in mathematical modelling of postharvest refrigeration processes. Stewart Postharvest Review, 6(2), 1–8. https://doi.org/10.2212/spr.2010.2.1
- Elansari, A. M., & Mostafa, Y. S. (2020). Vertical forced air pre-cooling of orange fruits on bin: Effect of fruit size, air direction, and air velocity. Journal of the Saudi Society of Agricultural Sciences, 19(1), 92–98. https://doi.org/10.1016/j.jssas.2018.06.006
- Fadiji, T., Ambaw, A., Coetzee, C. J., Berry, T. M., & Opara, U. L. (2018). Application of finite element analysis to predict the mechanical strength of ventilated corrugated paperboard packaging for handling fresh produce. Biosystems Engineering, 174, 260–281. https://doi.org/10.1016/j.biosystemseng.2018.07.014
- Fadiji, T., Coetzee, J., Berry, T. M., Ambaw, A., & Opara, U. L. (2018). ScienceDirect the efficacy of finite element analysis (FEA) as a design tool for food packaging : A review. https://doi.org/10.1016/j.biosystemseng.2018.06.015
- Ferrua, M. J., & Singh, R. P. (2007). Modeling airflow through vented packages containing horticultural products. Computational Fluid Dynamics in Food Processing, 649–696. https://doi.org/10.1201/9781420009217.ch27
- Ghiloufi, Z., & Khir, T. (2019a). CFD modeling and optimization of pre-cooling conditions in a cold room located in the South of Tunisia and filled with dates. Journal of Food Science and Technology, 56(8), 3668–3676. https://doi.org/10.1007/s13197-019-103812-8
- Ghiloufi, Z., & Khir, T. (2019b). CFD modeling and optimization of pre-cooling conditions in a cold room located in the South of Tunisia and filled with dates. Journal of Food Science and Technology, 56(8), 3668–3676. https://doi.org/10.1007/s13197-019-03812-8
- Gutu, T. (2013). A study on the mechanical strength properties of bamboo to enhance its diversification on its utilization. International Journal of Innovative Technology and Exploring Engineering (IJITEE), 2(5), 314–319. .
- Han, J. W., Zhao, C. J., Qian, J. P., Ruiz-Garcia, L., & Zhang, X. (2018). Numerical modeling of forced-air cooling of palletized apple: Integral evaluation of cooling efficiency. International Journal of Refrigeration, 89, 131–141. https://doi.org/10.1016/j.ijrefrig.2018.02.012
- Huang, P., Zeidler, A., Chang, W. S., Ansell, M. P., Chew, Y. M. J., & Shea, A. (2016). Specific heat capacity measurement of Phyllostachys edulis (Moso bamboo) by differential scanning calorimetry. Construction and Building Materials, 125, 821–831. https://doi.org/10.1016/j.conbuildmat.2016.08.103
- Ibarz, A., & Barbosa-Canovas, G. V. (2020). Thermal properties of food. Unit Operations in Food Engineering, (1986). https://doi.org/10.1201/9781420012620-14
- ISO 527-2. (2003). International Standard International Standard. In 61010-1 © IEC:2001 (Third, Vol. 2003). www.iso.org
- Jalal, D., Michael , N., & Clement, V. (2010). Mathematical modeling procedures for airflow, heat and mass transfer during forced convection cooling of produce: A Review. Food Engineering Reviews, 2, 227–243. https://doi.org/10.1007/s12393-010-9027-z
- Kitazawa, H., Funaki, T., Nakao, M., Ohshiro, Y., Hiruta, M., & Ishikawa, Y. (2012). Air flow visualization for fresh produce packaging by CFD analysis. Food Science and Technology Research, 18(4), 525–534. https://doi.org/10.3136/fstr.18.525
- Kitinoja, L. (2013). Use of cold chains for reducing food losses in developing countries. PEF White Paper, 6(13), 1–16.
- Kumar, A., & Sharma, R. (2020). Multi-response optimization of magnetic field assisted EDM through desirability function using response surface methodology. Journal of the Mechanical Behavior of Materials, 29(1), 19–35. https://doi.org/10.1515/jmbm-2020-0003
- Lee, Lee, M., Park, G., Park, C., & Kim, C. (2020). Improvement of grid independence test for computational fluid dynamics model of building based on grid resolution. Advances in Civil Engineering, 2020, 2020. https://doi.org/10.1155/2020/8827936
- Li, X. (2004). Physical, chemical, and mechanical properties of bamboo and its utilization potential for fiberboard manufacturing. Louisiana State University and Agricultural & Mechanical College Thesis Dissertations, 1–68.
- Mason, P. E., Darvell, L. I., Jones, J. M., & Williams, A. (2016). Comparative study of the thermal conductivity of solid biomass fuels. Energy & Fuels, 30(3), 2158–2163. https://doi.org/10.1021/acs.energyfuels.5b02261
- Mekonen, T. N., Delele, M. A., & Molla, S. W. (2023). Development and Testing of solar powered evaporative air-cooling system with an improved performance development and testing of solar powered evaporative air-cooling system with an improved performance. Cogent Engineering, 10(1). https://doi.org/10.1080/23311916.2023.2178115
- Mennad, A., & Khan, N. U. (2018). A computational and experimental investigation of airflow and heat transfer through improved horticultural produce-crates. 2018 Advances in Science and Engineering Technology International Conferences, ASET 2018, 1–8. https://doi.org/10.1109/ICASET.2018.8376858
- Mukama, M., Ambaw, A., & Opara, U. L. (2020). Advances in design and performance evaluation of fresh fruit ventilated distribution packaging: A review. Food Packaging and Shelf Life, 24, 100472. (October 2019). https://doi.org/10.1016/j.fpsl.2020.100472
- Mulatu, Y., Alemayehu, A., & Tadesse, Z. (2016). Bamboo species introduction in ethiopia. Ethiopian Environment and Forest Research Institute, 1–75.
- Pandiaraj, S., Velkennedy, R., & Nagan, S. (2016). Finite element analysis of synergy effect on concrete beams incorporated with coated reinforcement and alternate aggregates. Advances in Materials Science and Engineering, 2016. https://doi.org/10.1155/2016/1524540
- Pathare, P. B., & Opara, U. L. (2014). Structural design of corrugated boxes for horticultural produce: A review. Biosystems Engineering, 125, 128–140. https://doi.org/10.1016/j.biosystemseng.2014.06.021
- Rijkenbarg, H. (1986). Product data of tomatoes. Sprenger Instituut, 1–89. .
- Seyed, S., Younes, M., & Amir, R. (2013). A Multi-scale three-dimensional CFD model of a full loaded cool storage. International Journal of Food Engineering, 9(2), 163–178. https://doi.org/10.1515/ijfe-2012-0015
- Shah, D. U., Bock, M. C. D., Mulligan, H., & Ramage, M. H. (2016). Thermal conductivity of engineered bamboo composites. Journal of Materials Science, 51(6), 2991–3002. https://doi.org/10.1007/s10853-015-9610-z
- Takeuchi, C. P., Estrada, M., & Linero, D. L. (2016). The elastic modulus and poisson’s ratio of laminated bamboo guadua angustifolia. Key Engineering Materials, 668(October), 126–133. https://doi.org/10.4028/www.scientific.net/KEM.668.126
- Talib. (2015). Packaging technology. Fundamentals of Packaging Technology Packaging.
- Trahana, J., Grazianib, A., Goswamia, D. Y., Stefanakosa, E., Jotshia, C., & Goelc, N. (2014). Evaluation of pressure drop and particle sphericity for an air-rock bed thermal energy storage system. Energy Procedia, 57, 633–642. https://doi.org/10.1016/j.egypro.2014.10.218
- Vigneault, C., & Goyette, B. (2003). Effect of tapered wall container on forced-air circulation system. Canadian Biosystems Engineering/Le Genie Des Biosystems Au Canada, 45(335), 6–9.
- Wentao, W. (2018). Virtual cold chain to model the postharvest thermal history and quality evolution of fresh fruit. Computers and Electronics in Agriculture, 41(144), 199–208.
- Yasin, I., & Priyanto, A. (2019). Analysis of bamboo mechanical properties as construction eco-friendly materials to minimizing global warming effect. IOP Conference Series: Materials Science and Engineering, 535 (1). https://doi.org/10.1088/1757-899X/535/1/012001
- Zhao, C. J., Han, J. W., Yang, X. T., Qian, J. P., & Fan, B. L. (2016). A review of computational fluid dynamics for forced-air cooling process. Applied Energy, 168, 314–331. https://doi.org/10.1016/j.apenergy.2016.01.101