
 ?Mathematical formulae have been encoded as MathML and are displayed in this HTML version using MathJax in order to improve their display. Uncheck the box to turn MathJax off. This feature requires Javascript. Click on a formula to zoom.
Abstract
Child poverty is widespread and anticipated to endure in the future, particularly in developing countries. By 2030, it is predicted that a considerable number of children would be living in poverty. As a result, addressing child poverty is a top priority for researchers and politicians today. The objective of this study is to examine and measure the factors that contribute to child poverty in the Negele Arsi woreda, West Arsi Zone, Oromia Regional State. Based on probability proportionate to size, multistage sampling procedures were employed to pick 401 respondents from four kebeles. The data for this study was gathered using enumerator-administered interview schedules. The data were analyzed using descriptive statistics techniques, and the causes of child poverty were analyzed using a probit regression model. The multidimensional poverty assessment method was utilized to assess child poverty based on several indicators. As a result, the total multidimensional child poverty analysis found that around 80 percent of children in the study area were multidimensionally poor. Multidimensional poverty was found to be highly affected by factors such as household socioeconomic status, the age of the household head, and household wealth status. Similarly, nutrition, education, information, shelter, income, and fuel are all intimately tied to children’s requirements.
1. Introduction
Child poverty is a significant issue that affects a considerable number of children globally. According to the African Charter on the Rights and Welfare of the Child (1990), the Convention on the Rights of the Child 1989, and the Ethiopia Revised Family Code 2002, a child is defined as “every human being below the age of 18 years.” In Ethiopia, children constitute approximately 52% of the population, yet they face several challenges in accessing better standards of life due to discrimination based on sex, language, religion, social origin, or social and property status (Alemu, Citation2009).
To address this issue, the Ethiopian government has ratified international human rights instruments protecting children’s rights, including the Convention on the Rights of the Child and the African Charter on the Rights and Welfare of the Child (UNICEF, Citation2018). However, child poverty remains persistent in Ethiopia, and it is estimated that 304.7 million sub-Saharan African children (aged 0–19) will be living in extreme poverty in 2030 (UNICEF, Citation2018). These children will account for 55% of world poverty in 2030, compared with 43% in 2018 and over three times the share in 2000 (Watkins & Quattri, Citation2016).
Multiple factors affect child poverty, including education, health, shelter, food, safe drinking water, sanitation facilities, information, and access to services. Household income is also among the significant factors affecting child poverty. Several theories have been advanced for why income might influence the development and later outcomes of children, such as “Investment” theories, “Parental stress” theories, and the “role-model” theory. However, Mayer (Citation1997) argued that parental income is not important to children’s outcomes, but the parental willingness to pay for children’s needs like skills, diligence, honesty, good health, and reliability determines the children’s future outcomes.
Studies on child poverty show that severe or extreme poverty can cause children permanent damage physically and mentally, stunt and distort their development, and destroy opportunities for fulfillment, including the roles they are expected to play successively as they get older in family, community, and society (Gordon et al., Citation2003). Similarly, some other scholars have also argued that poor children are more likely to have worse adult outcomes than non-poor children (Duncan et al., Citation1998; Oshio et al., Citation2009; Ratcliffe & Signe-Mary, Citation2010). Child poverty has long-term effects, which can lower success in the labor market compared to non-poor children (Gregg & Machin, Citation1998). Therefore, assessing, identifying, and addressing the potential causes of child poverty and investing in child poverty reduction would result in tackling intergenerational poverty.
In Ethiopia, poverty remains a pervasive issue, particularly child poverty, which is unacceptably high. The majority of children in Ethiopia are multidimensionally poor, as empirical evidence suggests. According to CSA et al. (Citation2015), child monetary poverty in equivalent scale is 32.4%, while multidimensional child poverty rate is 87.5% (UNDP and OPHI, Citation2019). These rates are higher than the corresponding rates at the household level, which are 23.5% and 83.5%, respectively (NPC, Citation2017; UNDP and OPHI, Citation2019; as cited in Yirga Belete, Citation2022. In Oromia, child poverty rates are particularly high, with approximately 2.1 million children under the age of five stunted, 1.2 million underweight, and half a million wasted Desta, . A study conducted in a neighboring district to the current study also found that indicators of child poverty, such as stunting and wasting, were higher (Desta,).
Although there is a global agreement on the reduction of child poverty, there is no recorded evidence on the state and causes of child poverty in the Negele Arsi woreda, West Arsi Zone, Oromia Region State. Therefore, the aim of this study is to investigate and measure the factors that contribute to child poverty in this specific area. The study will provide important insights into the state of child poverty in the Negele Arsi woreda and contribute to the development of effective policies and interventions to reduce child poverty in the region.
Child poverty has serious and far-reaching consequences, both for the children themselves and for society as a whole. Children who grow up in poverty are at a higher risk of poor health outcomes, including malnutrition, stunted growth, and infectious diseases. They are also more likely to drop out of school, experience social exclusion, and become trapped in a cycle of poverty that can last for generations. Therefore, it is crucial to understand the state and causes of child poverty in specific areas like the Negele Arsi woreda to design effective policies and interventions to combat child poverty. By conducting this study, we can identify the factors that contribute to child poverty in the area and develop targeted strategies to reduce child poverty rates, improve children’s health and well-being, and promote their long-term development.
2. Materials and methods
2.1. Data sources
Data needed to analyze child poverty was collected from sampled households based on multidimensional poverty indicators. Accordingly, the indicators used for this study are education, information, health, nutrition, housing (shelter), water, sanitation, fuel and energy, and household income. Sample households were interviewed about their children based on the indicators developed to assess child poverty.
2.2. Sampling techniques and sample size determination
A multistage sampling technique was used to select sample respondents. In the first stage, the Arsi Negele woreda among woredas in the West Arsi Zone was selected purposively based on convenience to access relevant data and the researcher’s experience; in the second stage, stratified random sampling techniques were used to select kebeles. Kebeles were stratified based on the nature of livelihood activities (diversification options). Finally, from each stratified kebeles sample households were randomly selected. The sample size is determined based on Yamane’s formula of sample size determination (Yamane, Citation1967). The formula can be written as;
Where N is the population size, and e is the level of precision. The population of the woreda is 394,020. Taking the “e” the level of precision to be 5%, the total sample size will be 400. However, in our study the sample size is 401. One more questionnaire was distributed to an enumerator, and since the minimum representative sample as per the calculation was 400, and one more additional sample will not have a significant effect on estimation, we didn’t drop it from the sample.
2.3. Methods of data analysis
The multidimensional poverty measurement approach was used to analyze child poverty. The multidimensional deprivation headcount measures the number of children deprived, depending on the chosen cut-off point to identify the deprived. A child i is considered deprived if the number of dimensions in which he/she is deprived (Di) is equal to or greater than the cut-off point K. This can be specified as follows:
The multidimensional child deprivation headcount ratio is calculated as follows:
Where,
= number of children affected by at least K deprivations;
n = total number of children included in the analysis;
= deprivation status of a child i depending on the cut-off point K;
Di = number of deprivations each child i experiences;
K = cut-off point.
Accordingly, the child poverty status was represented as 1 if a child was deprived of multiple indicators and 0 otherwise.
In this study, about eight dimensions with some indicators were used to estimate the multidimensional child poverty. These dimensions are nutrition, health, education, information, shelter, water and sanitation, fuel and energy, and income. Deprivation index was constructed for each dimension using selected indicators (see Annex 1 for indicators and possible explanations). The number of dimensions for which each child suffers from deprivation is then summarized in a “deprivation count”. Atkinson (Citation2003) labeled “counting approach” to multidimensional deprivation the analysis of the distribution of the “deprivation count” across the population. Accordingly, multidimensional child poverty was specified following Oxford Poverty and Human Development Initiative (Citation2017). A child is identified as multidimensionally poor if he/she is deprived in at least one third of the weighted indicators; in other words, the cutoff for poverty (k) is 33.33%.
The multiple overlapping deprivation analysis (MODA) method with a life-stage approach was used to capture child poverty across age groups. Basically, MODA has various approaches to multidimensional child poverty assessments. These are child-centered approach, life-stage approach, deprivation overlaps approach, combined deprivation and monetary poverty analysis approach, flexible methodologies approach, and child deprivation profiles approach. In current study, we focus on the life-stage approach which is commonly used when the aim is to capture child age-specific needs as indicators to assess child poverty (UNICEF Ethiopia and Central Statistical Agency of Ethiopia, Citation2016). Child poverty is complex and difficult to measure with a similar approach to adult poverty. According to the right-based approach, child poverty is defined as the non-fulfillment of children’s rights to survival, development, protection, and participation as anchored in the Convention on the Rights of the Child. While child needs vary across ages, disaggregating and capturing poverty status across age groups is very crucial. To address this concern, the multiple overlapping deprivation analysis (MODA) technique is the relevant approach. Therefore, this study adopted the MODA approach to analyze child poverty. According to the multidimensional poverty measurement approach, child poverty indicators include nutrition, health, education, information, shelter, water, and sanitation. Additionally, income is also included as one of the child poverty indicators in this study.
Child poverty indicators were described using descriptive statistics such as mean, standard deviation, and percentage. A Probit regression model was used to analyze the determinants of child poverty. The model is specified in detail as follows:
In the linear probability model, which is one of the qualitative preference models with qualitative variables that can take two values, the most obvious problem is that the predicted probability values fall outside the range of “0” and “1”. Therefore, the probit model is used to solve this problem. A probit model is a nonlinear model in terms of coefficients that allow the probabilities to remain between “0” and “1”. When the dependent variable yi is binary, pi is expressed:
Here is the cumulative distribution function and β maximum likelihood coefficients of the standard normal distribution. The probit model assumes that the basic dependent variable is normally distributed, whereas the y dependent variable assumes that the variable is based on the logistic curve. Therefore, the tail regions of the logit cumulative distribution function of these two models are wider than those of the probit model. Although these two models give similar results, it is not possible to directly compare the predicted main mass coefficients of the two models.
3. Research results
3.1. Status of child poverty
3.1.1. Multidimensional child poverty status
Child poverty is measured using the counting approach to deprivation. Accordingly, the number of dimensions in which children were deprived was counted, and the child poverty status was coded as 1 if a child was multidimensionally poor, and otherwise 0. Following Alkire and Foster (Citation2015), the number of dimensions children were deprived of was counted, and using a poverty threshold of two, it was discovered that children from 80% of sampled households were multidimensionally poor (MD Poor). On the other hand, about 20% of sample households’ children were multidimensionally non-poor (MD Non-Poor) (see Table below). Multidimensional child poverty is significantly high in Ethiopia. A jointly conducted study with relevant government partners like CSA, UNICEF and OPM during 2015, reveals that 88 per cent or 36.2 million children are multidimensionally poor in Ethiopia, defined as a headcount of children deprived in at least three or more dimensions in the fulfillment of their rights or needs for basic food or services (UNICEF and CSA, Citation2018).
Table 1. Multidimensional child poverty status
To capture child poverty across age categories, the multiple overlapping deprivation indexes were computed. This approach was selected because indicators of children under age five and children between 6 and 18 partly differ and are partly the same. Accordingly, indicators like shelter, water and sanitation, and income are common for all age categories of children. Nutrition and health indicators are specific to children under the age of five while education and information are only applicable to children aged between 6 and 18 ages. In this study, it is defined that children are human beings under the age of 18 regardless of their sex. The following sections give detailed descriptions of factors related to child poverty and the analytical results.
In this study, we classified factors affecting child poverty into two categories. The first category is about factors related to the household head (parent); while the second category covers all factors directly related to children’s needs. Household-related factors are the age of the household head, sex of the household head, livelihood strategies of the household head, marital status, education status, health status of the household head, and household income. On the other hand, factors directly related to children’s needs were identified following the human rights-based approach as reported by (Minujín et al., Citation2006). Accordingly, about seven indicators related to child needs were taken to assess child poverty in the study area. These are nutrition, health, education, information water and sanitation, shelter, and energy.
3.2. The descriptive results of child poverty determinants
3.2.1. Household head demographic characteristics and child poverty
Some scholars have reported that parental socioeconomic and demographic characteristics have an imperative relationship with child poverty (Bradbury & Jantti, Citation2001; Chen & Corak, Citation2008; Gornick & Jantti, Citation2012). The sex of the household head is one of the important demographic factors determining child poverty in the study area. From the survey assessment, it is identified that the majority of household heads are males. Of the 401 sampled households, 350 households are male-headed. Child poverty is assessed and a comparison was made across household headship. Accordingly, multidimensional poverty was observed in male-headed households to be higher. About 82% of multidimensionally poor children are from male-headed households. On the other hand, the majority of multidimensionally non-poor children are identified as coming from female-headed households. The chi-squared result also shows that there is statistically a significant (χ2 = 3.483; p = 0.062) association between child poverty and the sex of household heads in the study area. This result has a similarity to Birhanu et al. (Citation2017), which identified that multidimensionally poor children are higher in male-headed households than in female-headed households.
Moreover, the sex of a household head is taken as one of the important factors assumed to affect child poverty in the study area for different reasons. In this study, it is assumed that due to gender-related roles female-headed households are considered to better take care of their children compared to male-headed households. The descriptive statistics results from the above table also revealed that children of female-headed households are slightly better off than children of male-headed households. For example, multidimensional child poverty is higher (82%>71%) for male-headed households than for female-headed households. On the other hand, non-poor children are higher (29%>18%) in female-headed households than in male-headed households.
Multidimensional child poverty is higher for household head age groups between 33 and 51 years, and relatively, lowers for household heads whose age is below 33 and above 51 years respectively. The result shows that the age of the household head and child poverty is significantly associated (χ2 = 17.802; p < 0.001).
Household education is among the important factors determining child poverty in the study area. Education plays a significant role in household welfare (Awan, Malik, Sarwar, and Waqas Citation2011). Educated household heads are more likely to invest in family welfare than illiterate household heads. Accordingly, the education of household heads was assessed in this study to identify its contribution to child poverty. The multidimensional child poverty is relatively higher for illiterate household heads compared to literate household heads. However, the chi-squared test result (p = 0.299) does not show a significant relationship between child poverty and household head education status.
The marital status for this study was assessed as single, married, divorced, and widow/er. The majority of sampled households are married, followed by divorce. The overall multidimensional child poverty rate is 80% (Table ); as the descriptive result from the table below shows, children of single-parent households have the highest multidimensional poverty rate, followed by married couples. Generally, multidimensional child poverty is high for all marital statuses. The chi-squared result (p = 0.580) shows that there is no significant association between child poverty and the marital status of the household head.
Table 2. Household head demographic characteristics and child poverty
As can be seen from the above table, children have attained little attention, and most families are less likely to invest in their children. Lack of proper care for children will affect their future healthy growth of children. Various reasons are identified to affect child well-being. According to the study conducted by Ma et al. (Citation2009), factors like family resources refer to the amount of time spent with family; actual household income and the efficacy of financial management; human capital such as parents’ educational attainment; psychological factors such as stress coping efficacy of parents; and social capital such as social support from friends and relatives affect child healthy growth.
The health status is categorized on a self-reported 1–5 scale: excellent, very good, good, fair and poor following (Wu, Citation2003) to understand the health condition of household head through the question “How could you state your health status?” Following the Drever et al. (Citation2004) “people are good judges of their own state of health”; we raised the question to each respondent to report their health condition. Poor health of household heads is found to be a critical determinant of child poverty. The results from the descriptive analysis showed that the incidence of child poverty varies across the health condition of household heads. The highest multidimensional child poverty was observed for the household head with poor health conditions (see Table ).
From the above table, we can see that the majority of household heads are in very good health condition. It is acceptable that household head health is very important for household welfare in general. The households where the head is the only breadwinner, any health problem is considered to be a vulnerable condition for the whole household members. Children are among the most vulnerable groups in households and need proper care. The result from the chi-squared test (p = 0.109) however didn’t show a significant association between household head health and child poverty in the study area.
3.2.2. Household socioeconomic characteristics and child poverty
Households in the study area are engaged in multiple livelihood activities to generate income. The fact is here that, numerous studies have recorded that off-farm activities increase household income, consumption, nutrition, and food security (Gautam & Andersen, Citation2016; Helmy, Citation2020; Khatiwada et al., Citation2017; Loison, Citation2015). In the study area, it was found that households’ participation in off-farm activities is very low. The contribution made by off-farm activities to the whole household income is low; the chi-squared result (p = 0.309) also shows that there is no significant association between household off-farm participation and child poverty.
The majority of households whose children are multidimensionally poor participate in agricultural laboring compared to those households whose children are multidimensionally non-poor (Table ). On the other hand, households with more multidimensionally non-poor children are less likely to participate in agricultural laboring. However, the chi-squared test result (1.984) revealed that there is no significant (p = 0.159) association between agricultural laboring and child poverty in the study area. Several studies show that off-farm activities have a significant contribution to household poverty reduction. According to some studies (B. Davis et al., Citation2017; Haggblade et al., Citation2010; Yeboah & Jayne, Citation2018), off-farm activities contribute about 35 percent of household income in sub-Saharan Africa.
Table 3. Household socioeconomic characteristics and child poverty
While off-farm activities are potential strategies for poverty reduction and consumption smoothening; this study finds that household participation in such activities is very low in the study area. A study by Sewnet Yizengaw et al. (Citation2015) has found that the level of rural household participation in off-farm activities is low, and only 36.5% of the sampled households participated in off-farm activities in their study area. The same study also reported that the overall income generated from off-farm activities is the lowest compared to on-farm and non-farm income. The majority of rural households are engaged in agricultural activities, but their growth is slow in Sub-Saharan Africa and couldn’t enable policymakers to easily attain poverty reduction goals. It is argued that policymakers have also to target off-farm activities for job creation and poverty reduction (ILO, Citation2008).
3.2.3. Household Socioeconomic and demographic determinants of child poverty
The following table shows us the household-related factors affecting child poverty in the study area. The mean age of household heads whose children are multidimensionally non-poor is 40.26, while the mean age of household heads whose children are multidimensionally poor is 41.7 respectively. The t-test result shows that there is no significant (p = 0.171) association between the age of household heads and multidimensional child poverty in the study area. The mean age difference of the household heads whose children are multidimensionally non-poor and poor, respectively, is±1.42. The result implies that the age of the household head has no significant effect on multidimensional child poverty in the study area.
Table 4. Household Socioeconomic and demographic determinants of child poverty
Household size is one of the demographic factors that vary across households. In a poverty study, assessing household size is crucial because the level of household expenditure is defined by the level of household well-being. It is argued that household composition is an important problem in measuring poverty. Therefore, converting the number of household members into adult equivalents gives a clear understanding of household well-being. Accordingly, household size was converted based on the age and sex of household members. The mean household size for households whose children are multidimensionally non-poor is 4.6139, while the mean household size for households whose children are multidimensionally poor is 4.3845. The t-test result shows that there is no significant mean difference in household size concerning multidimensional child poverty.
Land is an important asset to farming households, especially in rural contexts. Since agriculture dominates the livelihoods of rural areas, landholding is a crucial determinant of livelihood diversification. Research pointed out that small landholdings are a push factor for livelihood diversification, while large landholdings are a pull factor. For example, Hart (Citation1994) reported that larger landowners diversify to accumulate, while the landless and near landless diversify to survive. Hiremath (Citation2007) has also argued that small landholdings cannot satisfy households’ needs; hence, rural households tend to look for alternative livelihood opportunities. According to J. R. Davis (Citation2003) and Haggblade (Citation2007), small and poor land quality (poor fertility) is the push factor for rural households toward livelihood diversification. In this study, the total landholding is a continuous variable and is measured in hectares (ha). The maximum landholding is 9 ha and the minimum is 0.13 ha, respectively. The total landholding affects livelihood diversification, which in turn affects child poverty in the study area. From the t-test result (t = 2.574) we can understand that there is a significant (p = 0.010) mean difference (±0.355) in landholding among households whose children are multidimensionally poor and non-poor.
The number of plots of land owned at different locations is one of the important factors affecting on-farm diversification strategies. Rural households minimize farm-based risks by diversifying their farming at different locations. Owning some plots of land, especially in different agro-ecology and topography, helps farming communities minimize natural hazards like land sliding and flooding. In addition to diversifying risks, it provides opportunities to produce several crops, which necessarily improve household dietary requirements and market participation. In the study area, it was identified that sample respondents own a maximum of four and a minimum of one plot of land at different locations. The t-test result showed that there is no significant (p = 0.184) mean difference (±0.14) in plots of land owned at a different location about multidimensional child poverty.
On-farm income is income generated from activities undertaken on own account farm. These activities include crop production and livestock rearing activities that household practices on their farm. Therefore, the annual on-farm income is a summation of the overall income from on-farm activities. Accordingly, the maximum on-farm income in this study is 227,600 birr and the minimum is zero. This implies that some households are not dominantly relying on on-farm activities. Their major income sources are other livelihood activities other than on-farm activities. The result shows that there are no significant mean differences (±6,760.70) in household on-farm income whose children are multidimensionally non-poor and poor. The t-test result (t = −1.288; p = 0.199) shows that the mean income difference is not statistically significant.
Off-farm activities can be defined in different ways, and there is no clear demarcation between off-farm and non-farm activities. For example, Bryceson (Citation1999), as cited in Werede et al. (Citation2013), defined non-farm activity as comprising agricultural waged labor on farms not belonging to the individual producer or his/her household. On the other hand, J. R. Davis (Citation2003) defined non-farm activities as all rural economic activity other than agriculture that can take place at home or in factories or be implemented by traveling traders. From these two definitions, we can understand that non-farm activities are conceptualized differently than agricultural activities. In this study, we conceptualize off-farm activities as one of the farming activities one can undertake away from his/her farmland in different forms, like agricultural laboring (wage work in farming activities) and off-farm activities for harvest shares. Non-farm activities are primarily not farming activities (cultivation and livestock rearing), however, they can be selling agricultural products. Therefore, we adopt Ellis’s (Citation1998) definition to differentiate on-farm, off-farm and non-farm activities. According to Ellis (Citation1998), off-farm income is mainly referred to as a wage or exchange of labor in cash or in-kind away from one’s land within agriculture.
Annual off-farm income was the least income source in the study area compared to on-farm and non-farm income sources. The maximum income generated from this sector is about 78,500 birr per year. Some households are not generating income from this income source. The t-test result (t = 0.829; p = 0.408) shows that there is no significant mean difference (±823.46) in off-farm income between households whose children are multidimensionally non-poor and poor.
Non-farm activities are one of the important livelihood activities currently gaining attention from different bodies like development practitioners, researchers, and policymakers. It is also a potential strategy for poverty reduction in various developing countries. According to Haggblade et al. (Citation2002), a rural non-farm economy contributes about 35–40 percent of income in developing countries. This study has highlighted that except for on-farm activities, other livelihood activities are not practiced solely. Most households practice a combination of livelihood activities. Non-farm income sources identified in this study are petty trading, carpentry, charcoal making, different aids, and remittances. Any remittances and aids received either in the form of cash or in-kind were estimated to the equivalent monetary value by asking sample respondents during the data collection. Accordingly, the inferential test result (t = 4.536; p < 0.001) showed that there is a significant mean difference (±8,846.62) in non-farm income between households whose children are multidimensionally non-poor and poor.
Livestock production is one of the on-farm activities practiced in the study area. Livestock production is highly diversified, and the majority of sampled households practiced livestock rearing. The diversity ranges from large ruminants like cattle production to poultry production. It was identified that a household at least practices smallholder poultry production, if not cattle rearing. Livestock production serves different purposes for rural households in the study area. For example, most households produce oxen for draft power, a cow for milk (home consumption and marketing), sheep, and goats as liquid assets and marketing, poultry for household consumption, marketing, and donkeys and horses for transportation purposes. However, the inferential test result (t = 0.609; p = 0.543) showed that there is no significant mean difference (±0.334) in non-farm income between households whose children are multidimensionally non-poor and poor.
Household income can play a significant role in alleviating child poverty. But Mayer (Citation1997) argued that parental income is not important to children’s outcomes. This is because the parental willingness to pay for children’s needs like skills, diligence, honesty, good health, and reliability determines the children’s future outcomes.
From some empirical evidences, we can understand that income approach is not attractive to assess child poverty for several reasons. According to UNICEF Ethiopia and Central Statistical Agency (Citation2016) income approach has several shortcomings considering that children do not have control over households’ financial resources; that access to financial resources does not always translate into improvements in children’s well-being; and that there may be intra-household inequalities in resource allocation. The result from the above also does not show a significant relationship between household income and child poverty in the study area.
3.2.4. Factors related to children’s needs
Child poverty is a global challenge that all countries in the world face today. It is not limited only to developing countries but is also a problem in developed countries. Different studies show that child poverty is not happening only in third-world countries but also developed countries (Gordon et al., Citation2003; UNICEF, Citation2005). Indicators of child poverty are multiple and it is difficult to assess as well as measure. Poverty, in general, can be measured using either monetary or multidimensional approaches. In this study, we adopted the multidimensional approach to measure child poverty. Multiple indicators included in assessing child poverty are nutrition, education, information, housing, water and sanitation, energy, and income. Accordingly, an index was developed for each indicator, and child poverty was identified. The following section presents detailed explanations of each indicator based on analysis results.
Following Multiple Overlapping Deprivation Analysis (MODA), we categorize children into two age categories. The first category is children under the 5 age and the second is children aged between 6–18 years. This is because some indicators are only specific to a certain age group and some of them are common to all age categories. Therefore, to capture poverty status across age categories we applied MODA. Accordingly, the result for children under the age of 5 indicates that about 66% of children are multidimensionally poor (Table ).
Table 5. Multidimensional Poverty status of children under the age of 5
The result from the above table shows that the majority of children aged between 6 to 18 years are multidimensionally poor. The highest (89%) multidimensional child poverty is observed for children aged 6 to 18 years, as compared to children under age five.
3.2.5. Multidimensional poverty status of children under age 5
The following table presents the summary results of the dietary diversity assessment for child nutrition. Nutrition is among the indicators of child poverty assessment for children under five years of age. Child nutrition assessment can be done through four methods. These are anthropometric, biochemical (laboratory), clinical and dietary diversity methods.
The anthropometry method is used to assess child growth by applying several measurements, including length, height, weight; head circumference, mid-arm circumference, skin-fold thickness, head/chest ratio, and hip/waist ratio can be used. Height and weight measurements are essential in children to evaluate physical growth. The biochemical or laboratory methods of assessment include measuring a nutrient or its metabolite in the blood, feces, urine, or other tissues that have a relationship with the nutrient. In addition to the anthropometric assessments, a clinical method can be used to assess child nutrition, which can indicate a potential specific nutrient deficiency. Special attention is given to organs such as skin, eyes, tongue, ears, mouth, hair, nails, and gums. Clinical methods of assessing nutritional status also involve checking for signs of deficiency at specific places on the body or asking the patient whether they have any symptoms that might suggest nutrient deficiency. In the end, dietary methods can be used to assess child nutrition, which includes looking at past or current intakes of nutrients from the food by individuals or a group to determine their nutritional status.
This study adopted the dietary diversity method to assess child poverty. Several methods can be employed to assess child nutrition information. These are the 24-hour recall method, the food frequency method, the food intake record, and the observation of food consumed. In this study, we employed the seven-day recall method to get information on children’s dietary consumption.
3.2.6. Nutrition attainment and multidimensional child poverty
Dietary diversity is a qualitative measure of food consumption that reflects household access to a variety of foods and is also a proxy for the nutrient adequacy of the diet of individuals (FAO, Citation2013). Increased dietary diversity correlates with increased intake of micronutrients such as calcium, vitamin A, and iron with greater consumption of animal-source foods, fruits and vegetables, and dairy (Kennedy et al., Citation2010; Wiesmann et al., Citation2009). Gains in dietary diversity are associated with several improved health outcomes, including birth weight and child anthropometric status (Swindale & Bilinsky, Citation2006). The current study identified that grain as a source of food is one of the most common food sources relied on by most households in the study area. Hence, both multidimensionally non-poor and poor children are obtaining the majority of their food from this source. Grain and cereal food sources support more than 70% of child food needs. The chi-square test result (χ2 = 0.664; p = 0.415) showed that there is no significant association between multidimensional child poverty and food consumed from cereal sources in the study area. Another food type assessed to see child nutrition quality is the vitamin A-rich food group. The highest Vitamin A food supply deficiency was observed for multidimensionally poor children. About 68% of multidimensionally poor children were not getting food from vitamin A sources. On the other hand, about 43% of multidimensionally non-poor children had vitamin A during the survey period. The chi-squared test result (χ2 = 17.466; p < 0.001) also showed that there is a significant association between Vitamin A-rich fruits and vegetable consumption and child poverty in the study area.
Other fruits and vegetables are among the food groups that can provide carbohydrates. For the human body to properly function, carbohydrate-containing foods are crucial. Therefore, fruits and vegetables are highly preferred sources of energy. The percentage of children consuming other fruits and vegetables is higher for multidimensionally non-poor children than for the multidimensionally poor. The result indicates that other fruits and vegetables significantly contribute to child poverty reduction. The association between multidimensional child poverty and other fruits and vegetables is statistically significant (χ2 = 14.749; p < 0.001) at 1% probability. The result of this study has similarities with UNICEF (Citation2019) finding that has found other fruits and vegetables have a positive association with household dietary diversity.
In the dietary diversity assessment, food sources like meat, poultry, and fish were also included to address the quality and adequacy of food consumed by children during the period of the survey. It was identified that meat, poultry, and fish food sources are the least accessed by children in the study area. Very few (18%) multidimensionally poor children are getting their diets from these food sources, while a relatively higher proportion of multidimensionally non-poor children are getting their diets from the same food sources (see Table ). Another food source used by sample households to feed their children is eggs. As the descriptive result shows, the majority of multidimensionally non-poor children were getting eggs, while only some multidimensionally poor children were getting eggs in their diet. Pulses, legumes, and nuts are among the least consumed food groups by rural households in the study area. The overall percentage of the diet composed of pulses, legumes, and nuts is 22%, which is very low in the study area. When comparing multidimensionally poor and non-poor children concerning pulses, legumes, and nuts consumption, we can understand that there is no statistically significant difference in the percentage of pulses, legumes, and nuts dietary consumption in the study area. The chi-squared result (χ2 = 0.271; p = 0.602) also revealed that there is no significant association between multidimensional child poverty and pulses, legumes, and nut consumption.
Table 6. Child dietary intake status
Dietary diversity is the first indicator of diet quality and nutrient adequacy (Ruel, Citation2002), while the percentage of food energy acquired from staples and the number of individual foods consumed are placed in the second and third-order diet quality indicators, respectively (L. C. Smith & Subandoro, Citation2007). Milk and milk products are among the most recommended food groups for children. Both multidimensionally non-poor and poor children are acquiring better food supply from milk and milk products in the study area. The percentage of diet acquired from milk and milk products is higher (70%) for multidimensionally non-poor than for multidimensionally poor children (57%). The chi-squared test result (χ2 = 4.300; p = 0.038) indicates that there is a significant association between multidimensional child poverty and milk and milk product diet acquisition.
The percentage of oil consumption for cooking food is very high in the study area. It was found that households with multidimensionally non-poor and poor children are high-level consumers of oil. The overall oil consumption in cooking food is about 84%. The percentage of oil consumption for households with multidimensionally non-poor is nearly 96% and 81% for households whose children are multidimensionally poor. The chi-squared test result (χ2 = 11.159; p = 0.001) revealed that there is a significant association between cooking oil consumption and multidimensional poverty.
3.2.7. Child health indicators and multidimensional child poverty
Health is the most affecting factor in a child’s future. Poor health, even when not resulting in chronic conditions, can have long-term consequences, and impacts children’s ability to play and learn (UNICEF, Citation2017). Health interventions (such as vaccination programs) are the most important factor in reducing child mortality and improving health outcomes (John et al., Citation2009). This study considered factors like skilled health attendants and vaccinations to assess the health aspects of child poverty. The overall mother’s attendance at antenatal care is about 75%. Mother attendance at antenatal care for multidimensionally non-poor is 94% while it is 71% for multidimensionally poor children in the study area. The variation between multidimensionally non-poor and poor children in getting skilled birth is significantly high. The chi-squared test result (χ2 = 17.835; p < 0.001) also revealed a significant relationship between mothers’ attendance at antenatal care and multidimensional child poverty.
Child immunization is significantly higher for multidimensionally non-poor children compared to multidimensionally poor. In general, most children have been vaccinated in the study of both measles and BCG vaccines. The overall measles vaccination indicated that about 74% of children were vaccinated. Similarly, about 73% of children are vaccinated by BCG. The chi-squared results for two types of vaccinations indicated that there is a significant association between child immunization and multidimensional poverty in the study area (Table ).
Table 7. Health-related indicators of child poverty
A relatively low level of child deprivation is observed concerning health aspects in the study area. This is mainly because the health care provider has improved dramatically with the health extension service and the development of community-based health insurance (Alula et al., Citation2018). The interventions on community health have had a significant impact on child health in the country in general and in the study area in particular. However, there is still a huge gap in access to vaccination for multidimensionally poor children in the study area. At the same time, numerous children were born to unskilled health attendants.
3.2.8. Multidimensional poverty among children ages 6–18 years
The following section describes the multidimensional poverty of children aged between 6–18 years in detail. Two broad indicators, namely education and information were taken to assess child deprivation. For most indicators, there is a significant variation in deprivation between multidimensionally non-poor and poor children in the study area (Table ). Education was assessed in terms of attendance and completion of primary schooling for children aged between 5–14 years of age. Overall primary education attendance is about 68% in the study area, and about 32% of children from sampled households are not attending primary education. By differentiating the school attendance into non-poor and poor children, we can see that multidimensionally poor children are more likely to attend primary school than non-poor children are; however, the difference is not statistically significant (χ2 = 2.090; p = 0.148). Contrarily, the difference in the percentage of children completing primary school at the age of 14 is significantly (χ2 = 39.107; p < 0.001) higher for multidimensionally poor children than for non-poor children. The observed result is contrary to the prior hypothesis, and it needs further investigation to know why multidimensionally poor children have attained schooling in the study area.
Table 8. Multidimensional poverty status of children aged between 6–18 years
Radio is one of the potential sources of information for the rural community, especially in locations where there is access to electricity. It is also easy to operate with minimum skill and can be accessed for a low price. Relevant agricultural information, market information, and weather condition information which are highly demanded by the agrarian community can be accessed from a radio. For children, radio can transmit some educational programs which can improve their knowledge. By attending question-and-answer contest programs some students update their knowledge which would widen their education understanding. Therefore, accessing radio has significant importance to children at the age of schooling. In the study area, it was found that the overall access to radio is nearly 74% implying accessing radio is relatively easier. About 76% of multidimensionally non-poor children have access to the radio while 73% of multidimensionally poor children have access to the radio in the study area. The variation in access to radio by multidimensionally non-poor and multidimensionally poor children is reasonably low and the chi-squared test result showed that there is no significant (χ2 = 0.232; p = 0.630) association between child poverty and access to radio services.
In the study area, about 34% of multidimensionally non-poor and 11% of multidimensionally poor children have access to television. The overall access to television indicated that only 18% of children have access to television in the study area. There is poor access to television as an information source for children aged between 6–18 years. Access to television showed significant variation between multidimensionally non-poor and poor children. The chi-squared result (χ2 = 33.017; p < 0.001) indicated that access to television has a significant association with multidimensional child poverty. Multidimensionally non-poor children are more likely to have access to television than multidimensionally poor children.
There is a big difference in access to mobile phone services between multidimensionally non-poor and poor children in the study area. The majority (72%) of multidimensionally non-poor children have access to mobile phones compared to multidimensionally poor children. About 54% of multidimensionally poor children have no access to mobile phones. Mobile phones can bring multiple utilities as means of communication, and sources of information (FM radios, internet services, social Media connectivity). Those children who have access to a mobile phone are relatively getting a lot of information relevant to their needs. Overall, 49% of children aged between 6–18 years are deprived of information from mobile phone sources. In Ethiopia deprivation of information is identified to be very high. CSA and UNICEF Ethiopia (Citation2018) have identified that the overall deprivation of information and participation for children aged 5–17 years is 66%.
Lack of access to a computer as a source of information is common for both multidimensionally non-poor and multidimensionally poor children in the study area. Very few children are currently having access to computer services to get relevant information. The overall lack of access to a computer as the source of information is about 98%, implying that this amount of percentage of children is deprived of the lack of access to information from computers and internet services. The result showed us that there is only a slight difference between multidimensionally non-poor and multidimensionally poor children accessing information from computer centers. The observed difference is also not statistically significant.
3.2.9. Multidimensional child poverty indicators for all age groups
The multiple overlapping deprivation analysis (MODA) gives us clear indicators applied to children of all age groups. Some of the indicators that are relevant to all age groups are access to improved water, access to flush toilets, access to electricity, and the types of materials used to build a house. These are also indicators of living standards that indicate the well-being of children and households in general. Moreover, MODA enables us to select a child, rather than the household, as a unit of analysis, since poverty may affect children and adults differently.
The following table shows us the deprivation status of children in each indicator. According to WHO (Citation2008), improved water sources include public standpipes, boreholes, protected dug wells, protected springs, and rainwater collections. In the study area, the public standpipes are the most common and available in all kebeles of the study area. The overall access to improved water sources is high and nearly 85%. By disaggregating this to multidimensionally child poverty status, we can see that there is statistically a significant (χ2 = 8.138; p = 0.004) association between access to improved water sources and multidimensional child poverty in the study area. Looking into access to flush toilets, about 33% of children in the study area are deprived. Comparing multidimensionally non-poor children with multidimensionally poor children, we can see from the result that multidimensionally non-poor children are less likely deprived of access to flush toilets than multidimensionally poor children do. The chi-squared result showed that it is a statistically significant (χ2 = 38.284; p < 0.001) association between access to flush toilets and multidimensional child poverty in the study area.
Table 9. Multidimensional child poverty indicators for all age groups
Accessing electricity is a critical problem in the study area. The overall access to electricity is 48% for sampled households in the area. About 65% of multidimensionally poor children have no access to electricity, while only 3% of multidimensionally non-poor children have no access to electricity. Even though there is considerable positive progress in reducing multidimensional poverty indicators in Ethiopia, Alula et al. (Citation2018) reported that access to electricity in rural sites lags considerably behind. The chi-squared test result also showed that there is a significant (χ2 = 97.963; p < 0.0001) association between access to electricity and multidimensional child poverty. Children’s deprivation in housing conditions is relatively low. The percentage of multidimensionally poor children living in a house built of mud, and wood is 73%, while it is 48% for multidimensionally non-poor children. There is a significant difference in living conditions between multidimensionally non-poor and multidimensionally poor children. The chi-squared test result also confirmed that there is a significant (χ2 = 17.549; p < 0.0001) association between living in better housing conditions and multidimensional child poverty.
A child is to be deprived of cooking fuel if the household cooks or prepares meals with dung wood or charcoal (Table ). Accordingly, the analysis results showed that the majority of children were deprived of cooking fuel. Wood is the most common cooking fuel, contributing about 83% of the total cooking energy demand. Almost all children are deprived of cooking fuel in the area. The chi-squared result showed that there is a statistically significant (χ2 = 21.602; p < 0.001) association between cooking fuel energy needs and multidimensional poverty.
Table 10. Fuel used for cooking food
In addition to the materials used to construct a house, the availability of sufficient rooms for household members is also an indicator of housing conditions. On average, about 4 multidimensionally poor children share a room, while about 3 multidimensionally non-poor children share a room on average. The t-test result (t = −3.746; p < 0.0001) indicates that there is a significant mean difference (±0.64) in the number of children sharing rooms between multidimensionally non-poor and multidimensionally poor children in the study area (Table ).
Table 11. Housing condition and access to protected water
In rural areas, the proportion of housing units having access to safe drinking water has increased from 25.2% in 2004 to 66.54% in 2012/2013 (FDRE, Citation2000). However, UNICEF’s (Citation2018) report showed that low rates of access to improved water and sanitation sources impede efforts to achieve goals such as reducing wasting, stunting, and child mortality in Ethiopia. Children and women are among the responsible household members collecting water mainly in rural Ethiopia. Since safe drinking water sources are not available adjacently, they have to travel long distances for long minutes to collect water. In the study area, multidimensionally non-poor children are traveling on average 17 minutes single tripe while multidimensionally poor children are traveling 19 minutes on average respectively to get water in single tripe. Considering the amount of time that can be consumed to get drinking water including the time that they spend in ordinary waiting, we can understand that getting water in the study area is an exhaustive task. However, the t-test result (t = −1.266; p = 0.206) does not indicate a significant mean difference (±1.83) in travel minutes between multidimensionally non-poor and multidimensionally poor children to fetch drinking water in the study area.
3.3.10. The share of each indicator to child poverty
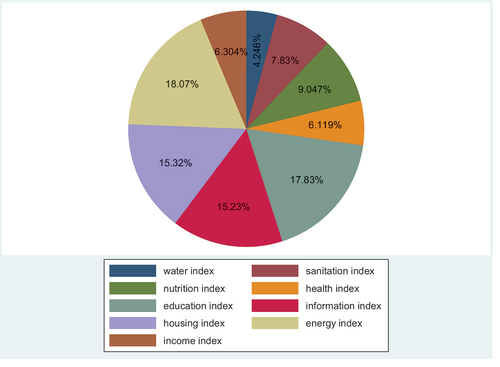
The following pie chart (Figure ) gives us information on how much child poverty is in the study area according to the MPI index. The values of 18.07 and 17.83, respectively, show us the percentage of children’s deprivation index of children in fuel and energy, and the education index. Accordingly, fuel and energy, and education are the major causes of multidimensional child poverty in the study area. While multidimensional child poverty has three large domains, namely health, education, and standard of living, it can be disaggregated into sub-indicators such as nutrition, child health, school attendance, years of schooling, cooking fuel, water, sanitation, housing conditions, and information. In this study, we have added the income aspect as one of the important indicators of multidimensional poverty in the study area. Following this assumption, if we aggregate the indicators of child poverty from the below pie chart, we can understand that standard of living is the biggest cause of multidimensional poverty contributing to about 67% of child poverty in the study area. Education is the second-ranked cause of child poverty contributing about 17.83% of multidimensional poverty while health contributes to 6% of multidimensional child poverty. Water deprivation is the lowest while income alone contributes about 6.3% to child poverty deprivation. From this, we can notice that the standard of living is the highest cause of multidimensional poverty while total income is the least in the study area.
Figure 1. Status of children’s deprivation index across indicators.
The descriptive statistics was used to describe the deprivation status of children from the sampled households. The result of the analysis showed that the incidence (headcount ratio) of multidimensional poverty (H) is 0.80; implying that 80% of children in the study area are multidimensionally poor. The intensity of multidimensional poverty (A) is 0.37; indicating, on average, multidimensionally poor children are deprived in 37% of poverty dimensions. Child poverty for different age groups was also measured. Among the sampled households, about 130 households do not have children under the age of five, while 271 households have children under the age of five. As descriptive result shows, 66% of underage five was found to be multidimensionally poor. On the other hand, 46 sample households do not have children aged between 6–18 years, while 355 households have children aged between 6–18 ages. Among these, about 89% of children aged between 6–18 years are multidimensionally poor. Comparing child poverty among age groups, we can find that children between 6–18 ages are poorer than children less than five ages. This is mainly due to child-based interventions being highly focused on children under the age of five. For example, nutrition interventions, and health interventions are primarily focused on children under the age of five. Child development interventions like education and skill-based training are still lagging to eradicate child poverty, especially for children aged between 6 to 18 years. In the rural area, most children were not motivated to go to school especially; in poor households that are not capable of sending their children to school. There are no strong education-based interventions in the study area which trace children left behind the school. Lack of education does not affect only the present lives of children; it also affects their future well-being.
3.4. Determinants of child poverty
3.4.1. The probit regression model results: Determinants of child poverty
This section analyzes the probability of children being in multidimensional poverty using various indicators. We assess whether or not a child is in poverty by using the MPI (Multidimensional Poverty Index) and construct the binary dependent variable of the probit model that takes the value of 1 if the MPI score cutoff point (Ci) ≥ 0.333 and the value of zero otherwise. Factors affecting child poverty are analyzed using the probit model. The dependent variable, in this case, is multidimensional child poverty, which is a dummy taking 1 value if a child is deprived of multiple indicators and 0 otherwise. The descriptive result indicated that about 80% of children were identified to be multidimensionally poor, while 20% of children are multidimensionally non-poor. Among 14 variables entered into STATA version 13 for analysis, 9 variables were found to be significantly affecting multidimensional child poverty. The likelihood ratio chi-square of −35.616059 with a p-value of<0.0001 tells us that our model as a whole is statistically significant (Table ).
Table 12. The Probit regression model on the determinants of child poverty
The overall age of the household head is positively associated with the probability of the child being in multidimensional poverty. A unit change in the age of the household head will increase the probability of each child in that household being poor by 5.6% if all other variables remain constant. This result is consistent with TARKI (Citation2010) and Bárcena et al. (Citation2015). They found that the age of a household head has a positive and strong relationship with the risk of experiencing poverty. Children of old-aged household heads are more likely to experience multidimensional poverty than children of young-aged household heads.
The overall livelihood diversification of a household head has a significant and positive association with multidimensional child poverty in the study area. Evidence from a study shows that livelihood diversification in different activities like on-farm, off-farm laboring, non-farm economy, and migration are important pathways out of rural poverty in various developing countries (World Bank, Citation2008). Non-farm activities are one of the components of livelihood activities that contribute to the large share of rural households. For example, it contributes about 50% of household income in Tanzania (Chapman & Tripp, Citation2004). The overview of the contribution of non-farm activities to household income in sub-Saharan Africa indicated that it ranges from 40-to 45% of average household income (Barrett et al., Citation2001). Several scholars agree that livelihood diversification is the dominant strategy for households in poverty situations. It is also identified that livelihood diversification significantly reduces rural poverty. In a similar way to these studies, the current study also identified that livelihood diversification decreases multidimensional child poverty in the study area. The regression result showed that multidimensional child poverty is higher for households that are not diversifying their livelihoods and vice versa. Livelihood diversification is statistically significant at a 1% probability level and is positively associated with multidimensional child poverty. A unit change in livelihood diversification increases the probability of multidimensional non-poverty by 7.4%, with other factors held constant.
Both Sen’s entitlement approach (Sen, Citation1976, Citation1981) and capabilities analysis (Drèze & Sen, Citation1989; Sen, Citation1993), which is a keystone of the human development and capability paradigm; remain fundamental to the conceptualization of the determinants of nutritional deprivations (Neglo et al., Citation2021). Child nutrition was assessed using dietary diversity methods. This method includes looking at past or current intakes of nutrients from the food by individuals or a group to determine their nutritional status. Accordingly, dietary information was gathered from each household using the seven-day recall method. The analysis result showed that there is a significant association between nutrition and multidimensional child poverty. A unit changes in dietary intake increases the probability of a child not falling into multidimensional poverty by 64%, holding all other variables remain constant.
Education is one of the important indicators of multidimensional child poverty. According to the United Nations Convention on the Rights of the Child (CRC) of 1990, one of the rights of children is access to education. The World Bank (Citation2010) declared that access to basic education is a child’s right and that they should be entertained. Child poverty can affect the overall child’s development, such as physical and mental development. A study on child poverty indicated that poverty increases the risk that children repeat a grade, perform poorly in school, are expelled or suspended from school, and obtain low scores on tests of school readiness and achievement. By late adolescence, poor youth are more likely than their non-poor peers to drop out of school and be unemployed. (Leventhal & Brooks-Gunn, Citation2001). Therefore, tackling childhood poverty requires a nuanced antipoverty strategy based on a real understanding of the relationships between childhood poverty and conditioning factors (Cockburn & Kabubo-Mariara, Citation2010). The current study has identified that there is a significant difference in education deprivation among multidimensionally non-poor and multidimensionally poor children in the study area. Children who have no access to education are more likely to fall into multidimensional poverty compared to children who have access to education. The education index in this study showed us that, access to education has a positive contribution to child development. Holding all other variables constant, access to education increases the likelihood of children escaping multidimensional poverty. This implies that, as educational attainment increases by one year of schooling, the likelihood of children escaping multidimensional poverty increases by 78%.
Sub-Saharan African children, in particular, have the highest incidence of severe deprivation concerning most of the indicators. Studies on rural children in South Asia and Sub-Saharan Africa indicated that more than 90% are severely deprived and 70% or more are entrapped in poverty. While African children are severely deprived of water, housing, education, and health, South Asian children are the most severely deprived concerning food, sanitation, and information, with more than 60% of the region’s children having no toilet facilities of any kind and another 40% lacking access to radio, television, telephone or newspapers at home. Moreover, a similar report indicated that most rural children are severely deprived of most indicators compared to urban children in developing countries. In the current study, multidimensionally poor children are highly deprived of most of the indicators compared to multidimensionally non-poor children. The information deprivation index also showed that there is a positive and significant effect of access to information on multidimensional child poverty. A unit increase in access to information devices increases the probability of children being out of multidimensional poverty by 74%, with other factors remaining constant.
Children deprived of multiple dimensions usually have problems with their cognitive ability and physical growth. Deprivations of various needs may lead children to despair in the short term and hinder their development in the long term. Using nutrition, drinking water, sanitation, health, housing, education, and information criteria, Gordon et al. (Citation2003) estimated the level of children’s deprivation from data across the 46 countries included in the Demographic and Health Surveys. The results of this study show that about 62% of sub-Saharan African children live in absolute poverty while 82% are severely deprived of at least one basic need (Djoke et al.,). The result of regression analysis revealed that an increase in house quality and room quality led to an increased probability of children being multidimensionally non-poor by 55%, and access to safe drinking water and clean sanitation services increases the probability of children being multidimensionally non-poor by 97%; other factors remaining constant.
Cooking fuel is one of the indicators that most children in the study area are deprived of. The most common fuel used to cook food in the study area is firewood, followed by charcoal. Since the majority of sampled households rely on firewood as a source of energy for cooking food, women and children are responsible for collecting wood. Therefore, it consumes their time, leaving children out of school. Moreover, smoke from firewood and charcoal is harming their health. A study from abroad also showed that children’s deprivation of cooking fuel is very high, at around 82% in Meghalaya, India (Hegde et al., Citation2019). In this study, the level of cooking fuel deprivation was around 52%. The percentage of multidimensionally poor children being deprived is nearly 62%, while about 32% of multidimensionally non-poor children are also deprived of cooking fuel. The regression result also showed that there is a significant effect of cooking energy deprivation on multidimensional child poverty at a 1% probability level. An increase in the utilization of poor-quality cooking fuel increases the probability of children being in multidimensional poverty by 100 %, other factors remain constant.
Family wealth is also among the important determinants of child poverty identified in the study area. Poor households cannot sufficiently provide basic child needs. Some studies also stress the linkage of household wealth status with multidimensional child poverty. For example, Cockburn and Kabubo-Mariara (Citation2010) mentioned that the inclusion of non-monetary measures in multidimensional poverty analysis helps to reveal complexities and ambiguities in the distribution of well-being that income-based poverty analysis cannot capture. The current study also finds that overall income deprivation is low and only 24% of children from sampled households are deprived. Even though children do not have access to income, a lack of household income can affect children’s lives by negatively impacting the level of deprivation in education, health, and other dimensions. Similarly, children from poor households might not have access to a balanced diet, access to health care, or access to information. A study on child poverty indicated that family income is a very important determinant of child poverty. For example, Chen and Corak (Citation2005) mentioned that children from families with a higher income had fewer chances of being deprived in different dimensions. The result from the regression model in the current study revealed that household wealth (being non-poor in income) decreases the probability of children falling into multidimensional poverty by 20%, while other factors are held constant.
4. The significance and the policy implication of the study
The results of this study have significantly improved contribution to the academic setting. To evaluate child poverty, a multidimensional method was applied in the study. This method enables a thorough investigation of the causes of child poverty. It also makes it easier for a researcher to distinguish between the child poverty indicators that are most prevalent across age and sex groups of children in the study area. Profiling research results based on characteristics of children and their household helps in identifying the most disadvantaged children so that the necessary policy recommendations may be made to reduce child poverty in the country.
Reduced poverty has significant positive effects on children’s wellbeing. Inequalities in health, nutrition, educational attainment, and employment opportunities are common among Ethiopian children who grow up in poverty. Consequently, early research and action will significantly aid in the fight against intergenerational poverty in the nation.
5. Conclusion and discussion
Child poverty is a multidimensional issue that requires a comprehensive approach to address it effectively. In this study, the counting approach was utilized to determine the extent of child poverty, and the results revealed that approximately 80% of children were multidimensionally poor. However, it was found that the poverty levels were slightly higher for children between the ages of 6–18 than for those under the age of five years. This result highlights the importance of considering children’s needs and age categories when analyzing poverty levels.
The study also identified two categories of factors that contribute to child poverty: parental-related factors and factors directly related to children’s needs. Socioeconomic factors, such as the sex, age, education status, health, and marital status of the household head, as well as livelihood strategies, total landholding in hectares, household annual income, number of plots of land, and livestock production, were identified as parental-related factors. The study found that laboring on other people’s farms, household size, total landholding in hectares, annual on-farm income, annual non-farm income, and some livestock significantly affect multidimensional poverty.
Furthermore, factors directly related to children’s needs, including nutrition, education, information, housing, income, fuel, and energy, were identified as important contributors to multidimensional poverty. Education was found to be the most significant factor contributing to child poverty, with 17.8% of children experiencing deprivation in this area. Fuel and energy were the second-highest contributors to child poverty, with 18% of children experiencing deprivation in this area. These figures demonstrate the critical need for policies and programs that address education and energy access for children living in poverty.
The study also found a significant difference in deprivation levels between multidimensionally poor and non-poor children concerning these indicators. This result suggests that policies and programs that address the needs of children living in poverty should be designed with a focus on addressing the specific challenges that multidimensionally poor children face.
Regression analysis was conducted to further examine the relationship between poverty and various indicators. The analysis revealed that the age of the household head, livelihood diversification, nutrition, education, information, housing, energy (cooking fuel), and household income had a significant impact on multidimensional poverty in the study area. These findings highlight the need for policies and programs that address the socioeconomic factors that contribute to child poverty, such as income and livelihood strategies, as well as the need for programs that improve access to education, information, and housing.
In conclusion, the study highlights the complex nature of child poverty and the importance of addressing multiple factors to effectively combat it. The findings suggest that policies and programs should be designed to address the specific needs of children living in poverty, with a focus on education, energy access, and socioeconomic factors. By taking a comprehensive approach, policymakers and stakeholders can work towards reducing child poverty and improving the well-being of vulnerable children.
The findings of this study have several policy implications for reducing child poverty and improving the well-being of vulnerable children. Firstly, the study highlights the need for policies that address the socioeconomic factors that contribute to child poverty, such as household income and livelihood strategies. Policymakers can explore policies that provide economic opportunities and support to low-income households, such as job training programs, microfinance programs, and social safety nets.
Secondly, the study emphasizes the critical importance of education in reducing child poverty. Policies that prioritize education access, quality, and affordability can help break the cycle of poverty and improve the well-being of children. Programs that provide scholarships, school supplies, and other support to children living in poverty can also help to reduce education-related deprivation.
Thirdly, the study highlights the need for policies that address energy access, particularly for cooking fuel. Policies that increase access to clean and affordable energy sources, such as liquefied petroleum gas (LPG), can improve the health and well-being of children living in poverty.
Finally, the study underscores the importance of taking a comprehensive approach to child poverty that considers multiple factors, including those related to nutrition, housing, and information access. Policymakers and stakeholders should prioritize policies and programs that address the specific needs of multidimensionally poor children, with a focus on addressing the challenges they face in each of these areas.
Disclosure statement
No potential conflict of interest was reported by the authors.
Additional information
Notes on contributors

Bogale Gemede
Bogale Gebeyehu is a doctoral student at the Center for Development Studies at Addis Ababa University. He is an assistant professor at Wolaita Sodo University’s Department of Rural Development and Agricultural Extension. His areas of research interest include food and nutrition security, livelihood diversification strategies, and rural poverty.
Bamlaku Alamirew
Bamlaku Alamirew Alemu has a Ph.D. in Development Economics and over 10 years of experience in teaching and research. He has a long year of experience in Project Management, led multidisciplinary research teams. He has rigorous analytic thinking skills and solid work experience in conducting impact evaluations in fields related to agriculture, food and nutrition security, and emergency and resilience. He has published several articles in international peer-reviewed journals.
Bezabih Emana
Bezabih Emana holds a Ph.D. degree in Agricultural Economics from Hannover University of Germany. He worked as a researcher and lecturer at Haramaya University, Ethiopia. His research areas include food security, nutrition, natural resources, environmental economics, institutional studies (cooperatives, microfinance), policies and systems focusing on Ethiopian the agricultural sector, markets, and value chain studies covering ranges of economic activities, gender, and other socio-economic studies.
References
- Alemu, G. (2009). Poverty analysis of children in child-headed households in Addis Ababa. Institute of Development Studies, Addis Ababa University.
- Alkire, S., Foster, J., Seth, S., Emma Santos, M., Manuel Roche, J., & Ballón, P. (2015). Multidimensional Poverty Measurement and Analysis. Oxford University Press.
- Alula, P., Woldehanna, T., Araya, M., Tafere, Y., Rossiter, J., Tiumelissan, A., & Birhanu, K. (2018). Young Lives Ethiopia: Lessons from Longitudinal Research with the Children of the Millennium. Addis Ababa.
- Atkinson, A. B. (2003). Multidimensional Deprivation: Contrasting Social Welfare and Counting Approaches. Journal of Economic Inequality, 1(1), 51–28. https://doi.org/10.1023/A:1023903525276
- Awan, M. S., Malik, N., Sarwar, H., & Waqas, M. (2011). Impact of Education on Poverty Reduction. Journal of Educational Sciences: Theory & Practice, 15(2), 337–348.
- Bárcena, E., Blanco, M., & Pérez, S. (2015). Differences in Child Poverty Between European Countries. In Papeles de trabajo (Vol. 2, pp. 7–21). Instituto de Estudios Fiscales.
- Barrett, C. B., Readorn, T., & Webb, P. (2001). Nonfarm Income Diversification and Household Livelihood Strategies in Rural Africa: Concepts, Dynamics and Policy Implications. Food Policy, 26(4), 315–331. https://doi.org/10.1016/S0306-9192(01)00014-8
- Birhanu, M. Y., Ambaw, B., & Mulu, Y. (2017). Dynamics of multidimensional child poverty and its triggers: Evidence from Ethiopia using Multilevel Mixed Effect Model. Accessed on July 7/20/2021 and available: Online at https://mpra.ub.uni-muenchen.de/79377/
- Bradbury, B., & Jantti, M. (2001). Child poverty across industrialized countries: Evidence from the Luxembourg Income Study. In Eds.<. I. I. A. I. C. U. <. Vleminckx & <. I. I. A. I. C. U. I. I. A. I. <. Smeeding, Child wellbeing, child poverty, and child policy in modern nations, Vol. 1(1), pp. 385–406, The Policy Press
- Bryceson, D. (1999). Diagrarinazation and rural employment in sub-Saharan Africa: A sectoral Perspective. World Development, 24(1), 97–111.
- Chapman, R., & Tripp, R. (2004) Background Paper on Rural Livelihood Diversity and Agriculture. Paper prepared for the 2004 AgREN electronic conference on the implications of Rural Livelihood Diversity for Pro-poor Agricultural Initiatives.
- Chen, W., & Corak, M. (2005). Child Poverty and Changes in Child Poverty in rich countries since 1990 . https://ssrn.com/abstract=708202.
- Chen, W., & Corak, M. (2008). Child poverty and changes in child poverty. Demography, 45(3), 537–553. https://doi.org/10.1353/dem.0.0024
- Cockburn, J., & Kabubo-Mariara, J. (2010). Child Welfare in Developing Countries: Poverty and Economic Policy (PEP. Research Network. https://doi.org/10.1007/978-1-4419-6275-1_1
- CSA and UNICEF Ethiopia. (2018) . Multidimensional Child Deprivation in Ethiopia. UNICEF Ethiopia, Addis Ababa.
- CSA, UNICEF, & OPM. (2015). Child well-being in Ethiopia: Analysis of child poverty using the HCE/WMS 2011 datasets. Central Statistical Agency, UNICEF and Oxford Policy Management.
- Davis, J. R. 2003. “The Rural Non-farm Economy, Livelihoods and Their Diversification: Issues and Options.” NRI Report No: 2753.
- Davis, B., DiGiuseppe, S., & Zezza, A. (2017). Are African households (not) leaving agriculture? Patterns of households’ income sources in rural Sub-Saharan Africa. Food Policy, 67, 153–174. https://doi.org/10.1016/j.foodpol.2016.09.018
- Dorward, A. (2002). Understanding small stock as livelihood assets: Final technical report. In Understanding small stock as livelihood assets: Indicators for facilitating technology development and dissemination (p. 7). Imperial College.
- Drever, F., Doran, T., & Whitehead, M. (2004). Exploring the relation between class, gender and self-rated general health using the new socioeconomic classification. A study using data from the 2001 census. Journal Epidemiol Community Health, 58(7), 590–596. https://doi.org/10.1136/jech.2003.013383
- Drèze, J., & Sen, A. (1989). Hunger and Public Action. Clarendon Press.
- Duncan, G., Gunn, J., J, B., Young, W. J., & Smith, J. R. (1998). How Much Does Childhood Poverty Affect the Life Chances of Children? American Sociological Review, 63(3), 406–423. https://doi.org/10.2307/2657556
- Ellis, F. (1998). Household Strategies and Rural Livelihood diversification. The Journal of Development Studies, 35(1), 1–38. https://doi.org/10.1080/00220389808422553
- FAO. (2013). Guidelines for measuring household and individual dietary diversity. Food and Agriculture Organization.
- FDRE (Federal Democratic Republic of Ethiopia), (2000). National Report on the Implementation of the Beijing Declaration and Platform for Action.
- Gautam, Y., & Andersen, P. (2016). Rural livelihood diversification and household well-being: Insights from Humla, Nepal. Journal of Rural Studies, 44, 239–249. https://doi.org/10.1016/j.jrurstud.2016.02.001
- Gordon, D., Nandy, S., Pantazis, C., Pemberton, S., & Townsend, P. (2003). Child poverty in the developing world. The Policy Press.
- Gornick, J. C., & Jantti, M. (2012). Child poverty in cross-national perspective: Lessons from the Luxembourg Income Study. Children & Youth Services Review, 34(3), 558–568. https://doi.org/10.1016/j.childyouth.2011.10.016
- Gregg, P., & Machin, S. (1998, July). Child Development and Success or Failure in the Youth Labour Market. Centre for Economic Performance, London School of Economics and Political Science, 1–40.
- Haggblade, S. (2007). “Alternative Perceptions of the Rural Nonfarm Economy. In Transforming the Rural Non-Farm Economy: Opportunities and Threats in the Developing World S. Haggblade, P. Hazel, and T. Reardonedited by. The International Food Policy Research, Institute the Johns Hopkins University Press. ( 490)
- Haggblade, S., Hazell, P., & Reardon, T. (2002). Strategies for Stimulating Poverty Alleviating Growth in the Rural Non-Farm Economy in Developing Countries. EPTD Discussion paper 92. International Food Policy Research Institute & the World Bank.
- Haggblade, S., Hazell, P., & Reardon, T. (2010). The rural non-farm economy: Prospects for growth and poverty reduction. World Development, 38(10), 1429–1441. https://doi.org/10.1016/j.worlddev.2009.06.008
- Hart, G. (1994). The Dynamics of Diversification in an Asian Rice Region”, Chapter 2. In B. Koppel, J. Hawkins, & W. James (Eds.), Development or Deterioration? Work in Rural Asia (pp. 43–54). Lynne Rienner Publishers Inc.
- Hegde, G. N., Devarani, L., Lahiri, B., Datta, K. K., & Hemochandra, L. (2019). Child Multidimensional Poverty and its Determinants in Rural Farm-Households of Garo Hills, Meghalaya. The Journal of Economic Affairs, 64(2), 459–467.
- Helmy, I. (2020). Livelihood Diversification Strategies: Resisting Vulnerability in Egypt, GLO Discussion Paper, No. 441, Global Labor Organization (GLO), Essen
- Hiremath, B. N. (2007). The changing faces of rural livelihood in India, In National Civil Society conference on what it takes to eradicate poverty, held at Institute of Rural Management, Anand, 4-6 December.
- International Labour Office. (2008). Promotion of rural employment for poverty reduction. ILO.
- John, C., Dauphin, A., & Razzaque, M. A. (2009). Child Poverty and Intra-Household Allocation.“Children. Youth, and Environments, 19(2), 36–53.
- Kennedy, G., Razes, M., Ballard, T., & Dop, M. C. 2010. Measurement of Dietary Diversity for monitoring the impact of food-based approaches. Available:http://www.foodsec.org/fileadmin/user_upload/eufaofsi4dm/docs/Dietary_Diversity_paper.pdf
- Khatiwada, S. P., Deng, W., Paudel, B., Khatiwada, J. R., Zhang, J., & Su, Y. (2017). Household livelihood strategies and implications for poverty reduction in rural areas of central Nepal. Sustainability, 9(4), 1–20. https://doi.org/10.3390/su9040612
- Leventhal, T., & Brooks-Gunn, J. (2001). Poverty and Child Development. International Encyclopedia of the Social & Behavioral Sciences, 26, 11889–11894.
- Loison, S. Rural Livelihood Diversification in Sub-Saharan Africa: A Literature Review. (2015). The Journal of Development Studies, 51(9), 1125–1138. Retrieved from. https://doi.org/10.1080/00220388.2015.1046445
- Ma, J. L. C., Wong, T. K. Y., Lau, Y. K., & Pun, S. H. (2009). Perceived family functioning and family resources of Hong Kong families: Implications for social work practice. Journal of Family Social Work, 12(3), 244–263. https://doi.org/10.1080/10522150903030147
- Mayer, S. (1997). What Money Can’t Buy, Family Income and Children’s Life Chances. Harvard University Press.
- Minujín, A., Delamonica, E., Davidziuk, A., & Gonzalez, E. D. (2006). The definition of child poverty: A discussion of concepts and measurements. Environment & Urbanization, 18(2), 481–500. https://doi.org/10.1177/0956247806069627
- Neglo, K. A. W., Gebrekidan, T., & Lyu, K. (2021). The Role of Agriculture and Non-Farm Economy in Addressing Food Insecurity in Ethiopia: A Review. Sustainability, 13(7), 3874. https://doi.org/10.3390/su13073874
- NPC. (2017). Ethiopia’s progress towards eradicating poverty: An interim report on 2015/16 poverty analysis study. National Planning Commision.
- Oshio, T., Sano, S., & Kobayashi, M. (2009). “child poverty as a determinant of life outcomes: Evidence from nationwide surveys in Japan”. Institute of Economic Research, Hitotsubashi University.
- Oxford Poverty and Human Development Initiative. (2017). “Ethiopia Country Briefing”, Multidimensional Poverty Index Data Bank. OPHI, University of Oxford. Available at: www.ophi.org.uk/multidimensional-poverty-index/mpi-country-briefings/.
- Ratcliffe, C., & Signe-Mary, M. (2010) “Childhood Poverty Persistence: Facts and Consequences” The Urban Institute: Brief 14, June
- Ruel, M. T. 2002. Is dietary diversity an indicator of food security or dietary quality? A review of measurement issues and research needs. Food Consumption and Nutrition Division Discussion Paper 140. International Food Policy Research Institute.
- Sen, A. (1976). Famines as Failures of Exchange Entitlements. Economic and Political Weekly, 11(31), 1273–1280.
- Sen, A. (1981). Poverty and Famines: An Essay on Entitlement and Deprivation. Clarendon Press.
- Sen, A. (1993). Capability and well-being. In M. Nussbaum & A. Sen (Eds.), The Quality of Life (pp. 30–53). Clarendon Press.
- Sewnet Yizengaw, Y., Ndemo Okoyo, E., & Beyene, F. (2015). Determinants of livelihood diversification strategies: The case of smallholder rural farm households in Debre Elias Woreda, East Gojjam Zone, Ethiopia. African Journal of Agricultural Research, 10(19), 1998–2013. https://doi.org/10.5897/AJAR2014.9192
- Smith, L. C., & Subandoro, A. (2007). Measuring Food Security Using Household Expenditure Surveys. In Lisa (Ed.), Food Security in Practice technical guide series (pp. 7). International Food Policy Research Institute.
- Swindale, A., & Bilinsky, P. (2006). Household Dietary Diversity Score (HDDS) for Measurement of Household Food Access: Indicator Guide (v.2). FHI.
- TARKI. (2010). Child Poverty and Child Well-being in the European Union. Report prepared for the European Commission, (1). Pp. 11–106. Tarki Social Research Institute.
- UNDP, & OPHI. (2019) . Global multidimensional poverty index 2019: Illuminating inequalities. United Nation’s Development Programme and Oxford Poverty & Human Development Initiative.
- UNICEF. (2005) “State of the World’s Children 2005: Childhood Under Threat” UNICEF HQ New York. Available: http://www.unicef.org/sowc/
- UNICEF. (2017). A world free from child poverty: A guide to the tasks to achieve the vision.
- UNICEF. (2018). Child Notice Ethiopia.
- UNICEF. (2019). The State of the World’s Children 2019. Children, Food, and Nutrition: Growing well in a changing world. UNICEF.
- UNICEF Ethiopia. (2018). Financing the Child-Centred Sustainable Development Goals (SDGs) in. Policy Brief.
- UNICEF Ethiopia and Central Statistical Agency of Ethiopia. (2016). The Multidimensional Child Deprivation in Ethiopia is based on the Ethiopian Demographic and Health Surveys Data Sets of 2011 and 2016. CSA, Addis Ababa.
- Watkins, K., & Quattri, M. (2016) Child poverty, inequality, and demography: Why sub-Saharan Africa matters for the Sustainable Development Goals. ODI Report. London: ODI World Bank (n.d.) ‘The human capital project’ World Bank. www.worldbank.org/en/publication/human-capital).
- Werede, W., Kassa, B., & Aregawi, K. (2013). Assessment of Non-Farm Livelihood Diversification of Farmers in Enderta Woreda, Tigray. Unpublished MSc. Thesis in Development Studies, Mekelle University,
- WHO. (2008). Access to improved drinking water sources and improved sanitation, WHO Statistical information system, retrieved from: http://www.who.int/whosis/indicators/compendium/2008/2wst/en/.
- Wiesmann, D., Basset, L., Benson, T., & Hoddinott, J. 2009. Validation of the World Food Programme’s Food Consumption Score and Alternative Indicators of Household Food Security. IFPRI Discussion Paper 00870. Available: http://www.ifpri.org/sites/default/files/publications/ifpridp00870.pdf
- World Bank, (2008). Rural households and their pathways out of poverty. World Development the report, 72–93
- Worldbank. (2010). Making BOS Effective under Decentralization Policy Brief. World Bank.
- Wu, S. (2003). The Effect of Health Events on the Economic Status of Married Couples. Journal of Human Resource, XXXVIII(1), 209–230. https://doi.org/10.3368/jhr.XXXVIII.1.219
- Yamane, T. (1967). Elementary sampling theory. Perentice-Hall, Inc.
- Yeboah, F. K., & Jayne, T. S. (2018). Africa’s Evolving Employment Trends. The Journal of Development Studies, 54(5), 803–832. https://doi.org/10.1080/00220388.2018.1430767
- Yirga Belete, G. (2022). Children’s multidimensional deprivation, monetary poverty and undernutrition in Ethiopia. Review of Economics of the Household, 20(4), 1087–1118. https://doi.org/10.1007/s11150-021-09568-5
Annex 1: Dimensions, indicators and weight attached to multidimensional child poverty