
 ?Mathematical formulae have been encoded as MathML and are displayed in this HTML version using MathJax in order to improve their display. Uncheck the box to turn MathJax off. This feature requires Javascript. Click on a formula to zoom.
Abstract
Because the food manufacturing sector, as a fundamental and regionally specialized enterprise, has a substantial impact on the rural economy, an empirical analysis of the food manufacturing industry’s expansion is required. However, regarding the evidence and means of ensuring vitality in agricultural and rural areas, academic theories and empirical studies still lack depth among the existing scholarship. As such, this study conducted a spatial pattern analysis to determine whether small food manufacturers in Korea were more concentrated than other manufacturing industries by using cluster analysis methods. The data used for the analysis are business basic survey statistics (2010), taken from a comprehensive survey that discloses the number of businesses, number of employees, organizational type, employee size, and occupational status of all businesses nationwide every year, even at the 5-digit level of municipalities. Data from 2000 and 2010 were used to analyze the employment growth of the food manufacturing industry. In 2010, 230 cities (Si), counties (Gun), and boroughs (Gu) were targeted to analyze employment patterns in the food manufacturing industry. The analysis results indicated that there were differences in potential cluster regions according to regional characteristics. Through the results of the study of spatial patterns, several implications were found for Korea’s food manufacturing industry promotion policy. In addition, this study provides basic information for analyzing the external effects of the food manufacturing industry through agglomeration by industry and region and the impact on productivity through related industries.
PUBLIC INTEREST STATEMENT
This study confirmed that the food manufacturing industry is specialized and clustered like other manufacturing industries. Through the results of the spatial patterns identified in this study, policy implications can be found for Korea’s national food cluster project and the sixth industry promotion strategy. First, it is reasonable for a linkage strategy to implement the National Food Cluster project in various regions beyond the administrative district. Second, considering that the potential cluster regions differ for each industry, it would be inefficient to attract all food industries to the national food cluster region, which would not be ideal for a market economy. Third, the spatial patterns of the food manufacturing industry should be considered. For example, since the promotion area includes rural and fishing villages, it is necessary to select the type of business in which the supply site is located and to make good use of the accumulated profits of the specific area.
1. Introduction
As unprecedented interconnected environmental, societal, and economic challenges, due to resource depletion, climate change, and the outbreak of pandemics and wars, pose dilemmas and threats to enough, safe, and sustainable food (Echegaray et al., Citation2022; Hassoun et al., Citation2022), the food manufacturing industry is currently in the spotlight as a regionally specialized business and has a very significant influence on the rural economy in Korea.Footnote1 Food itself is directly related to the life and health of the people, which is the highest value set by the Constitution, and food-related industries, especially food manufacturing, are closely related to the sustainability of the local economy, solving social problems, protecting agriculture and rural areas, fostering the development of small and medium-sized enterprises, and balanced regional development. Therefore, an empirical study of the growth of the food manufacturing industry is needed in light of the constitutional duty of the state.
More specifically, according to Article 123 of the Constitution of the Republic of Korea, the state shall establish and implement a plan to comprehensively develop and support the farm and fishing communities in order to protect and foster agriculture and fisheries. And the state shall have the duty to foster regional economies to ensure the balanced development of all regions. In order to protect the interests of farmers and fishermen, the state shall endeavor to stabilize the prices of agricultural and fishery products by maintaining equilibrium between the demand for and supply of such products and improving their marketing and distribution systems. In addition, the state shall foster organizations founded on the spirit of self-help among farmers, fishermen, and business persons engaged in small and medium industry and shall guarantee their independent activities and development.
However, regarding the evidence and means of ensuring vitality in agricultural and rural areas, academic theories and empirical studies still lack depth among the existing scholarship. For example, the theory that the basic principle of clusters is spatial accumulation (Porter, Citation1998) does not reflect the observation that the cluster unit in Korea is expanding, in accordance with the scale of crop production in agriculture, from a regional unit to a metropolitan area and a national unit. Moreover, the cluster strategy promoted by administrative districts differs from the theory set based on industrial activities in spatial units, which raises problems related to resource distortion in distribution (the Modifiable Areal Unit Problem, or MAUP).
Empirical research on the US food manufacturing industry has been accumulated to date. Yoon (Citation1994) conducted a study on the location and environmental management of the food industry in Nebraska, USA, which had similar conditions to Gangwon-do in Korea. Goetz (Citation1997) identified differences between newly established food manufacturing companies between 1987 and 1993 and food manufacturing companies that closed during that period in 48 states and 3,041 counties and examined the influence of variables through general regression analysis. At the county level, the proxy variables for market access were access to highways, railroads, and ports, while the labor market used wages, education, and unemployment rates. The proxy variable for integrated profit is population. As a result, the higher the education, the higher the unemployment rate, and the lower the wage level in the manufacturing industry, the greater the number of companies. While there is an increase as the population increases, the concentration of food manufacturers has a negative effect on the establishment of enterprises.
Henderson and McNamara (Citation2000) divided the food manufacturing industry into production location, consumption location, and free location using Poisson regression analysis of investment in food manufacturing in counties in 1987–1995. The influence was examined through labor market factors, social infrastructure, agglomeration factors, quality of life factors, and fiscal policy factors. The results indicated that market factors showed a justice effect, wages had a wealth effect, infrastructure had a justice effect, agglomeration factors had a justice effect, and taxes had a wealth effect.
In Lambert et al. (Citation2006) study, since the food manufacturing industry is considered to be a potential source of growth in rural areas, a spatial probit model was used to examine the effects of market, agglomeration, infrastructure facilities, labor, and fiscal policies on the location selection of the food manufacturing industry. The food manufacturing industry was divided into three locations: production location, consumption location, and free location. Location selection was made as a function of market, agglomeration, infrastructure, labor, and fiscal policy, and cities and counties were used as dummy variables. As a result, the urbanization economy, commodity market, commuting quantity, labor quality, and transportation infrastructure were found to be important factors in location decisions for the food manufacturing industry.
Lambert and McNamara (Citation2009) analyzed the effects of market factors such as agglomeration, infrastructure, labor, and fiscal policy on the location of food manufacturing in the United States using negative binomial regression and spatial clustering methods. The supply location, consumption location, and free location were classified, and if the number of new establishments by industry in 2000–2004 increased by county area as a unit, if the number decreased, it was set to 0, and the method was used as the total amount.
More recently, research on the food manufacturing industry has evolved into various relevant topics regarding the food sector in the COVID-19 pandemic (Boyacι-Gündüz et al., Citation2021; Galanakis et al., Citation2021), as well as the state of the art applied in the field, such as functional food components and emerging technologies (Galanakis, Citation2021). Also, it has tackled not just the US non-profit sector (Steele et al., Citation2022), the UK agri-food migrant industry (Agar & Manolchev, Citation2020), but also developing countries including China (Shen et al., Citation2021; Sun et al., Citation2021), and Bangladesh (Hassan et al., Citation2020).
Among the spatial unit analysis studies related to the location of the city and county units, there are a few Korean studies targeting the food manufacturing industry. For example, Kim et al. (Citation2013) conducted a cluster analysis and specialized analysis for targeting each subcategory of the food manufacturing industry and only identified cluster patterns in the food manufacturing industry. Considering the location characteristics with a high dependence on raw materials, the regional concentration of the food manufacturing industry was analyzed based on the number of businesses and the number of employees, assuming that the industry was highly likely to focus on regions favorable for securing raw materials. For the analysis method, location coefficient and regional Moran’s I were individually used, and the subject was a small classification (3 digits) of the food manufacturing industry. As a result, it was concluded that regional differences in spatial distribution and cluster formation could be seen as the result of differences in the characteristics of raw materials input by industry, proximity to markets, transportation, and manpower required.
Although few studies on Korean cases related to location that preceded the agglomeration of the food manufacturing industry were conducted, existing studies on Korean food industry clusters (J.W. Kim et al., Citation2012b; J.H. Kim et al., Citation2004; Jeon, Citation2013; S.M. Kim, Citation2009; S.Y. Kim et al., Citation2009) have proposed a policy direction for food cluster formation and focused on networking research without dealing with the accumulation of basic people.
Based on the limitations of the previous literature, this study intends to analyze the spatial agglomeration pattern of food manufacturers, which is the premise for the promotion of food clusters. In general, firms can enjoy the externality of profits from the economy of agglomeration by consolidating firms in a specific region (Henderson, Citation1997; Alfred Marshall, Citation1890; Ohlin, Citation1933; Hoover, Citation1937; Arrow, Citation1962; Romer, Citation1986; Jacob, Citation1969; Rosenberg, Citation1963; Scherer, Citation1982). Since externalities are factors that affect productivity in addition to the basic input factors of labor and capital, it is expected that confirming the accumulation will have implications for the government’s food-related policy and for attracting the food manufacturing industry to different regions.
2. Materials and methods
2.1. Materials
The research question of this study includes how spatial agglomeration was mapped for the Korean food manufacturing industry considering location characteristics. The tasks conducted in the food manufacturing industry range from the simple drying, salting, sorting, grading, and packaging of raw materials to processing with modern, capital-intensive methods. In this study, the efficiency problem of the food manufacturing industry is “industrial,” which focuses on its relevance to other industries such as agriculture rather than the functional characteristic of food being “eaten,” because our focus is on its role. The food manufacturing industry of the study thus includes the tobacco manufacturing industry (C12) in addition to the food manufacturing industry (C10) and beverage manufacturing industry (C11) within the manufacturing (C) category in the ninth standard industrial classification of Korea.
Data from 2000 and 2010 were used to analyze the employment growth of the food manufacturing industry. In 2010, 230 cities (Si), counties (Gun), and boroughs (Gu) were targeted to analyze employment patterns in the food manufacturing industry. Considering the average size of the food manufacturing industry (5.18 persons per piece) itself, a smaller regional unit was considered suitable, but since the food manufacturing industry requires a large amount of agricultural raw materials, the spatial scope was defined at the city, county, and district level. The data used for the analysis are business basic survey statistics (2010), taken from a comprehensive survey that discloses the number of businesses, number of employees, organizational type, employee size, and occupational status of all businesses nationwide every year, even at the 5-digit level of municipalities. Therefore, it has the advantage of presenting an understanding of the whole food manufacturing industry.
2.2. Methods
2.2.1. Weber’s (1929) model
According to Weber’s (Citation1929) location theory model, the optimal location selection of a firm is a trade-off between the transport costs of input factors to the production facility and the transport costs of the product to the commodity market. Weber argues that the location selection of food manufacturers typically consists of two steps (Deller, Citation2009). In the first step, firms choose a location () with the highest demand and the lowest transport cost. However, the final decision is not made at the location (
) with the lowest transport cost.
= total food sales,
= product price in the market;
= sales at product price in the market
= total cost of product,
= fixed cost,
= variable cost
= total transportation cost,
= Transportation cost from factory
to product
,
= Transportation cost from input market
to location s. Therefore, based on (1), (2) and (3), the profit can be expressed as (4) as follows:
In the second step, other economic incentives are considered based on factor endowment. The isocost line with the lowest transport cost is located in a specific area according to the resources present.
Here, in the equal transport cost line, the transport cost represents a constant value, and the production cost in a specific region varies based on an abundance of factors. Equation 7 is the same as the formula for considering fixed and variable costs that are regionally different in the final location.
The economy of agglomeration refers to an external economy or external diseconomy that occurs when a number of economic entities are agglomerated in the same area in the course of business activities, or corporate production activities in particular. Alfred Marshall (Citation1890) first found that companies operating in the same industry in a certain area consolidate because profits are generated. The agglomeration economy can be divided into the effects of concentration in a specific industry and the external effects of concentration in the industry as a whole (Ohlin, Citation1933). Hoover (Citation1937) called the former a localization economy and the latter an urbanization economy. Localization economy is related to geographic specialization in specific activities, and urbanization economy is related to population size and economic diversity (Viladecans-Marsal, Citation2004).
In the former case, the integrated profit reduces transportation costs between companies due to their geographical proximity or reduces transportation costs or spreads knowledge by being located near suppliers, consumers, and labor markets (Marshall, 1920; Arrow, Citation1962; Romer, Citation1986). This is called MAR externalities (Marshall-Arrow-Romer externalities) (Glaeser et al., Citation1991), and the latter’s integrated profit increases productivity from urban scale expansion through various industrial structures. 1: Diversified labor market and abundant labor force 2 Urbanization economic theory In this study, knowledge diffusion is achieved through mutual exchange between different industries (Jacob, Citation1969; Rosenberg, Citation1963; Scherer, Citation1982). Therefore, in order for the industry to grow, diversity and a large urban environment are typically required.
2.2.2. Getis-Ord Gi* method
In general, spatial autocorrelation exists when regions with higher or lower values than the overall mean are adjacent and form a spatial cluster. However, the above statistic cannot reflect this (Feser et al., Citation2005). Spatial data is the first law of geography; as presented by Tobler (Citation1970), “everything is related to everything else, but things that are close to each other are more highly related than things that are far away.” This is the principle of spatial autocorrelation (spatial dependence or spatial association).
For such a problem, the spatial structure between regions should be reflected in statistics. This is because when spatial autocorrelation exists, spatial patterns tend to cluster, and even if two regions show similar agglomeration characteristics, the location of economic activity has different characteristics depending on the difference in spatial autocorrelation (Lee & Shim, Citation2011). The analysis methods that can analyze spatial properties include the global statistic of Moran’s I, the local statistic of Moran’s I, and the global G-statistic.
Getis-Ord method was used for this analysis because
statistics separates hotspots (if the correlation between a particular region and its neighboring regions is high) from cold spots (if the correlation is low).
The local G index divides the sum multiplied by the weights of the distances of the neighboring regions by the sum of the neighboring regions; the primary area is also considered an adjacent area.
: Standard Deviation,
: region
’s characteristics,
: Average,
: weight
The local G-statistic value is obtained by subtracting the expected value from the observed value and dividing it by the standard deviation. This means that the surrounding regions form high-value clusters, and when is low, the surrounding regions form low-value clusters.
is the number of food manufacturers in each region. However, if
is expressed using absolute values such as the number of employees, large cities are classified as hotspots in all industrial sectors. That is, spatial convenience may occur. There are two ways to control the so-called large-size effect, in which the size of a city determines
. The function can first be converted to a logarithmic form or use relative figures such as percentages, but there are disadvantages in that external effects excluding each scale cannot be seen and regions with a small regional scale will come out as a relatively larger specialized region. To solve this problem, in this study, the residuals obtained by the regression analysis of the number of food workers to the total number of workers were used for cluster analysis (Feser et al., Citation2005).
Euclidean distance was used as the distance measurement method, and FDB (Fixed Distance Band) using the sphere of influence at a specific distance from the individual was used for spatial relevance ((H.Y. Kim et al., Citation2012a)). Since the statistic of has a Z distribution, its statistical significance can be tested. If the Z value is greater than 1.96, it is statistically significant at the significance level of 0.05.
2.2.3. The industrial location coefficient (LQ)
The industrial location coefficient (LQ) indicates the relative degree of specialization of an industry by comparing the national employment share of an industry with the employment share of a specific region. In general, if it is greater than 1, the industry is considered specialized. The LQ of a region is defined as follows:
,
: percentage of industry j’s workers among entire industry workers in the region
: percentage of industry j’s workers among entire industry workers across the country
Because LQ is easy to calculate and it is easy to obtain basic data, geographers and economists have widely used LQ to derive regional concentrations of specific industries (Carroll et al., Citation2008). However, LQ has the following disadvantages: First, it does not show spatial and economic interdependence and implicitly assumes self-sufficiency in the region. Second, the statistical significance level of the LQ value is usually unknown, indicating arbitrariness in statistical testing and classification. The threshold value of the LQ used to determine the cluster may also be arbitrary.
However, in this study, all indices used for non-spatial analysis do not have standards that specify that specific index values are specialized, that comparative studies with other existing studies are possible, that calculations are easy, and that basic data can be easily obtained. Fratesi (Citation2008) decided whether to specialize in LQ, and in this study, regions with LQ > 1.75 or higher are classified as specialized in the food manufacturing industry. Based on the method of DTI (2001) in the UK, which stated that the LQ criterion should be higher than 1 for regions with small administrative units, Ketels et al. (Citation2006) followed the EU10 country cluster mapping LQ criterion of 1.75.Footnote2
3. Results
3.1. Location type of food manufacturing industry
There are 45 types of food manufacturing industries based on the detailed 5-digit classification presented in the Korean Industrial Standard Classification (KSIC-9). Analyzing all food manufacturing industries one by one is inefficient, but only selecting representative industries is arbitrary. It is thus necessary to simplify our understanding of the entire food manufacturing industry according to its characteristics. In this study, the food manufacturing industry is classified based on location theory. Connor and Schiek (Citation1997) divided the food manufacturing industry into three categories: supply location, demand location, and free location.Footnote3
These three categories can be sorted according to a company’s cost structure. A large part of the production cost of a supply location-type company goes into the input of raw materials. These companies should be located near the input to reduce pre-treatment costs in most circumstances. Demand-located companies are those in which distribution costs account for a large portion of production costs. A company’s location is sensitive to demand for access in the household sector. In this way, factories are often located near the city center to reduce distribution costs. Examples of product types for these businesses include beer, soft drinks, other water-related products, and companies that make perishable products like milk. Free-standing companies are not affected by pre-treatment costs or distribution costs. Free-standing manufacturers usually produce a variety of products, like cookies, crackers, and frozen products, rather than a single product. Locations are selected for their access to labor, capital, business services, transportation, and technology.
3.2. Spatial distribution of the food manufacturing industry
3.2.1. Spatial clustering
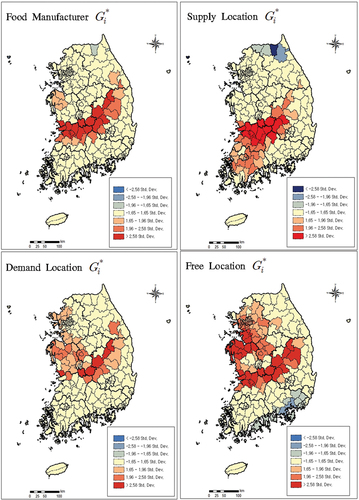
The result of Getis-Ord method is shown in Figure . In the cluster of food manufacturing industries, hot spots appear in Jeollabuk-do, Chungcheongbuk-do, Gyeongsangbuk-do, and Gangwon-do. Cold spots appear in some areas of Gangwon-do. The clustering of the supply location industry appears in Jeollanam-do, Jeollabuk-do, Gyeongsangnam-do, and some regions of Gyeongsangbuk-do. The distribution of the community exists within fishing and rural areas. The demand location industry has a smaller cluster size than other industries and is clustered near the metropolitan area. The free-located industry has a relatively large cluster size and is characterized by cluster distribution near the metropolitan area, similar to demand locations.
Figure 1. Special spatial autocorrelation by food manufacturing industries (2010).
3.2.2. Regional-specific analysis
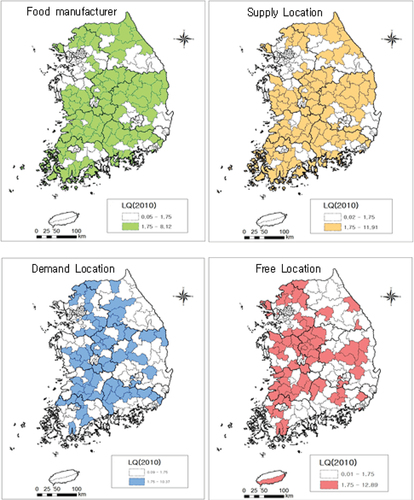
The result of the industrial location coefficient (LQ) is shown in Figure . In cities with large populations like special cities, metropolitan cities, metropolitan areas, and Cheongju, the proportion of the food manufacturing industry was lower than the 1.75 standard. As for the LQ of the supply location industry, Yeonggwang-gun was the largest at 11.9, followed by Sunchang-gun, Wando-gun, Goheung-gun, Haenam-gun, Yeongdeok-gun, and Buyeo-gun. These cities and counties belong to rural areas. As for the regions with the highest LQ by industry in the demand location, Imsil-gun had the highest value at 10.4, followed by Jeungpyeong-gun, Okcheon-gun, Gimje-si, Namwon-si, Cheongyang-gun, Sancheong-gun, Jincheon-gun, Hongcheon-gun, Eumseong-gun, and Yeongi-gun. The regions with the lowest LQ were Jung-gu, Seoul, with 0.1, followed by Gangnam-gu, Gwacheon-si, Jongno-gu, and Seocho-gu. Areas that are considered inconvenient to transport are characterized by a low LQ, such as areas far from the market, Jirisan, and Taebaeksan. The LQ of the free-located food manufacturing industry is the highest at 12.9 in Eumseong-gun, followed by Yeongyang-gun, Boeun-gun, Jinan-gun, Jincheon-gun, and Nonsan-si.
Figure 2. LQ distribution of food manufacturing (2010).
3.2.3. Analysis of spatial density by food manufacturing industry and results
In Table , hotspots showing correlations with high values, such as the food manufacturing industry, between regions were classified as clustered regions with a significance level of 0.05%. Regarding specialization, the LQ value was divided based on 1.75 and nominally classified into potential cluster regions, specialized regions, unrelated regions, and correlated regions (Table ).
Table 1. Agglomeration type of food manufacturing industries
The potential cluster area is also a specialized area, and the surrounding area is also an area with a significant number of workers in the same industry. These regions are also those that are considered to have the greatest externality by adding the benefits of agglomeration and the interests of adjacent regions as autocorrelation regions. A specialized area is an area where only the relevant area is industrially based, and only the food manufacturing industry is a base industry. In the surrounding area, there is no autocorrelation because workers in the same industry are not significant. Externalities only have the cumulative benefit of the region. A correlation area is an area that is not industrially aggregated. However, spatially, the surrounding area has a high correlation with the number of workers. It is an area where there is no accumulated profit, but a profit related to the number of workers in the surrounding area is expected to have a positive impact on the area. The areas classified as unrelated areas are those in which the food manufacturing industry is not a basic industry within the area and there is no spatial autocorrelation of the number of workers in the surrounding area. Externalities are expected to be the lowest in these areas.
The result of mapping the nominal variables is shown in Figure . As for the overall pattern, based on the potential cluster, the topography of the supply location is generally distributed in rural areas, and the topography of the demand location and free location are located closer to the metropolitan area. For the entire food manufacturing industry, potential cluster regions are Yeongdong-gun, Geumsan-gun, Seocheon-gun, Gunsan-si, Iksan-si, Gimje-si, Wanju-gun, Jinan-gun, Muju-gun, Jangsu-gun, Buan-gun, Gimcheon-si, Andong-si, Yeongju-si, Sangju-si, Uiseong-gun, Yecheon-gun The potential cluster areas for supply locations include parts of Jeollanam-do, parts of Chungnam, and parts of Gangwon, and the range of rural areas has been expanded. Other specialized areas are similar to the overall food manufacturing industry classification.
Figure 3. Space agglomeration type of food manufacturing industries (2010).
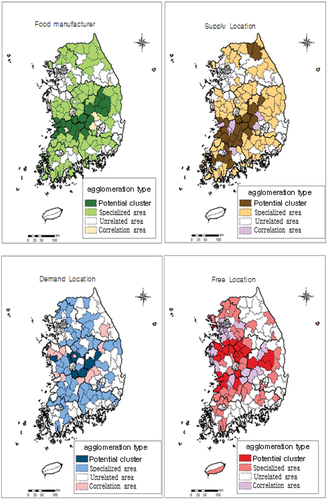
Potential cluster areas for demand location are Cheongwon-gun, Yeongdong-gun, Geumsan-gun, Yeongi-gun, Hongseong-gun, Sangju-si, and Yecheon-gun in parts of Chungnam, North Chungcheong, and Gyeongbuk. It is mainly distributed on the outskirts of special and metropolitan cities. Due to the nature of the industry, it is classified as a specialized area even in a special metropolitan city, but it is classified as an unrelated industry in rural areas. The free location potential cluster areas are Jung-gu, Incheon, Bupyeong-gu, Pyeongtaek, Anseong, Cheongju, Cheongwon-gun, Jincheon-gun, Goesan-gun, Eumseong-gun, Jeungpyeong-gun, Cheonan-si, Asan-si, Geumseong-gun, Seocheon-gun, Hongseong-gun, Yesan-gun, Dangjin-gun, Gunsan-si, Iksan-si, Gimje-si, Goe It is distributed in Jeollabuk-do, Chungnam, Chungbuk, southern Gyeonggi, and western Gyeongbuk, such as Buan-gun, Andong-si, Sangju-si, and Uiseong-gun.
4. Discussion and Conclusion
In order to foster a country’s economic growth by linking regional policy development, it is important to understand industrial clustering and its patterns of development (Hassan et al., Citation2020). The Korean government is institutionally strengthening a single system and business concentration for food industrialization. The government project for food industrialization is divided into a food industry cluster project for the advancement of the food industry and expansion of export of agri-food and a sixth industrialization promotion project for integrated regional development and fostering of rural industries (2013, Ministry of Agriculture, Food and Rural Affairs, Ministry of Oceans and Fisheries). The food cluster business focuses on strengthening the clusters of the food manufacturing industry, such as the regional agricultural cluster business, the regional food industry cluster establishment project, and the national food cluster project. A key policy for the economic vitality of rural areas involves the linkage of food manufacturing (secondary) and tourism (third).
In this study, spatial agglomeration was mapped for the food manufacturing industry considering location characteristics. As a result, we confirmed that the food manufacturing industry is specialized and clustered like other manufacturing industries. It can be assumed that food manufacturers can enjoy the external effect of increasing productivity by being located in the same area. However, our analysis of the spatial pattern of the industry, considering its location characteristics, indicated that the location of the supply site was concentrated in rural areas according to the location theory of the food manufacturing industry. This is because it is located in an agricultural product shipping area where the transportation cost of raw materials is expensive and the food manufacturing industry uses the supply chain (SC) efficiently. However, the demand location was not inside the metropolitan area to minimize distribution costs. Rather, it was concentrated in the surrounding area and the border area, and the same was the case with the free-standing location.
The existing theory indicates that it should be located inside a large city, but the fact that it is not indicates that there is no external effect to offset the land price of the metropolitan city in the operation of the company. However, due to the development of roads and the distribution industry, potential clusters are formed in the outskirts of the metropolitan area and in the vicinity of the border areas of each province in terms of demand location and free location for entry into other commercial areas. Therefore, in the demand- and free-located industries, the distance to major markets and the industry linkage structure with the distribution industry can affect productivity.
The results of the spatial patterns identified in this study imply that there is a need to balance the supply and demand of the food industry among different regions (Sun et al., Citation2021: 9). From a regional perspective, several policy implications can be found for Korea’s national food cluster project and the sixth industry promotion strategy. First, as a result of examining the accumulation and spatial autocorrelation through spatial patterns, the whole food manufacturing industry appears in parts of Jeollabuk-do, Gyeongbuk, and some regions of North Chungcheong Province. It is thus reasonable for the National Food Cluster to be located in the Jeonbuk region. However, a linkage strategy will be needed to implement this national project in other regions beyond the administrative district. Second, considering that the potential cluster regions differ for each industry, it would be inefficient to attract all food industries to the national food cluster region, which would not be ideal for a market economy. In other words, industries targeted for attraction within the National Food Cluster can be viewed as supply-located and free-located industries. Third, when promoting the sixth industrialization in rural areas, spatial patterns in the food manufacturing industry should be considered. Since the promotion area includes rural and fishing villages, it is necessary to select the type of business in which the supply site is located and to make good use of the accumulated profits of the specific area.
This study showed that the specialization and clustering of each food manufacturing industry differed according to regional characteristics with respect to agglomeration, which is an external effect of productivity targeting all cities, towns, and districts. Based on the findings of this study, more specific food industry policy implications can be derived by using systematic methods of industry document archives (Steele et al., Citation2022) or natural language processing (Shen et al., Citation2021) in future studies to analyze the impact on productivity improvement in the food manufacturing industry. In addition, researchers need to accumulate further investigations on the spatial effects of migrant labor (Agar & Manolchev, Citation2020), food security (Boyacι-Gündüz et al., Citation2021), agri-food innovations (Galanakis et al., Citation2021), and emerging technologies (Galanakis, Citation2021) in the post-pandemic food sector.
As an empirical analysis in food, this study discusses the pattern of food manufacturing in Korea. However, from the perspective of economic geography, the study only discusses the most basic pattern, so future research has the following contents that can be improved: First, the lack of a description of the temporal evolution of the food manufacturing pattern between 2000 and 2021 needs investigating. Second, as there is a lack of quantitative description of the causes of food manufacturing patterns, such as GDP, traffic, etc., a regression (like OLS or GWR) analysis can help explain the causes.
Disclosure statement
This paper is based on a part of the author’s unpublished PhD dissertation, ‘Regional economic effect of food manufacturers: spatial concentration, employment growth, value-added (2015)’.
Additional information
Notes on contributors
Yong Sik Roh
Yong-sik Roh, Special Fellow, National Research Council for Economics, Humanities, and Social Sciences, South Korea Research Interests: Spatial econometric analysis, regional balance policy
Kwon-Sik Kim
Kwon-Sik Kim, Research Fellow, Korea SMEs & Startups Institute, South Korea Research Interests: Regulation, Finance and Government Accounting, Public Policy

Kwang-Hoon Lee
Kwang-Hoon Lee obtained his PhD degree from the Swiss Graduate School of Public Administration (IDHEAP), University of Lausanne, Switzerland.
Notes
1. In response to the global economic downturn, national efforts have been made to create jobs worldwide. In Korea, the employment inducement coefficient of the food manufacturing industry was 17.8 per 1 billion won—the highest among manufacturing industries and higher than the average of 12.9 in all industries (Bank of Korea, Citation2012). In addition, the food manufacturing industry is classified as a market-type senior job business among the job projects for the elderly and is considered an elderly-friendly industry (Korea Labor Force Development Institute for the aged, Citation2012). In addition, the food manufacturing industry has low price elasticity of demand and low income elasticity, so it can be seen as a small- and medium-sized business-friendly industry that is not suitable for mass production. Further, in terms of the total output of agriculture, forestry, fisheries, and food manufacturing, the difference between 2002 and 2012 was 46% to 74% (Bank of Korea, Citation2012).
2. The LQ threshold for specialization is 1, but there are many cases where the value was not set to 1 in previous studies using LQ. 1.25 (Miller et al., Citation2001), 2. (Y.S. Kim et al., Citation2013), and 3. (Isaken, Citation1996; Malmberg and Maskell, Citation2002) are examples (Guillain & Le Gallo, Citation2010).
3. The redistribution of food manufacturing locations has been affected by raw material, market, technological, and financial factors. However, we found that these factors did not affect the concentration and position of the food manufacturing industry in an equal manner. By examining the cost structure of the food manufacturing industry, we found that the geographical location of the establishment of the food manufacturing industry was related to the company’s cost structure and suggested the location type (J. R. Henderson & McNamara, Citation2000; J. V. Henderson, Citation1997).
References
- Agar, C. C., & Manolchev, C. (2020, Mar). Migrant labour as space: Rhythmanalysing the agri-food industry. Organization, 27(2), 251–14. https://doi.org/10.1177/1350508419883379
- Arrow, K. J. (1962). The Economic Implications of Learning by Doing. The Review of Economic Studies, 29, 155–173.
- Bank of Korea. (2012). Economic statistical system, 2010 industry linkage table.
- Boyacι-Gündüz, C. P., Ibrahim, S. A., Wei, O. C., & Galanakis, C. M. (2021). Transformation of the food sector: security and resilience during the COVID-19 pandemic. Foods, 10(3), 497. https://doi.org/10.3390/foods10030497
- Carroll, M. C., Reid, N., & Smith, B. W. (2008). Location quotients versus spatial autocorrelation in identifying potential cluster regions. The Annals of Regional Science, 42(2), 449–463. https://doi.org/10.1007/s00168-007-0163-1
- Connor, J. M., & Schiek, W. A. (1997). Food processing: An industrial powerhouse in transition (2nd ed.). John Wiley and Sons.
- Deller, S. C. (2009). Overview of Firm Location Theory and TRED. In Goetz, S. J., Deller, S. & Harris, T., (Eds.), Targeting regional economic development. Routledge.
- Echegaray, N., Hassoun, A., Jagtap, S., Tetteh-Caesar, M., Kumar, M., Tomasevic, I., Goksen, G., & Lorenzo, J. M. (2022). Meat 4.0: Principles and applications of industry 4.0 technologies in the meat industry. Applied Sciences, 12(14), 6986. https://doi.org/10.3390/app12146986
- Feser, E., Sweeney, S., & Renski, H. (2005). A descriptive analysis of discrete US industrial complexes*. Journal of Regional Science, 45(2), 395–419. https://doi.org/10.1111/j.0022-4146.2005.00376.x
- Fratesi, U. (2008). Issues in the measurement of localization. Environment & Planning A, 40(3), 733. https://doi.org/10.1068/a39223
- Galanakis, C. M. (2021). Functionality of food components and emerging technologies. Foods, 10(1), 128. https://doi.org/10.3390/foods10010128
- Galanakis, C. M., Rizou, M., Turki, M. S., Aldawoud, T. M., Ucak, I., & Rowan, N. J. (2021). Innovations and technology disruptions in the food sector within the COVID-19 pandemic and post-lockdown era. Trends in Food Science & Technology, 110, 193–200. https://doi.org/10.1016/j.tifs.2021.02.002
- Glaeser, E. L., Kallal, H. D., Scheinkman, J. A., & Shleifer, A. (1991). Growth in cities (No. w3787). National Bureau of Economic Research.
- Goetz, S. J. (1997). State-and county-level determinants of food manufacturing establishment growth: 1987–93. American Journal of Agricultural Economics, 79(3), 838–850. https://doi.org/10.2307/1244425
- Guillain, R., & Le Gallo, J. (2010). Agglomeration and dispersion of economic activities in and around Paris: An exploratory spatial data analysis. Environment and Planning B, Planning & Design, 37(6), 961. https://doi.org/10.1068/b35038
- Hassan, M. M., Alenezi, M. S., & Good, R. Z. (2020). Spatial pattern analysis of manufacturing industries in Keraniganj, Dhaka, Bangladesh. GeoJournal, 85(1), 269–283. https://doi.org/10.1007/s10708-018-9961-5
- Hassoun, A., Boukid, F., Pasqualone, A., Bryant, C. J., García García, G., Parra-López, C., Jagtap, S., Trollman, H., Cropotova, J., & Barba, F. J. (2022). Emerging trends in the agri-food sector: Digitalisation and shift to plant-based diets. Current Research in Food Science, 5, 2261–2269. https://doi.org/10.1016/j.crfs.2022.11.010
- Henderson, J. V. (1997). Externalities and industrial development. Journal of Urban Economics, 42(3), 449–470. https://doi.org/10.1006/juec.1997.2036
- Henderson, J. R., & McNamara, K. T. (2000). The location of food manufacturing plant investments in Corn Belt counties. Journal of Agricultural and Resource Economics, 25(2), 680–697.
- Hoover, E. M. (1937). Location Theory and the Shoe and Leather Industries. Harvard University Pres.
- Isaksen, A. (1996). Towards Increased Regional Specialization? The Quantitative Importance of New Industrial Spaces in Norway, 1970-1990. Norsk Geografisk Tidsskrift, 50, 113–123.
- Jacobs, J. (1969). The Economy of Cities. Random House.
- Jeon, N. S. (2013). Gyeongsangnam-do agro-food industry development strategies : Cluster building. Gyeongnam development institute.
- Ketels, C., Sölvell, Ö., Duch, E., Sagrario, I., Folkesson, T., & Lindqvist, G. (2006). Clusters in the EU-10 new member countries. European Commission, DG Enterprise and Industry.
- Kim, S.M., 2009, A Study on Korea’s Food Cluster Policy and Development Plan. PhD thesis. Dankook University Graduate School.
- Kim, S.Y., Byeong-Il, A., Yun-Sik, K., Mi-Sook, L., Gyeong-Su, N., & Su-Min, G. (2009). Potential analysis of food clusters: Focusing on Gyeongnam Region. Agricultural Life Science Research, 43(6), 117–127.
- Kim, Y.S., Ha-Yul, S., Jae-Hong, J., Jun, L., Gyeong Deok, K., Chan-Young, Y., & Ju-Nyeong, H. (2013). Regional development status of food industry and industrial ecosystem fostering plan.
- Kim, H. Y., Kim, J. S., & Lee, S. H. (2012a). Spatial statistical approach for setting city boundaries. Journal of the Korean Geographical Information Society, 15(4), 42–54.
- Kim, J.W., Kim, S.Y., & Yang, S.M. (2012b). A study on the estimation method of industrial cluster effects: Focusing on the case of the National Food Cluster Creation Project. Journal of the Korean Economic Geography Association, 15(1), 42–62. https://doi.org/10.23841/egsk.2012.15.1.42
- Kim, J.H., Park, M.H., & Kim, T.Y. (2004). Formation and Development Direction of Regional Agricultural Clusters. Korea Rural Economic Research Institute.
- Kim, J.H., Park, M.H., & Kim, T.Y. (2004). Formation and development direction of regional agricultural clusters. Korea Rural Economic Research Institute. Research Report, 486.
- Korea Labor Force Development Institute for the aged. (2012). Statistics trends in employment for the elderly in 2012.
- Lambert, D. M., & McNamara, K. T. (2009). Location determinants of food manufacturers in the United States, 2000–2004: Are nonmetropolitan counties competitive? Agricultural Economics, 40(6), 617–630. https://doi.org/10.1111/j.1574-0862.2009.00403.x
- Lambert, D. M., McNamara, K. T., & Garrett, M. I. (2006). Food industry investment flows: Implications for rural development. The Review of Regional Studies, 36(2), 140–162. https://doi.org/10.52324/001c.8315
- Lee, H., & Shim, J. (2011). GIS geospatial science. Beopmunsa.
- Malmberg, A., & Maskell, P. (2002). The Elusive Concept of Localization Economies: Towards a Knowledge-based Theory of Spatial Clustering”. Environment & Planning A, 34(3), 429–450.
- Marshall, A. (1890). Principles of (Economics(8th ed.). Macmillan.
- Miller, P., Botham, R., Gibson, H., Martin, R., & Moore, B. (2001). Report for the Department of Trade and Industry by a Consortium led by Trends Business Research. Business Clusters in the UK–A First Assessment.
- Ministry of Agriculture, Food and Rural Affairs, Ministry of Oceans and Fisheries, 2013, “2012 annual report on agriculture, fishery, rural and food industry”.
- Ohlin, B. (1933). Interregional and International Trade. Cambridge.
- Porter, M. E., 1998. Clusters and the new economics of competition (Vol. 76, No. 6, pp. 77-90). Harvard Business Review.
- Romer, P. M. (1986). Increasing Returns and Long Run Growth. Journal of Political Economy, 94, 1002–1037.
- Rosenberg, N. (1963). Technological Change in the Machine Tool Industry, 1840–1910. The Journal of Economic History, 23, 414–443.
- Scherer, F. M. (1982). Inter-industry Technology Flows and Productivity Growth. The Review of Economics and Statistics, 64, 627–634.
- Shen, S., Zhu, C., Fan, C., Wu, C., Huang, X., & Zhou, L. (2021). Research on the evolution and driving forces of the manufacturing industry during the “13th five-year plan” period in Jiangsu province of China based on natural language processing. PLos One, 16(8), e0256162. Aug 18 PMID: 34407153; PMCID: PMC8372942. https://doi.org/10.1371/journal.pone.0256162.
- Steele, S., Sarcevic, L., Ruskin, G., & Stuckler, D. (2022). Confronting potential food industry ‘front groups’: Case study of the international food information council’s nutrition communications using the UCSF food industry documents archive. Globalization and Health, 18(1). https://doi.org/10.1186/s12992-022-00806-8
- Sun, C., Huang, D., Li, H., Chen, C., Wang, C., Li, M., & Wang, Z. (2021). Green food industry in China: Spatial pattern and production concentration drivers. Frontiers in Environmental Science, 9, 665990. https://doi.org/10.3389/fenvs.2021.665990
- Tobler, W. (1970). A computer movie simulating urban growth in the Detroit region. Economic Geography, 46(Supplement), 234–240.
- Viladecans-Marsal, E. (2004). Agglomeration Economies and Industrial Location: City-level evidence. Journal of Economic Geography, 4(5), 565–582.
- Weber, A., & Friedrich, C. J. (1929). Alfred Weber's Theory of the Location of Industries. University of Chicago Press.
- Yoon, K. H. (1994). Pollution and Management of Food Industry Location- a Case Study in Nebraska, USA. Journal of the Korean Regional Development Association, 6(2), 19–24.