
 ?Mathematical formulae have been encoded as MathML and are displayed in this HTML version using MathJax in order to improve their display. Uncheck the box to turn MathJax off. This feature requires Javascript. Click on a formula to zoom.
Abstract
The swirling transport characteristics of grain particles in bulk grain pipeline after fluidization were studied. A spinning device was designed for the lateral filling pipe. The filling pipe was distributed uniformly along the circumference of the same section of the main pipe, the number was set to 3–7, and the included angles with the main pipe were 20°, 30°, and 40°, respectively. CFD-DEM was used to simulate the swirl transport of grain particles in a horizontal pipeline. The main multiphase inlet velocity was 20 m/s, and the gas velocity was 30 m/s in the side supplementary pipe. By comparing grain conveying speed, flow field pressure drop, and other indicators, it is concluded that when the number of filling pipes is 5, the spiral conveying distance is the longest, the conveying effect is good. By comparing the multiphase flow trajectory, it is concluded that the optimal spiral conveying effect is achieved when the angle between the side filling pipe and the main pipe is 30°. The experimental results show that the number of filling pipes is 5, and the conveying effect is the best when the angle between them and the main pipe is 30°, which is consistent with the simulation results
1. Foreword
At present, the main ways of bulk grain transportation are railway transportation, road transportation, and waterway transportation (Cunrong, Citation2014). In these several modes of transportation, they all need the intervention of grain transit equipments, such as belt machine, grain suction machine, spiral conveyor, and grain running car. However, these equipment transports loose grain will meet grain sprinkling, pests, dust and rats, weather factors, and other problems. In contrast, pipeline pneumatic transportation can effectively solve these problems. When the traditional axial flow pneumatic conveying will block the grain particles due to gravity. Therefore, the cyclone pneumatic transportation is used to solve the problems of pipeline blockage caused by the accumulation of settlement and accumulation of scattered grain particles. The pipeline pneumatic transportation for bulk grain transportation is the future development direction, can realize the grain particles inorganic blend with the environment (Jiawei, Citation2017).
Gas-solid two-phase flow is the essence of pneumatic transportation, which includes the mathematical description of the solid phase and gas phase in the pipeline, the interaction between particles and the wall, the velocity distribution of particles and airflow, etc., and also includes the numerical simulation method of the conveying flow field, gas-solid two-phase measurement technology, and other fields (Blessing & Huixiong, Citation2007; J. Yun, Citation2019)。Salman, for the impact crushing and movement in the pneumatic pipeline, using numerical simulation and test method, based on the lift, drag, gravity, and rotating lift and based on the impact angle, impact speed, particle size, and unbroken particles of the parameters, established the numerical model of the pneumatic conveying in horizontal pipe and elbow (Salman et al., Citation2002, Citation2005)。Narsollahi, on the basis of analyzing the force of shear lift, buoyancy, resistance, rotational lift, torque, and additional mass, established a mathematical model to simulate the one-step particle deposition process, etc. Further, the model was verified through experiments, and obtained the relationship between different Reynolds numbers and particle deposition, and found that the resistance is inversely proportional to the Reynolds number (Nasrollahi et al., Citation2008). Zhou Yun et al. conducted a dense phase pneumatic conveying experiment of pulverized coal with different particle sizes, and the results showed that the conveying pressure was positively correlated with the mass flow of pulverized coal. Under the condition of the same pressure difference, the mass flow of pulverized coal was negatively correlated with the average particle size (Z. Yun et al., Citation2010). However, there is still a lack of research in the field of pneumatic grain transportation.
In addition to the pneumatic transmission of an embolic flow, in order to keep the particles in a suspended state, the strength must have a considerable speed to meet the conditions. Under the action of high-speed airflow, high energy consumption, particle crushing, pipeline blockage, and other problems will occur (Blessing & Huixiong, Citation2007). In order to solve the problems of high energy consumption and blockage, the researchers proposed to use the coupling of axial airflow and tangential airflow to disturb the movement trajectory of particles at high concentration, and inhibit the pipeline blockage and particle settlement, which has practical significance for the pneumatic transmission of various particles. Scholar JJ Derksen in 10 working conditions, from different diameter ratios, flow states, different section position tangential velocity, and axial velocity, comparing the common numerical simulation algorithm and test results, large vortex simulation (LES) is an effective method to calculate the number of vortex flow (Derksen, Citation2005). Sun Xiou studied the hydraulic characteristics, the generation mode of the cyclone, and the theoretical analysis of the suspension of the solid particles in the spinning field, and obtained the relationship between the spinning field and the parameters of the internal helix blade, the relationship between the starting efficiency and the resistance characteristics of the starter, the motion trajectory of the solid particles in the spinning field, and the decay law of the cyclone (Xihua, Citation2000). Zhou Jiawei designed a blade spiral lifting device and applied it to the pneumatic conveying of coal particles. The results proved that the cyclone transport has good conveying performance and energy saving characteristics (J. Zhou et al., Citation0000)。
At present, only a few scholars have studied the characteristics of grain in axial flow pneumatic transport in the transport of loose grain, and the characteristics of loose grain in cyclone transport are still blank in China (Wei et al., Citation2011; Zhihua et al., Citation2010). Therefore, in this study, the side filling air type starting device is adopted, with air as the medium, and the bulk grain particles transfer the flow field in the horizontal pipeline, during which the motion characteristics of the grain particles in the spinning field are studied using CFD-DEM coupling. Through numerical simulation and test, the trend of grain distribution, velocity, flow characteristics, and variation of pipeline pressure drop in cyclone field are revealed, so as to provide reference for cyclone pneumatic transfer of loose grain.
2. Materials and devices
2.1. Material
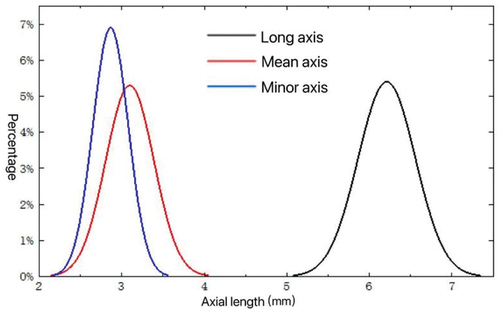
The material was selected from Xinmai 26 in Zhengzhou city, Henan province, and the moisture content was 10.25% (wet base). Wheat grains belong to three axial particles (Fan et al., Citation2018). As shown in Figure , 100 wheat grains were randomly selected, and the three-axis data were measured with vernier caliper as follows (vernier caliper resolution is 0.01 mm, and three axes are long axis, short axis, and central axis). The analysis data show that the triaxial standard deviation of wheat grains is relatively small, indicating that the measured values are less scattered. In order to test whether the three axes of wheat grains conform to the theoretical distribution of statistics, origin drawing software is used to map the measurement results, as shown in Figure , it can be seen that the three axes are normally distributed, so the wheat grains can be generated according to the normal distribution in the simulation.
Figure 1. Three-axis dimensions of wheat.
Figure 2. Triaxial normal distribution of wheat.
In order to reduce the corresponding calculation time, the equivalent diameter of non-spherical particles was used to make the simplified calculation, and the volume factor dominated the pneumatic cyclone transportation of the bulk grain pipeline, so the volume diameter as the equivalent diameter was selected for the experiment. The volume diameter was calculated as follows (Fanyi, Citation2018):
According to Table , the average length of the long axis of the ellipsoid grain is 6.2 mm, and the circle of the short axis and the middle axis is replaced with a diameter of 3 mm. Therefore, the equivalent diameter of wheat particles is 4 mm, Poisson ratio of 0.29, shear modulus of 0.5 GPa, and density of 1350 kg/m3[15]。
Table 1. Results of statistical analysis of wheat
2.2. Analog device
An experimental system for cyclone conveying loose grain is designed, as shown in Figure . The working principle is that the compressed air of the air compressor enters the bin pump through the cold dryer, and the grain particles and air are fully fluidized in the bin pump and then enter the rotation device. After the rotation, the grain enters the cyclone separator through the cyclone experimental pipeline, and the final grain enters the bin.
Figure 3. Schematic diagram of the pneumatic cyclone transmission experimental system of the bulk grain pipeline.
Figures - represents air compressor, 2-gas storage tank, 3-air cold dryer, 4-bin pump, 5-starting device, 6-experimental pipeline, 7-cyclone separator, 8-bin.
As shown in Figure , the device is composed of three parts of incident steady flow section, rotating guide section and rotating flow conveying section. The total length is 11 m, the diameter of the main pipeline D1 is 0.1 m, and the diameter of the side filling pipe of the rotating device D2 is 0.02 m. The incident steady current section distance A is 0.6 m, which is used to stabilize the air flow. The starting device B is connected to the end of the incident steady flow section with a length of 0.4 m, which is the spin guide section. The part connected to the spin guide section is the spin transport experimental part with a length of 10 m. Three measuring C, E, and F points are set in the cyclone conveying section, respectively, located at 1, 5, and 9 meters, take the 11 measuring points in the vertical diameter of the pipe section of the three measuring points, and the ratio of the distance r between the main central axis and the radius of the pipe R is 0, ±0.2, ±0.4, ±0.6, ±0.8, and ± 1, respectively. The advantage of dimensionless r/R is that the relationship between particle location and velocity distribution can be expressed more clearly. When r/R tends to 0 and ± 1, the point is close to the axis and close to the tube wall, respectively.
Figure 4. Cyclone simulation pipeline.
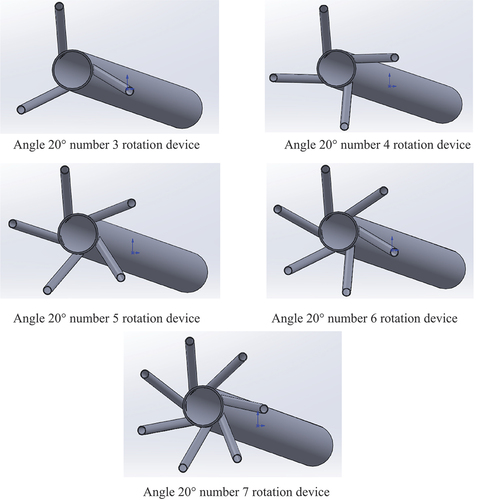
The 3 D diagram of the starting device is shown in Figure . The total length of the main pipe of the designed starting device is 0.4 m, the inner diameter of the main pipe is 0.1 m, the internal diameter of the side filling pipe is 0.02 m, the number of the side filling pipe is 3–7, respectively, and the angle of the central axis and the main pipe is 20°, 30°, and 40°. Figure shows 20° Angle, and the number of filling pipe is 3–7.
Figure 5. Spinning devices of different sizes.
3. Mathematical model
3.1. As for CFD-DEM modelling
The Euler-Lagrangian coupling method is used to model the system to imitate the pneumatic transport process of grain, build solid grain scattered grain into discrete phase and gas phase into continuous phase, and calculate the collision between particles and walls and particles. Coupling is achieved by the mass and momentum of the phases. In this paper, the solid phase is realized by the velocity, position, and linear relationship of each particle, and the gas phase is described by defining the velocity, pressure, and trajectory in the flow field. The computed sequence was modified to include the evaluation of the interphase exchange in the two-phase equation.
The solution of the momentum conservation and mass conservation equations represented by the local mean variable in the gas-phase calculation unit is given as (Chu et al., Citation2011)
Where is the gas density (kg/m3), U is the gas velocity (m/s), and τ is the gas stress tensor (N/m2
), Is the volume fraction of the gas, and g is the gravity acceleration (m/s2), p is the gas pressure (N/m2),FD、FLAnd FMResistance (N), lift (N), and Magnus force (N), respectively.
The translational and rotational motions of grain particles are described by the following equation:
among mpFor the particle mass (kg), upFor the particle velocity (m/s), GpFor gravity (N), IpIs the particle moment of inertia (m4) , ωpFor the particle angular velocity (rad/s), TpFor the particle surface rotation torque (Nm), FCIs the contact force (N).
cause Ergun]and Wen & Yu (Wen & Yu, Citation1966)Resistance F on the particles given by the modelD, The calculation method is:
among,VpFor the volume of a single particle (m3), β is the gas-solid resistance coefficient, which is calculated as:
among dpIs the equivalent diameter (m) of the particle, and the Re is the Reynolds number, CDIs the drag coefficient, and μ is the dynamic viscosity (kg/ms) of the gas.
saffman force FLcause (J. W. Zhou et al., Citation2020; Ji et al., Citation2018)count:
Where du/dy is the shear rate of the average flow rate and CL is the Saffman lift coefficient. Saffman’s lift coefficient is:
among
The Magnus force is calculated from the following equation[20]:
among
Where ω is the angular velocity (rad/s) of the gas.
contact force FCSoft-sphere models were used (Cundall & Strack, Citation1979) Modeling, which is a well-recognized model, has been described in detail by many studies.
3.2. Boundary conditions
The pressure-based Realizable k- ɛ turbulence model and Pressure-Base-based solver are used in the CFD calculation, with the dispersion of the momentum and turbulent diffusion equations based on the QUICK algorithm. The computational domain is a mixture of quadragons and hexahedra of size 10 mm, and the SIMPLEC algorithm of pressure-velocity coupling is used to solve the control equation. In the CFD-DEM coupling solution, the Eulerian-Lagrarian bilateral coupling method is used for calculation, and gun and Wen & Yu drag model, Magnus lift model, Saffman lift model, and the Fluid-induced torque model) model are also used. The calculation time step was set to 1E-5s in the DEM and the CFD calculation time step to 1E-3s. Set the pellet factory type to Unlimited Number and yield the rate to 0.634 kg/s. Using a diameter of 4 mm and a density of 1350 kg/m3, spherical particles with a Poisson ratio of 0.29 and a shear modulus of 0.5 GPa were used for discrete phase modeling. The physical and numerical parameters of the CFD-DEM simulations are shown in Table .
Table 2. Simulation and simulation parameters
4. Results and discussion
4.1. Select the optimal number of side filling trachea
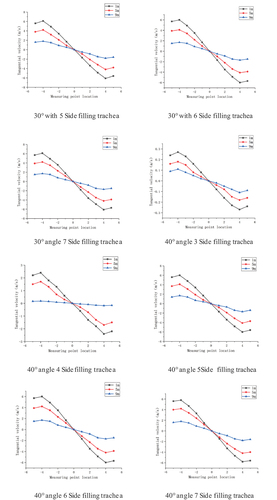
4.1.1. Particle axial velocity
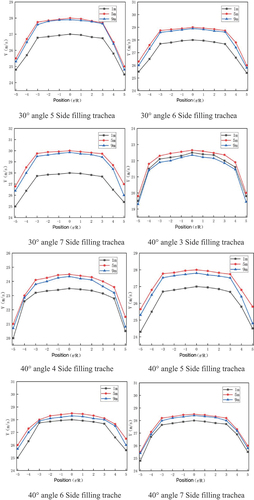
Speed is an important indicator to evaluate whether the pneumatic transmission is good (Jianping et al., Citation2020). After being fluidized by the warehouse pump, the grain forms a two-phase flow quasi-fluid with the air, enters into the conveying pipeline at a speed of 20 m/s, and analyzes the number of the side filling trachea of the rotating device when the wind speed is stable. Figure shows the radial distribution of the axial velocity of the point measured at 1, 5, and 9 meters after the rotation device. In order to highlight the influence of the spinning field on the motion velocity of the particles, a pure axial flow field (no rotation device) is introduced for the comparison. It can be seen from the simulation diagram that the velocity of the particles near the tube wall is relatively low, indicating that the friction between the pipe wall and the grain has an obvious blocking effect. In the pure axial flow field, it can be seen that the velocity of the measuring point is the largest at 1 m, gradually decelerates, and the smallest at 9 m. The reason for this phenomenon is the collision between the particles and the particles, the friction between the pipe wall and the sliding of the grain along the conveying pipeline, so the speed gradually decreases. In the cyclone field, due to the intervention of the spiral current, the grain particles spiral forward, and the axial velocity is symmetrically distributed along the radial direction, with the minimum velocity at 1 m at the measurement point, and then gradually increases.
Figure 6. Axial velocity of tracheal filling number 3–7 at different angles.
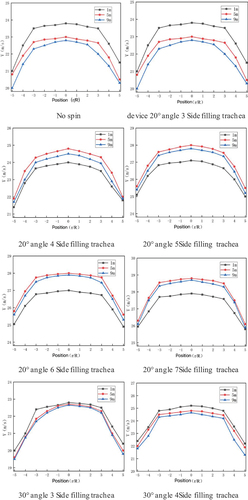
Simulation, in the side trachea number increased from 3 to 5, the axial speed of food in the same measuring point increased steadily, and along the radial symmetry distribution evenly, from 5 to 7, speed changes slightly but the trend is not big, the reason should be too much side trachea number, cause side trachea component over the main component and airflow disorder, although can spin but the effect is not obvious, instead of energy consumption increase, process complex problems. Therefore, the number of five endotracheas from the axial velocity is optimal.
Figure 6. (Continued).
4.1.2. Tangent particle velocity
The tangential distribution of particle velocity at each measured point in Figure The spinless flow field is introduced as a contrast, and since the pure axial flow field has no tangential velocity, the tangential velocity of each measured point is zero. As can be seen from the figure, the tangential velocity of each measured point in the cyclone field is negatively correlated with the transmission distance, which decreases as the distance increases and gradually returns to the axial flow field because of the loss of kinetic energy during the transmission process. The tangential velocity of the particles is small in the center of the pipe and large near the pipe wall, which is symmetrically distributed along the center of the pipe. This is because the cyclone field is closer to the pipe wall and has a relatively small impact on the central area. When different angles under the side trachea number increased from 3 to 5, the maximum speed of 6 m/s, the increase trend is very obvious, but the trachea number increased from 5 to 7, the maximum speed is still about 6 m/s, change degree basically stable, no obvious increase trend, when the trachea increased to 5–7 of grain delivery effect is almost little, from the kinetic energy loss, processing technology, side trachea number five for the best.
Figure 7. Tangential velocity of tracheal filling number 3–7 under different angles.
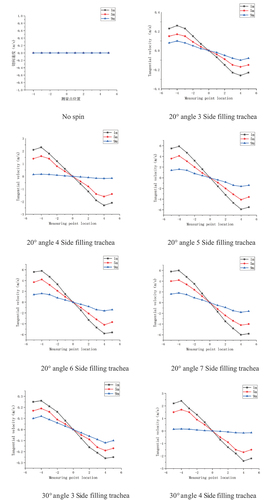
Figure 7. (Continued).
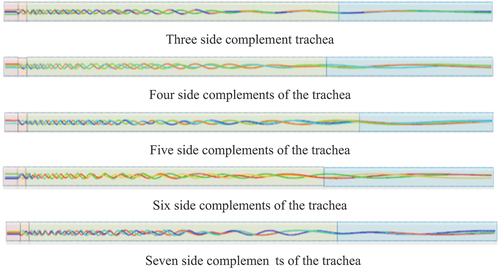
4.2. Flow-field movement trajectory
The main function of the rotation device is to generate the rotation field to couple the axial flow field. Figure is the trajectory diagram of the main internal rotation flow at t = 1 s. The rotation trajectory of different numbers of side filling tracheal rotation devices is obviously different, especially the spiral pitch. When spin device side pipe number is 3–5, spiral pitch from 370 mm to 310 mm, spiral state silky, this is because the dominant is axial flow field, flow field is only auxiliary effect, but with the increase of side pipe number, spin field gradually dominant, this will lead to the reduction of pitch, when the number of air pipe is 5–7, the spiral pitch change is not big, basically stable at 310 mm. It can be seen from the figure that the helical distance is increasing, the pitch is also increasing, and the cyclone field gradually returns to the axial flow field. The reason is that the energy consumption of grain transport, and the friction between the cyclone field and the wall makes the cyclone strength gradually weaken. By comparison, it is found that when the number of the side filling trachea of the starting device is 5, and the spiral movement distance is significantly longer.
Figure 8. Tracks of flow field movement at number of side trachea at t = 1s.
4.3. Static pressure
Static pressure is an important index to evaluate the stability of the system, which refers to the pressure on the surface of the object at a uniform or stationary state. The stability of the system is usually considered in the design of new or improved existing pneumatic delivery units.
4.3.1. Average static pressure
In order to obtain the relationship between the number of side manifolds and the average static pressure and transmission distance, the number of side manifolds of the rotating device was simulated with a constant wind-speed. The simulation results were fitted, as shown in Figure , get a function between pressure drop and distance, in the longitudinal coordinate shows the average static pressure of the starting device at 1,5,9 m of the number of different side trachea, and the abscissa shows from the measuring point 1 to the end of the experimental device, the slope of the fitted line, the smaller the pressure drop.
Figure 9. Static pressure at the measurement point.
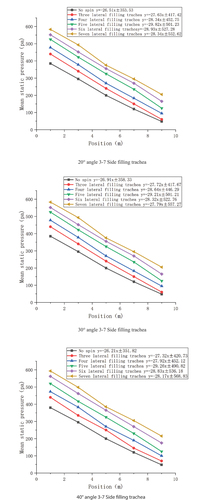
As can be seen from Figure , the average static pressure of the grain pipeline with the starting device is significantly higher than the average static pressure of the pure axial flow pipeline, but the overall trend of both shows a downward trend, due to the decrease in the average static pressure of the air flow into the kinetic energy of the grain. The distance-to-average slope of the average pressure function of the pure axial flow field is the largest, which indicates that the air in the pure axial flow field has less disturbance to the grain particles, and only a small part of the airflow kinetic energy is converted into the kinetic energy of the grain particles, so the flow field is relatively stable.
When the static pressure of the number of filling folds of the rotating device is 3–7, the slope of the fitting function varies from 26.51 to 29.82, because the turbulence of the flow field of the rotating component of the rotating device is different, so the static pressure is not the same, which leads to the change of the slope.
The minimum slope of the fitted curve indicates that the static pressure drop is the largest, and the number of the starting device at the minimum slope is the best. As can be seen in the figure, the slope is small when the number of lateral trachea is 5, so the optimal number of lateral trachea of the rotation device is 5 when the wheat with an equivalent diameter of 4 mm is delivered at the speed of 20 m/s.
4.3.2. Static pressure drop
Electrostatic pressure drop is also a key parameter to describe the stability of the system, and its main side reflects the instantaneous energy consumption of conveying particles. The static pressure drop is mainly related to friction between particles and wall, friction between gas and wall and collision between particles and particles. Figure shows the static pressure drop of the main pipeline on different sides. Figure shows with the increase in the number of trachea, appear first increase after decrease trend, the curve basic quadratic function curve, fitting curve top represents the larger system pressure drop, the right side of the symmetry axis represents the more number of spin device side trachea, this is because the grain particle suspension need lift is larger, lift is provided by the tangential component of the spin field. The large electrostatic pressure drop of the flow field represents the high instantaneous energy consumption of the transmission system. The maximum electrostatic pressure drop of the flow field means that the system has the largest instantaneous energy consumption, the shortest transmission time, and the best transmission effect. The abscissa of the vertex of the fitted curve indicates the number of side folds of the optimal starting device, and the ordinate indicates the static pressure drop. Therefore, from the perspective of static pressure drop, the optimal number of side airways is 5.
Figure 10. Static pressure drop of different device.
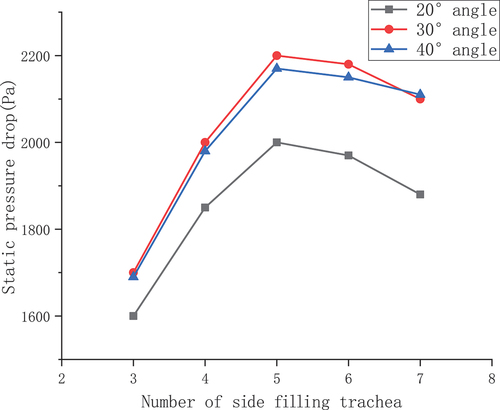
Through the above simulation, the axial velocity, and tangential velocity of particle movements were analyzed. From the comparison of kinetic energy loss, processing technology, and other aspects, the number of side filling pipes was five. By analyzing the flow field trace, it is found that the swirl state is the best when the number of side refill pipes of spinning device is five, and the spiral motion distance is obviously longer. Comparing and analyzing the average static pressure, it can be seen from the fitting curve that the slope is small when the number of side refill pipes is five, and the number of side refill pipes of the optimal spinning device is five. By comparing and analyzing the fitting curve of pressure drop, it can be clearly seen that when the number of side refill pipes is five, the instantaneous energy consumption of the system is the maximum, the conveying time is the shortest, and the conveying effect is the best. In summary, from the comparison and combination of particle velocity, flow field track, and static pressure of pipeline, it is concluded that five is the best number of side refill pipe of spinning device.
4.4. Optimal Angselection between side trachea and main pipeline
According to the empirical value, the selection range of the starting device is generally 15° to 45°, and the selection Angle is 20°, 30°, and 40°. Under the condition of the above simulation results as the background, the quality of the multiphase flow trace is an important indicator to evaluate a mixed flow system. The five airways were simulated at three different angles to obtain the motion trajectory of the multiphase flow. The experimental results are shown in Figure . It can be clearly seen from the figure that the five tracheas with 30° angle spiral tracks are uniform with the best effect.
Figure 11. Polyphase flow trace diagram at different angles.
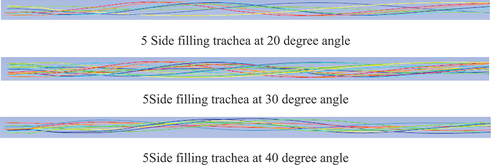
In conclusion, the number of lateral trachea is 5, and the angle of the trachea and the main pipeline is 30°, which is the best result of the starting device parameters.
5. Experiment table verification
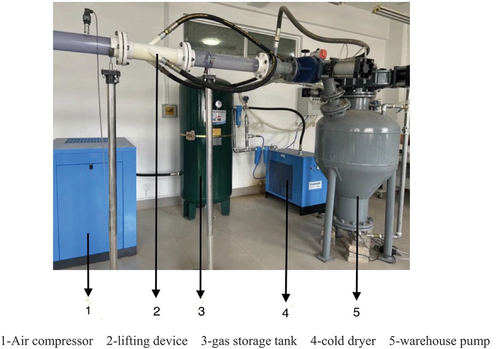
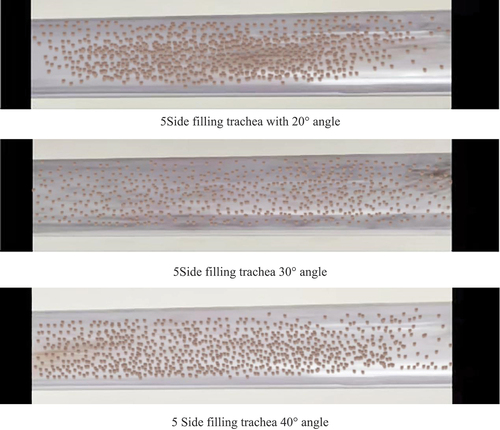
In order to verify the accuracy of the CFD-DEM model and build an experimental platform for verification, five experiments tested the effects of different angles under the side filling trachea. The starting device is shown in Figure with angles of 20°, 30°, and 40°, respectively. Experimental platform equipment building as shown in Figure , the air compressor as screw air compressor, model for BK 22–8 ZG, gas storage tank selected Ann energy technology company 21,540,300 batch products, air dryer choose Zhejiang mountain purification equipment company SAD-3SF products, warehouse pump selection continuation of pressure vessel co., LTD. Shandong XY202108100 products, spin device in the warehouse pump outlet of 1 m, using 3D printing technology. The working principle is that the air is compressed into the air storage tank through the air compressor, and the air output from the air storage tank enters the warehouse pump and the starting device through the air dryer to provide power for the grain output.
Figure 12. 3D Printing a starting device with different angles.
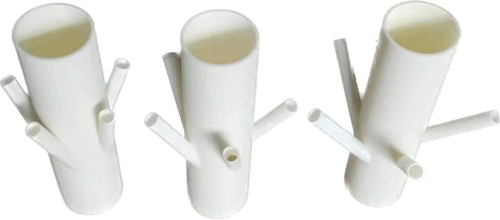
Figure 13. Experimental setup Fig.
It can be clearly seen from the figure that at the Angle of 30°, the grain particle delivery is more evenly distributed, and the effect is optimal. Therefore, the Angle of 30° in the side filling trachea of the starting device is the best Angle.
Figure 14. Test results of different clip angles.
6. Conclusion
In this paper, CFD-DEM numerical simulation and the following conclusions:
When conveying grain using spin transmission effect is better than the axial flow transmission, spin transmission can better solve the problem of grain deposition in the bottom and reduce the grain particles and pipeline friction, conveying the energy consumption of small system, grain dispersion degree is high, fast delivery speed, compared to the axial flow type can be more efficient to complete grain transportation.
Through the CFD-DEM coupling method, the velocity of grain particles, the air pressure and the static pressure difference are calculated, and through the analysis of the multiphase flow trajectory, the optimal angle is 30°. Therefore, the optimal number of the starting device is 5, and the optimal angle with the main pipeline is 30°.
Disclosure statement
No potential conflict of interest was reported by the authors.
Additional information
Funding
Notes on contributors
Kun Shang
Kun Shang is a PhD candidate at Henan University of Technology, Mailing address: Henan University of Technology, Zhengzhou, Henan, China. His research interest covers pneumatic conveying.
Yongxiang Li
Yongxiang Li is professor and doctoral supervisor at Henan University of Technology. His research interest is Advanced Manufacturing Technology and Equipment His research interest is Advanced Manufacturing Technology and Equipment
Xuemeng Xu
Xuemeng Xu, Professor, master supervisor, Henan University of Technology. Mainly engaged in grain, oil and food packaging, transportation technology and equipment research
Yongyu Zhang
Yongyu Zhang, Associate professor at Henan University of Technology. His research interest covers gas-solid multiphase flow
Yingxia Zhang
Yingxia Zhang, Lecturer at Henan University of Technology. She research interest covers gas-solid multiphase flow
References
- Blessing, C., & Huixiong, L. (2007). Multiphase flow and its application. Jiaotong University Press.
- Chu, K. W., Wang, B., Xu, D. L., Chen, Y. X., & Yu, A. B. (2011). CFD–DEM simulation of the gas–solid flow in a cyclone separator. Chemical Engineering Science, 66(5), 834–19. https://doi.org/10.1016/j.ces.2010.11.026
- Cundall, P. A., & Strack, O. D. L. (1979). A discrete numerical model for granular assemblies. Géotechnique, 29(1), 47–65. https://doi.org/10.1680/geot.1979.29.1.47
- Cunrong, W. (2014). Quality and safety problems and countermeasures existing in grain purchase and storage, logistics and transportation. Journal of Food Science and Technology, 32(4), 11–15.
- Derksen, J. J. (2005). Simulations of confined turbulent vortex flow. Computers & Fluids, 34(3), 301–318. https://doi.org/10.1016/j.compfluid.2004.06.001
- Fanyi, L. (2018). Discrete element modeling of wheat particles and short stalks in the cleaning device. Northwest A & F University.
- Fan, L.-S., Zhu, C., Xuexu, Z. (2018). Principle of gas-solid flow. Upper/(US). Science Press. 9787030582720.
- Jianping, L., Zhou, F., Yang, D., Bingchen, Y., & Li, Y. (2020). Effect of swirling flow on large coal particle pneumatic conveying. Powder Technology, 362(C), 745–758. https://doi.org/10.1016/j.powtec.2019.11.112
- Jiawei, Z. (2017). Research on the mechanism and performance of coal particle cyclone pneumatic conveying (pp. 51–55). China University of Mining and Technology.
- Ji, Y., Liu, S. Y., & Li, J. P. (2018). Experimental and numerical studies on dense-phase pneumatic conveying of spraying material in venturi. Powder Technology, 339, 419–433. https://doi.org/10.1016/j.powtec.2018.08.031
- Nasrollahi, A., Salehi Neyshabouri, S. A. A., Ahmadi, G., & Namin, M. M. (2008). Numerical simulation of particle saltation process. Particulate Science and Technology, 26(6), 529–550. https://doi.org/10.1080/02726350802498723
- Salman, A. D., Gorham, D. A., Szabó, M., & Hounslow, M. J. (2005). Spherical particle movement in dilute pneumatic conveying. Powder Technology, 153(1), 43–50. https://doi.org/10.1016/j.powtec.2005.01.023
- Salman, A. D., Houslow, M. J., & Verba, A. (2002). Particle fragmentation in dilute phase pneumaticconveying. Powder Technology, 126(2), 109–115. https://doi.org/10.1016/S0032-59100200048-7
- Wei, W., Qingliang, G., & Jiansheng, Z. (2011). Experimental study on pneumatic transport of pressurized pulverized coal. Journal of Tsinghua University, 51(2), 277–281. https://doi.org/10.16511/j.cnki.qhdxxb.2011.02.005
- Wen, C. Y., & Yu, Y. H. (1966). Mechanics of fluidization. Chemical Engineering Program Symp Service, 62, 100–111. https://doi.org/10.1234/12345678
- Xihua, S. (2000). Study on hydraulic characteristics of spiral flow and particle suspension mechanism of horizontal axial circular tube (pp. 7–13). University of Technology.
- Yun, J. (2019). Study on pneumatic conveying characteristics of long-distance pipeline [D]. China University of Mining and Technology.
- Yun, Z., Xiaoping, C., & Cai, L. (2010). Experimental study on dense-phase pneumatic transport of high-pressure pulverized coal [J]. Journal of Engineering Thermophysics, 31(1), 76–79.
- Zhihua, L., Yanqing, L., Lei, J., & Liu, J. (2010). Based on the design of the optimized carbon black-dense phase pneumatic conveying system. Fluid machinery, 38(2), 41–44.
- Zhou, J., Han, X., Jing, S., & Liu, Y. Efficiency and stability of lump coal particles swirling flow pneumatic conveying system. Chemical Engineering Research & Design, 2–103. https://doi.org/10.1016/j.cherd.2020.03.006
- Zhou, J. W., Shangguan, L. J., Gao, K. D., & Jing, S. X. (2020). Pickup characteristics of lump nonspherical particles in an oscillating airflow. Industrial & Engineering Chemistry Research, 59(31), 14145–14156. https://doi.org/10.1021/acs.iecr.0c03045