
 ?Mathematical formulae have been encoded as MathML and are displayed in this HTML version using MathJax in order to improve their display. Uncheck the box to turn MathJax off. This feature requires Javascript. Click on a formula to zoom.
Abstract
This study examines the relationship between agricultural GDP growth and government spending on input subsidies, agricultural research, price support programs and infrastructure development in Zambia, Malawi and South Africa. The study compiled government expenditures to different agricultural areas from the year 2000 to 2014 using a variety of data sources such as government budgets, public expenditure reviews, and working papers. The Augmented Dickey-Fuller test was used for unit root testing and the variables were found to be non-stationary at their levels but stationary after differencing. After testing for co-integration among the variables, the error correction model (VECM) was then employed using the Stata software to assess the impact of government spending components on agricultural GDP growth. The study found agricultural research expenditure to be more growth-enhancing only in Zambia and South Africa. A positive relationship was obtained between agricultural growth and infrastructure expenditure in Zambia and Malawi while spending on infrastructure in South Africa had a lower growth impact. Even though spending on input subsidies in Malawi positively influenced agricultural GDP, contradicting results were observed in Zambia and South Africa. The study recommends the governments in the three countries shift their spending priorities and disburse more funds to more growth-enhancing areas. This study differs from previous studies in that it disaggregates total government expenditure into four crucial components that dominate budgetary expenditures in Sub-Saharan countries and examines as well as compares their impact on agricultural growth.
PUBLIC INTEREST STATEMENT
Government spending is a crucial key to achieving growth in most developing countries. Since 2003, the African Union has been encouraging African countries to raise agricultural expenditures to at least 10% of their national budgets. Several African countries have been working towards meeting this target by increasing their agricultural expenditures. However, only a few have managed to surpass the 10% mark since 2003. The total agricultural expenditure is normally disaggregated into different areas depending on the priorities of the country. There is scarce research on the assessment of the impact of different spending components on economic growth. The current paper selected four crucial spending components that dominate the budgets in Zambia, Malawi as well as South Africa and investigates their impacts on agricultural growth. The paper also examines the misallocation of budget funds in these three countries by comparing the government spending priorities against their impacts on agricultural growth. The governments can gain insight from this study and shift their spending priorities to more growth-enhancing areas.
Most of the world’s poor people earn their living from agriculture, so if we knew the economics of agriculture, we would know much of the economics of being poor
1. Introduction
Government spending on the agricultural sector is regarded as one of the direct and effective tools for enabling economic growth as well as eliminating poverty and hunger in the continent (Bahta et al., Citation2014; Mwabutwa & Pauw, Citation2017). African governments over the past decades have been disbursing large amounts of money from their national budgets to the agricultural sector intending to increase farm productivity. This increased productivity is expected in turn to reduce food insecurity in the continent Cervantes-Godoy and Dewbre, (Citation2010). Improved agricultural growth through government spending can also help achieve various objectives such as the Sustainable Development Goals (SDGs) of 2015 which build on the Millennium Development Goals (MDGs) of 2000. The first two of these goals include eliminating both hunger and poverty by 2030 (OECD, Citation2014; Soyeju, Citation2015:363; Terlau et al., Citation2019).
As governments are focusing on increasing their public agricultural expenditure, there is a need for more investigation into the different areas to allocate such spending. Over the past years, there have been debates on which area should receive more funding to maximize the economic growth of a country (Jayne & Rashid, Citation2013). In poor countries, governments mainly intervene through input subsidies and price support programs to enhance social welfare and growth (Hemming et al., Citation2018; Mason et al., Citation2013; Van De Walle, Citation1998). Government spending through subsidies or price supports can be justified by the fact that they arise as a result of the related market failure. Governments usually intervene by subsidizing services that the market is failing to provide or is providing but not efficiently (Mason et al., Citation2020; OECD, Citation2022).
Many studies have argued that the greatest contribution to economic growth and poverty reduction comes from investments in infrastructure such as irrigation and road development (Calderón & Servén, Citation2004; Edeme et al., Citation2020; Gemmell et al., Citation2012; Llanto, Citation2012; Wu et al., Citation2019; Xin et al., Citation2022). Several other studies have suggested that spending money on research has proved to be more beneficial in the long run than input subsidies (Asare & Essegbey, Citation2016; Ouru et al., Citation2018; Fan & Saurkar, Citation2006; Alene and Coulibally, Citation2009; Seck et al., Citation2013; Stads & Beintema, Citation2015; Weißhuhn et al., Citation2018).
Reaching an agreement on these debates and discussions has proved futile over the past years. According to Jayne and Rashid (Citation2013), the main reason that has led to this elusiveness when it comes to reaching an agreement regarding government spending in Africa is the differences in values, interests, worldviews and beliefs. To contribute to these arguments and debates, this study assesses the relationship between agricultural GDP growth and government spending on input subsidies, agricultural research, price support programs and infrastructure development in Zambia, Malawi and South Africa using the error correction approach. Thus, determining what drives growth among the different types of government spending. A deeper understanding of the impact of government on economic growth can contribute to policy solutions, which consequently promote economic development. Governments will have an intuitive understanding of which areas they should disburse more money to achieve sustainable economic growth.
2. Economic theories on government intervention
The section reviews the economic theories that have dominated the field of development economics over the last 60 years in trying to understand the intervention of the government in the economy. The evolution of thought from the classical Laissez-Faire to Keynesian economics to the Washington Consensus to CAADP commitments is assessed to provide insight into the role of the government in stimulating growth. Success stories have been witnessed because of these different schools of thought, concerning poverty reduction, improved standards of living for citizens, basic education for children, access to clean water and improved life expectancy (Barder, Citation2012). However, these theories failed to agree on the government’s role in the economy.
Various economists have argued that government investment in areas such as infrastructure development and human capital can boost economic growth in a country. On the other hand, government interference in markets through public spending has been associated with several negative externalities (Chiawa et al., Citation2012; Hemming et al., Citation2018; Mallick, Citation2008; Torruam et al., Citation2014). Economists continue to criticize government intervention in the economy, especially through public spending programs such as subsidies. At the macroeconomic level, this intervention is associated with rent-seeking and crowding effects of private sector investments. At the microeconomic level, public spending results in net losses to society often referred to as deadweight losses (Alston & James, Citation2002; OECD, Citation2014; Pindyck & Rubinfeld, Citation2013; Sie et al., Citation2021; Summer, Citation2008).
Classical economists, being opponents of fiscal policy, call for minimum state intervention in the economy. Classical economics stems from the works of various economists in the late 18th and early 19th centuries including Adam Smith, David Ricardo, John Stuart Mill, and Jean-Baptiste Say. Classical economic theory recommended free markets for economic stability, based on Adam Smith’s “The Wealth of Nations” (Baumol & Blinder, Citation2011; Smith, Citation1976). The Laissez-Faire philosophy behind the classical economic theory suggested that buyers and sellers should be in control of the market. Say’s law in support of the Laissez-Faire approach indicated that any distortions are temporary and will return to balance without government intervention (Nomaler et al., Citation2021; Say, Citation1971; Steven, Citation2003). In the classical school of thought, the role of the government was considered productive in areas such as adult education and the army.
The great depression of 1929–1939 caused a decline in national incomes, output levels, and employment rates. Classical economics believed that an economy could achieve potential output and full employment without government intervention, but this was not the case (Romer, Citation1990; Wheelock, Citation2008). The notion that a free competitive economy without government intervention leads to full employment was brought into question after the great depression (Galbraith, Citation2009). After the classical theory failed to explain the huge unemployment rates that resulted from the great depression, Keynes (Citation1936) proposed a new theory of economics that emphasized the role of the state in the economy. Keynesian economics together with other proponents of government spending argued that fiscal policy is essential for economic stability and higher long-term growth (Aschauer, Citation1989; Del Regil, Citation2021; Todaro & Smith, Citation2012; Wheelock, Citation2008).
Several economic growth theories were established in the post-Keynesian era, which attempted to understand the role of the state in the growth of a country. The Harrod-Domar model, developed by Roy Harrod and Evsey Domar in 1939, showed that the output of a country is dependent on the quantity of capital and labor (Barder, Citation2012). The Harrod-Domar growth theory contends that an economy cannot achieve full employment and stable growth through the Laissez-Faire approach, which is in line with Keynes’ ideas (Domar, Citation1946; Harrod, Citation1939). Their growth theory supported the idea that the government should play a role in promoting growth. Government intervention is necessary to boost the savings rate of an economy in emerging nations where savings levels typically are low under a free market system.
After the Harrod-Domar growth theory failed to explain why some countries grow faster than other countries, Solow (Citation1956) established neo-classical economics in the late 1950s. Solow’s neo-classical economics decomposed economic growth into three components: labor force, capital accumulation and technical progress. The theory has provided insight into the role of governments in development economics, with wealthy countries channeling aid toward developing infrastructures in developing countries (Durlauf et al., Citation2000; Pelsa & Balina, Citation2022; Sato, Citation1963).
Government policies that interfered with the proper functioning of markets were seen as the main cause of low economic growth in poor countries (Barder, Citation2012). The Washington Consensus was introduced in 1989 to reduce the role of government in the economy, making use of reforms perceived by the World Bank and IMF as crucial for stimulating economic growth in developing countries (Babb & Kentikelenis, Citation2021; Spence, Citation2021; Williamson, Citation2004). Being an opponent of Keynesian economics, the Washington Consensus dominated the period from the 1980s to the 1990s as it sought to reduce subsidies and reallocate public spending towards services such as education, health and infrastructure development. The Washington Consensus crumbled in the late 1990s, leading to African governments abandoning structural adjustment programs and re-establishing their previous positions in providing support programs (Naim, Citation2000; Spence, Citation2021).
As African governments began to re-engage in the agricultural markets, AU member states adopted the Comprehensive Africa Agricultural Development Programme (CAADP) with the overall objective of reducing poverty and attaining food security. The adoption of the CAADP in 2003 together with other declarations such as the Abuja Declaration of 2006 and the Malabo Declaration of 2014 indicates that African governments still believe they have a huge role to play in stimulating economic growth (IFPRI, Citation2013). Since 2003, The CAADP served as the framework for action to transform agriculture in Africa by encouraging nations to boost their percentage shares of agricultural spending by up to 10% (Benin, Citation2018; Kimenyi et al., Citation2012). In light of the notion that increasing agricultural spending in the sector can enhance economic growth and development, this study aims to contribute to the recent literature by assessing the investment areas which can stimulate more growth in agriculture. Determining the components of public expenditure that are more growth-enhancing for the agricultural sector, will help governments to be effective in their budget allocations in the future.
3. Methodology
3.1. Study areas and data collection
The determinants of growth vary depending on the country of study so it is more beneficial to analyze different countries. This will enable one to have a better understanding of how economic growth is influenced by expenditures across countries. This study focused on 3 African countries in which the data on the composition of agricultural expenditures was found for a specific period. The countries under study include Zambia, Malawi and South Africa. A quantitative approach was used for this study and an effort was made to include actual budgetary expenditures as provided by those countries. The data on agricultural spending used in this study were largely taken from various sources including working papers, Ministry of Finance sites, Department of Treasury sites and budget speeches.
The government expenditures were collected in local currencies; therefore, they were converted into a value aggregate expressed in terms of international dollars. These conversions aimed to make the different monetary variables comparable across the 3 countries. The study used the exchange rates measured in purchasing power parity PPP) to convert the local currency expenditures measured in terms of 2005 prices. Data on 2005 purchasing power parity for the countries were collected from the World Bank (World Bank (Citation2015a). The expenditures were first adjusted for inflation before being divided by the PPP exchange rates. The prices were first deflated from current local currency expenditures to a set of base-year prices using the implicit GDP deflator for each country.Footnote1
This section reports on the various sources that were used to collect the data as well as explanations of how the data was collected. The study relied on secondary data for all the variables considered in the regression model. Agricultural GDP was used as a proxy for agricultural growth in this study. Data on agricultural value added (constant at 2005 US$) was collected from the World Development Indicators and the FAO databases (FAO, Citation2018)
The FAO database was also used as the source of data on private investment in this study. Data on Gross Fixed Capital Stock (constant 2005 prices—Million US$) was used as a proxy for private investment. The study also collected data on exports and imports from the International Trade Centre (ITC) website to generate the trade openness variable.Footnote2
3.2. Empirical framework and model specification
Even though different measures have been used to understand the impact of government spending, this study used agricultural GDP growth as the dependent variable. Economic growth is a good measure as it can be considered to be fundamental for sustainable growth. According to Saad and Kalkechi (Citation2009), a better quality of life can be experienced when there is increased economic growth. The study also chose growth to be the dependent variable because many governments are working towards improving economic growth which can be considered to be the most powerful tool for ending both hunger and poverty in developing countries (Bahta et al., Citation2014:48).
A multi-linear equation of the effects of government spending on agricultural GDP growth is then constructed below in Equationequation 1(1)
(1) . According to Wooldridge (Citation2012:712), natural logs can be introduced in an equation to impose a constant percentage effect of a covariate on the dependent variable.
Therefore, this study made use of natural logs to linearize the growth model so that the effect of each predictor variable will be explained in terms of percentage change in agricultural GDP.
Where
is the Agricultural GDP in current period t
3.3. Methods of estimation and data analysis
Most of the studies that have attempted to link public expenditure and growth have come across challenges including the possibility of reverse causality as well as endogeneity of variables (Antonakis et al., Citation2014:5; Bellemare et al Citation2015:6 Hoover, Citation2006:2). The essential problem with reverse causality and endogeneity is that they both result in a correlation between the explanatory variables and the error term in the equation. Antonakis et al. Citation2014:5 regarded endogeneity as the main threat to getting consistent estimates.
Estimating the regression equation without taking into consideration the possibility of reverse causality and endogeneity will lead to biased estimates and spurious correlations. A coefficient might be significant and reflect the expected relationship but in the presence of endogeneity, there will be inconsistency. This means the estimates will not reflect the true population parameters. Various analytical techniques have been developed to overcome the challenges of endogeneity and reverse causality. Some of the techniques that have been proposed in previous years to test for reverse causality include the differencing approach and the instrumental approach. Chipaumire et al. (Citation2014:112) estimated the causality relationship between government spending and growth in South Africa using the Granger causality test.
In times series analysis, the concepts of stationarity and weak dependence play a significant role. Therefore, before applying the tests for endogeneity and causality, the study initially tested for stationarity in the series. When there is stationarity, the mean and variance of the series will remain constant over the time series i.e. there will be no trend. The differencing approach is usually used when the time series is found to be non-stationary i.e. having a unit root (Salih, Citation2012:41, Wooldridge, Citation2012:396).
The Augmented Dickey-Fuller test was employed in this study to test for unit root using the Stata software. The differencing technique was then applied using Stata commands to those series that were non-stationary to de-trend the data and transform the series to stationary. To understand the long-term relationship between agricultural spending types and agricultural growth, the Johansen test for co-integration was then employed. Co-integration exists between variables if they are non-stationary at their level but stationary after differencing (Johansen, Citation1988). According to Wooldridge (Citation2012:646–654), either the vector autoregressive model (VAR) or the vector error correction model can be used for estimation after testing for co-integration among variables.
If the variables are co-integrated, the Vector Error correction model is favorable instead of the VAR model. A study by Chauke et al. (Citation2015:246) is one example that made use of the error correction model to estimate the relationship between government spending and agricultural GDP in South Africa and Zimbabwe. Therefore, in this study after testing for co-integration among the variables, the VECM was proposed.
A general VECM model with one explanatory variable (x) is written below:
Where yt is a K×1 random vector
Xt is an M×1 vector of exogenous variables
B1 to Bp are KxK matrices of parameters
X1 to xp is KxM matrices of coefficients
is white noise, P is the lag length
is the first difference operator
V is the vector of constants
Therefore, the logged variables already explained in equation 3 in the empirical framework section above, are then placed into the VECM model to give the following equation:
4. Results and discussions.
4.1. Descriptive results
4.1.1. Changes in agricultural GDP from 2000 to 2014
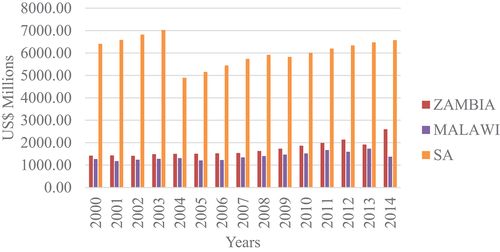
Figure illustrates a graphical exposition of agricultural GDP used in the study as a measure of agricultural growth. South Africa, having the highest growth among the three countries, showed an increase in agricultural GDP before sloping down in 2003 from US$ 7000 million to US$ 5000 million in 2004. However, South Africa showed a slow decline in its agricultural growth after the 2008 recession. Zambia was second in terms of agricultural growth during the early years, displaying a gradual increase in agricultural GDP since 2000. Malawi, being in the third position in terms of their agricultural GDP, showed a steady increase since 2000.
Figure 1. Changes in agricultural GDP across the three countries since 2000.
4.1.2. Changes in agricultural investment from 2000 to 2014
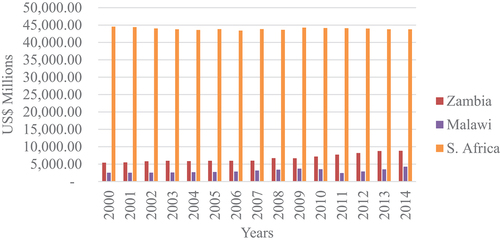
Government involvement has been associated with crowding out private investment; however, it is equally fair to understand both the trends in private investment in these countries and how that private investment influences growth. Figure displays the trends in private investment for the three different countries. Data shows that private investment is more important in South Africa than in the other two countries. South Africa had an average of about US$ 43 000 million for the period 2000 to 2014. All the countries showed steady trends in private investment without much fluctuations from year to year. There is still a need for improvement in Malawi when it comes to investment by private companies in the agriculture sector. The graph shows Malawi having a maximum of about US$4000 million invested in agriculture, which is lower when compared to South Africa, and Zambia.
Figure 2. Changes in private investment across the three countries since 2000.
4.1.3. Changes in net trade balance from 2000 to 2014
The relationship between net trade and growth has been a subject of much debate and controversy over the past years. Some studies suggested a positive relationship between the two macroeconomic variables (Ahmad et al., Citation2012; Ahmad, Citation2013). The study examined trends in the net trade balance in agriculture for the three countries since 2000 and tried to assess its impact on growth. The aim is to contribute to the available literature regarding the contribution of net exports toward economic development based on the regression results.
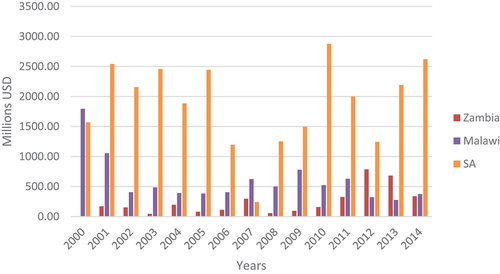
Figure reflects changes in net trade across the three countries measured as the difference between the total value of exports and the total value of imports. The total agricultural products excluded fisheries and forestry products. The trends reflect many fluctuations in the balance of trade in these three countries from 2000 to 2014. The graph shows the South African economy has more net trade balance since 2000 than the rest of the countries under study. A steep increase was seen by South Africa as it rose from a value of approximately 1560 million USD in 2000 to a value of approximately 2400 million USD in 2005. A steady downward slope was then witnessed after 2005. Figure indicates Malawi has a better balance of trade on agricultural products in its economy than Zambia. The lower trade balances witnessed in Zambia, especially in the early 2000s indicate many trade restrictions in these countries. These restrictions result in inefficient production by discouraging farmers from making long-term investments. Restrictions on trade such as banning the exportation of maize deter the private sector from investing in the agricultural sector through input supply marketing of crops.
Figure 3. Changes in net trade across the three countries since 2000.
4.2. Trends in the composition of agricultural expenditures from 2000 to 2014
4.2.1. Changes in the actual agricultural expenditures in Zambia since 2000
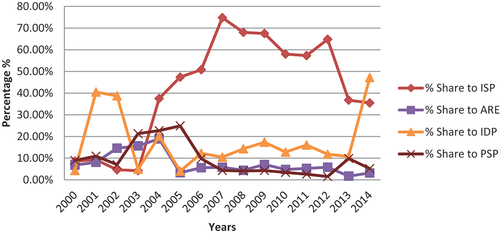
Figure displays the trends in different types of agricultural expenditures in Zambia since 2000. As can be seen, the agriculture sector in Zambia is largely dominated by allocations to ISPs and PSPs. The FSP and FRA are the major Poverty Reduction Programs in Zambia receiving a combined allocation of at least 45% each year. Subsidy programs have the largest share of the budget for the period of study which shows the government’s commitment to providing fertilizers and improved seeds to smallholder farmers. Fluctuations can be noticed in the % share of ISPs since 2000 and this can be attributed to various economic factors. The government of Zambia has also been focusing on assisting small-scale farmers by purchasing maize at subsidized prices to ensure the continuous production of corn in the country. The government’s continuation to carry the burden of the local farmers can be seen by allocations to FRA which had the second-largest share in Figure since 2000 except for periods 2002 and 2003.
Figure 4. Zambia % shares of agricultural expenditure types.
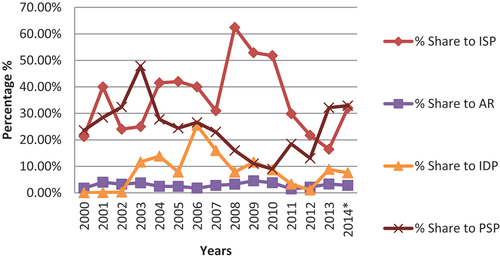
However, economists regard this cost to the government as inefficient and recommend other types of expenditure such as infrastructure and research. As depicted in Figure , a very small proportion of the agricultural budget has been going toward agricultural research. This is contrary to the commitment of the government as stated in the Fifth National Development Plan (FNDP) to allocate about 12.5 percent share to agricultural research. Research programs have been receiving the lowest share compared to the three other types. It has an average share of 2.9% for the period of study with the highest share being 4.54% in 2009.
Long-term investments in infrastructure development programs (IDP) are considered to be the top-rank priority of the government of Zambia in the National Development Plan. Therefore, a significant amount of money is seen being disbursed towards improving roads, rural electrification and irrigation systems. However, this commitment is not reflected by the % shares to IDP in Figure when compared with other agricultural programs. IDP continues to be the third among the 4 agricultural programs in terms of its share of the agricultural budget.
4.2.2. Changes in the actual agricultural expenditures in Malawi since 2000
Figure represents the changes in agricultural budget allocation to different programs in the sector since 2000. ISPs have been receiving the largest share which is far above the other agricultural programs. A major boost was given by the inception of FISP in 2005 which saw the % share skyrocketing to 74.8%. A small decline then followed afterward; nevertheless, the % share of ISPs remained above 50%. PSPs occupied the second position in terms of their share of the agricultural budget in earlier years. A decline was then witnessed lowest in its percentage shares from the year 2007.
Figure 5. Malawi % shares of agricultural expenditure types.
In line with the objectives of the Economic Recovery Plan (ERP) and MGDs in Malawi, the government has been releasing funds for agricultural research and extension programs. Research and extension programs have been second in terms of their % share allocation in earlier years reaching up to 20% in 2004 but a decline was seen after 2005. This shows that the introduction of the FISP in 2005 was at the expense of other agricultural programs as it shifted its attention to focus more on targeted subsidies. However, the government continued to support infrastructure development programs even after 2005 because of its commitment to Priority Poverty Expenditures (PPEs).
4.2.3. Changes in the actual agricultural expenditures in South Africa since 2000
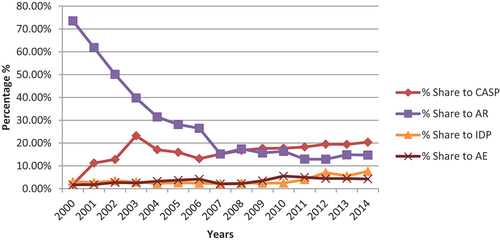
Figure below shows the trends in % shares of the South African agricultural budget to Comprehensive Agriculture Support Program (CASP), agricultural research, infrastructure development and agricultural extension. South Africa has been committed to agricultural research more than the other programs as it can be witnessed that the program had the largest share of the budget for the 1st half of the period of study. However, the government became more concerned with assisting the beneficiaries of land and agrarian reforms in recent years. The CASP program now takes the largest share of the agricultural budget with over 20% share. Agricultural extension and infrastructure development have the least share of budget allocations among the four components as shown in Figure .
Figure 6. SA % share of agricultural expenditure types.
4.3. Empirical results
Using total government expenditures may not be the best test of the impact of government spending on growth. This is because if the expenditure is disaggregated, some components of the total spending are likely to be more beneficial to growth than others. Therefore, this study highlighted the different contributions of the different types of expenditures on growth.
The study carried out Unit Root testing using the ADF test for each of the 3 countries in STATA before proceeding to the Johansen test of co-integration. All the variables were found to have unit roots at level therefore first differencing was done to make the variables stationary. Since the variables were only stationary after differencing, it was necessary to perform the cointegration test to examine whether they are co-integrated or not. The co-integration analysis proved there is a long-run relationship between the variables, which then became the basis for carrying out the VECM. The results from the Vector Error Correction model are explained below.
4.3.1. Results for Zambia
The VECM applied in this study gives results for both the short-run period and the long-run period. After the model was run in STATA, all the variables were found to be insignificant in the short run. This can mean that expenditures on these programs have no immediate effect but can take time for their impact to be seen on growth. However, a different story was witnessed with the results in the long run as shown in Table .
Table 1. Long-run impact of agricultural spending on agricultural growth in Zambia
In this study trade openness and private investment were found to be insignificant in the long run. Mixed empirical results have been found in previous studies concerning the relationship between private investment and economic growth. Several studies have concluded that private investment boosts economic growth (Barro, Citation1990; Benin et al., Citation2009; Khan & Reinhart, Citation1989). However, a study by Udoh (Citation2011) found an insignificant relationship between private investment and growth. Previous studies have also found contradicting results concerning the impact of net trade on economic growth. Silwal (Citation2008) found no significant relationship between net trade and growth while Ahmad (Citation2013) found a negative relationship in the long run. Studies by Balassa (Citation1978) and Ahmad et al. (Citation2012) showed a positive relationship between trade balance and economic growth.
The coefficient on the log of the agricultural research variable (z_arL) is 0.7175947 as shown in Table . This means a 1% increase in research expenditure results in an increase in agricultural growth by 0.72%, ceteris paribus. The results in this study support various studies that found spending on agricultural research to be positively related to agricultural growth (Fan & Saurkar, Citation2006; Asare & Essegbey, Citation2016; Ouru et al., Citation2018; Weißhuhn et al., Citation2018). Investing in agricultural research such as new machinery and new improved seeds can have a positive influence on agricultural growth. The local farmers can improve their productivity if they adapt to the use of the new technology thus enhancing agricultural growth in the long run.
Table shows the infrastructure spending variable (z_giL) with a coefficient of 0.0236264 meaning a 1% increase in infrastructure spending can result in a 0.02% increase in growth, ceteris paribus. A study by Shrestha (Citation2009) found similar results where investing in infrastructure was more growth-enhancing in Nepal. Different kinds of literature have also pointed out that investing in infrastructure development such as roads, electricity and irrigation can enhance growth in the long run (Edeme et al., Citation2020; Llanto, Citation2012; Wu et al., Citation2019; Xin et al., Citation2022). Access to better roads can improve local farmers’ access to markets and making use of irrigation reduces the risk of depending on rain-fed agriculture (Sunkanmi & Abayomi, Citation2014). Therefore, improving infrastructure can result in increased agricultural growth. However, spending on agricultural research has a higher coefficient (0.7175947) than spending on infrastructure (0.0236264) indicating that research expenditure is more growth-enhancing than infrastructure expenditure in the case of Zambia.
As shown in Table , the study found a negative relationship between agricultural growth and ISPs as well as PSPs. A 1% increase in spending on ISPs and PSPs is associated with a 0.69% and 0.35% decrease in agricultural growth respectively, ceteris paribus. These results are similar to those found by Armas et al. (Citation2012) where spending on input subsidies had a negative impact on agricultural growth in Indonesia. Most economists have associated spending on ISPs and PSPs with growth reduction in the agricultural sector. These two types of spending result in crowding out of private investment and are associated with rent-seeking (Hemming et al., Citation2018; Torruam et al., Citation2014).
4.3.2 Results for Malawi
Table shows the results of the VECM model which was run in STATA. In the long run spending on PSPs and Trade openness of the economy were found to insignificantly influence agricultural growth. The results are consistent with the work of Silwal (Citation2008) who found no relationship between trade balance and growth in Nepal. While PSPs negatively impacted agricultural growth in Zambia as indicated above, no significant relationship was found in Malawi. This indicates that the influence of these variables on economic growth differs with the location or region.
Table 2. Long-run impact of agricultural spending on agricultural growth in Malawi
Malawi also shows different results from Zambia concerning the relationship between agricultural expenditure on research and growth. In Table , the coefficient on agricultural research and extension (m_areL) is −0.641043. This means a 1% increase in expenditure on research and extension in Malawi is associated with a 0.6% decline in agricultural growth, ceteris paribus. This result is unexpected as it is well known that making use of new technology can enhance productivity. However, it is also an issue when it comes to the adoption of that new technology, especially by smallholder rural farmers. Many of them tend to be afraid to invest in new equipment as well as new seeds and therefore dwell on traditional methods which are less productive. Therefore, the negative sign on the research and extension might be due to the resistance of these farmers in accepting the new technology and new methods proposed by extension services hence in the long run the growth in agriculture will tend to decline. Contrary to this study, various other studies found a positive relationship between research expenditure and growth (Alene & Coulibaly, Citation2009; Seck et al., Citation2013; Stads & Beintema, Citation2015; Weißhuhn et al., Citation2018).
Similar to Zambia, infrastructure spending in Malawi has a positive influence on agricultural growth (Table ). A 1% increase in infrastructure expenditure in Malawi is associated with a 0.35% increase in agricultural growth, ceteris paribus (m_idpL is 0.3510447). Several previous studies also found a positive relationship between spending on infrastructure and growth (Calderón & Servén, Citation2004; Gemmell et al., Citation2012; Llanto, Citation2012; Wu et al., Citation2019).
In Table there is a positive relationship between agricultural growth and ISPs as well as PSPs. As depicted in Table , a 1% increase in PSP spending results in a 0.18% increase in growth while a 1% increase in ISP spending is associated with a 0.47% increase in growth, ceteris paribus. Even though subsidies and price supports are associated with crowding out of the private investment (Chiawa et al., Citation2012); in the case of Malawi, they tend to enhance growth. The results of the study are consistent with the Malawi Miracle of 2006 where the massive input subsidies from the government boosted real GDP growth (Javdani, Citation2012). Continuous funding by the government to the local farmers can increase their productivity as they will diversify and invest their profits in other non-agricultural activities. Therefore, in the long run, the farmers become less dependent on the government thus improving agricultural growth.
In the context of the Malawi economy, when comparing the coefficients in Table , spending on subsidies is more growth-enhancing followed by spending on infrastructure and followed by price support spending
4.3.3. Results for South Africa
Similar to Zambia, the VECM model used to analyze data on South Africa also found trade openness and investment to be insignificant. Kelly (Citation1997) and Phetsavong and Ichihashi (Citation2012) found conflicting results where private investment positively affected growth. On the other hand, a study by Blavasciunaite et al. (Citation2020), using panel data for 28 countries, found a negative relationship between trade balance and economic growth. Ali et al. (Citation2015) also found net trade to negatively influence economic growth in the Pakistan economy. On the contrary, Moyo and Garidzirai (Citation2022) carried out a study across African countries and found that trade balance is positively related to growth.
Surprisingly spending on infrastructure in South Africa has a negative relationship with agricultural growth as shown in Table . The coefficient on the infrastructure development expenditure variable (s_idpL) is −0.3060379 meaning an increase in spending on infrastructure by 1% will result in a decrease in agricultural growth by 0.3%, ceteris paribus. According to Devarajan et al. (Citation1996:322), if a negative relationship is witnessed between a component of spending and economic growth, it does not necessarily mean that the expenditure is unproductive. This might mean that the growth is taking time to respond to the changes in infrastructure spending. Shrestha (Citation2009), as well as Sunkanmi and Abayomi (Citation2014), are among the previous studies that found spending on infrastructure to be positively related to GDP growth.
Table 3. Long-run impact of agricultural spending on agricultural growth in SA
A positive relationship between spending on CASP and agricultural growth is witnessed in Table . A 1% increase in spending on CASP is associated with a 0.22% increase in agricultural growth, ceteris paribus. CASP provides various support services to smallholder farmers and the beneficiaries of land reform. These services will ensure that the farmers have access to inputs, infrastructure as well as markets necessary to increase their productivity and hence improve agricultural growth (Mncina & Agholor, Citation2021).
Similar to the results found in Zambia, spending on agricultural research in South Africa positively enhances growth. An increase in research expenditure by 1% results in an increase in growth of 1.26% while a 1% increase in extension results in a 0.067% increase in growth. In the context of South Africa, research expenditure was more growth-enhancing followed by spending on CASP and lastly agricultural extension expenditure. Trade openness had a positive influence on agricultural growth in South Africa where a 1% increase in trade balance led to a 0.029% increase in growth, ceteris paribus.
4.4. Impact of spending against government priorities
Table summarizes the government spending priorities in the three countries against their impact on agricultural growth. As indicated in Table , agricultural research in Zambia is receiving the least priority from the government yet it is more growth-enhancing than any other area of spending. The study found that ISPs and PSPs negatively impact growth in Zambia, however, these two spending areas are receiving more priority from the government. The government of Malawi has been disbursing more money to ISPs and IDPs as indicated in Table . These two areas of spending have also proved to be more growth-enhancing in Malawi than in other spending areas. In recent years the government of South Africa has been spending more money on the CASP followed by agricultural research. However, the study results showed that spending on agricultural research tends to boost growth more than any other area in South Africa.
Table 4. A comparison of government spending priorities against the impact on growth
5. Conclusion and recommendations
Using several data sources, including government budgets, public expenditure evaluations, and working papers, the study aggregated government spending in various agricultural areas between the years 2000 and 2014. Unit root testing was performed using the Augmented Dickey-Fuller test, and it was discovered that the variables were non-stationary at their initial levels but stationary after differencing. The error correction model (VECM) was then used using Stata to evaluate the impact of government expenditure components on agricultural GDP growth after testing for co-integration among the variables.
Mixed and conflicting results were found in this study on the relationship between agricultural growth and expenditure components across the three countries. The study revealed that agricultural research spending had a positive impact on agricultural growth in Zambia and South Africa. In contrast, agricultural research in Malawi had a negative impact on agricultural growth. While infrastructure spending in South Africa had a lesser growth impact, the study found a positive relationship between agricultural growth and expenditures in Zambia and Malawi. Even though spending on input subsidies had a favorable impact on agricultural GDP in Malawi, contradicting results were observed in Zambia and South Africa.
The study also found some conflict between the regression results and governments’ spending priorities which indicates the misallocation of funds. It is recommended that the governments of the three countries change their spending priorities and allocate more money to sectors that will promote agricultural growth. In the case of Zambia, the study recommends a shift in government priorities from ISPs and PSPs that have a negative impact on growth to areas such as agricultural research and infrastructure development which tends to boost agricultural growth more. The study recommends the government of Malawi to continue prioritizing its spending on ISPs because they are more growth-enhancing than other sub-sectors, according to study regression results. It is recommendable for the government of South Africa to shift its spending priorities towards agricultural research which is more growth-enhancing than all the other areas of spending.
6. Limitations and future research
The study considered only three countries in the Sub-Saharan region due to the availability of data in these countries. Therefore, there is a lack of regional diversity. The agricultural spending types influence growth differently from country to country and from region to region. Therefore, it would be inaccurate to apply the recommendations given for the countries in this study to another country. It is recommended that future studies include even more countries in their analysis. Cross-country analysis will make it easier for governments to prioritize their spending to relevant sectors of the economy thus improving growth and tackling poverty in the continent.
Time series analysis is sensitive to the number of years used in the model and results that are more effective can be achieved if more years are considered in the model. Data availability limited the number of years considered in this study to the period 2000 to 2014. However, governments are now improving their fiscal transparency and providing more data on the actual amounts of money released. Therefore, it will be more effective for future studies to consider more years in their analysis.
Disclosure statement
No potential conflict of interest was reported by the authors.
Additional information
Funding
Notes on contributors

Newettie Jambo
Newettie Jambo is an agricultural economist. He is a lecturer in the Department of Agricultural Economics and Development at Manicaland State University of Applied Sciences in Zimbabwe. He obtained his MSC degree in Agricultural Economics at the University of Stellenbosch in South Africa. Newettie is a researcher with a keen interest in achieving rural development and improving rural livelihoods through enhancing the productivity and incomes of smallholder farmers in developing countries. His research interests include rural development, econometrics, development economics and behavioral economics.
Mr. Newettie Jambo (Lecturer at Manicaland State University of Applied Sciences)
Lulama Traub
Newettie Jambo is an agricultural economist. He is a lecturer in the Department of Agricultural Economics and Development at Manicaland State University of Applied Sciences in Zimbabwe. He obtained his MSC degree in Agricultural Economics at the University of Stellenbosch in South Africa. Newettie is a researcher with a keen interest in achieving rural development and improving rural livelihoods through enhancing the productivity and incomes of smallholder farmers in developing countries. His research interests include rural development, econometrics, development economics and behavioral economics.
Mr. Newettie Jambo (Lecturer at Manicaland State University of Applied Sciences)
Lulama Traub is a senior lecturer in the Department of Agricultural Economics at Stellenbosch University, Stellenbosch, South Africa. She holds a Master’s degree in Agricultural Economics from Michigan State University (MSU). Lulama’s current research interests include; outreach and capacity building programs in collaboration with Southern African universities and government agencies, mainly focusing on staple food marketing and trade policies and their effects on sustainable and equitable development.
Notes
1. Each of the 3 countries had a different base year.
2. Trade Openness is the sum of exports and imports divided by GDP in the agricultural sector.
References
- Ahmad, N. (2013). The role of budget deficit in the economic growth of Pakistan. Global Journal of Management and Business Research Economics and Commerce, 13(1), 1–5. https://journalofbusiness.org/index.php/GJMBR/article/view/1028
- Ahmad, N., Joyia, U. T. S., & Luqman, M. (2012). Exports and economic growth in Pakistan: Evidence from ordinary least squares and Granger causality tests. Asian Journal of Research in Business Economics and Management, 2(9), 61–18. https://mpra.ub.uni-muenchen.de/id/eprint/49395
- Alene, A. D., & Coulibaly, O. (2009). The impact of agricultural research on productivity and poverty in sub-Saharan Africa. Food Policy, 34(2), 198–209. https://doi.org/10.1016/j.foodpol.2008.10.014
- Ali, S., Naz, A., & Yaqub, R. M. S. (2015). Impact of FDI and trade balance on economic growth during 1990-2014, a case study of Pakistan. Historical Research Letter, 25(4), 25–29. ISSN 2225-0964. https://www.iiste.org/Journals/index.php/HRL/article/view/26373
- Alston, J. M., & James, J. S. (2002). Chapter 33 the incidence of agricultural policy. In B. L. Gardner & G. C. Rausser (Eds.), Handbook of agricultural economics (Vol. 2, pp. 1689–1749). https://doi.org/10.1016/S1574-0072(02)10020-X
- Antonakis, J., Bendahan, S., Jacquart, P., & Lalive, R. (2014). Causality and endogeneity: Problems and solutions. In The oxford handbook of leadership and organizations (pp. 93–117). Oxford University Press. https://doi.org/10.1093/oxfordhb/9780199755615.013.007
- Armas, E. B., Osorio, C. G., Dodson, B. M., & Abriningrum, D. E. (2012). Agriculture public spending and growth in Indonesia. World Bank Policy Research Working Paper 5977.
- Asare, R., & Essegbey, G. O. (2016). Funding of agricultural research and development in Ghana: The case of Council for Scientific and Industrial Research (CSIR). Technology and Investment, 7(2), 40. https://doi.org/10.4236/ti.2016.73008
- Aschauer, D. A. (1989). Is public investment productive? Journal of Monetary Economics, 23(2), 177–200. https://doi.org/10.1016/0304-3932(89)90047-0
- Babb, S., & Kentikelenis, A. (2021). Markets everywhere: The Washington consensus and the sociology of global institutional change. Annual Review of Sociology, 47(1), 521–541. https://doi.org/10.1146/annurev-soc-090220-025543
- Bahta, Y. T., Willemse, B. J., & Grove, B. (2014). The role of agriculture in welfare, income distribution and economic development of the free State province of South Africa: A CGE approach. Agrekon, 53(1), 47–74. https://doi.org/10.1080/03031853.2014.887905
- Balassa, B. (1978). Exports and economic growth: Further evidence. Journal of Development Economics, 5(2), 181–189. https://doi.org/10.1016/0304-3878(78)90006-8
- Barder, O. (2012). Development and complexity. Presentation and podcast made at CGD. Available online: http://www.cgdev.org/doc/CGDPresentations/complexity/player.html.
- Barro, R. (1990). Government spending in a simple endogenous growth model. Journal of Political Economy, 98(5), 103–125. https://doi.org/10.1086/261726
- Baumol, J. W., & Blinder, A. S. (2011). Economics: Principles and policy (12th ed.). Mason-USA.
- Bellemare, M. F., Masaki, T., & Pepinsky, T. B. (2015). Lagged explanatory variables and the estimation of causal effects. Available at SSRN: http://ssrn.com/abstract=2568724.
- Benin, S. (2018). From Maputo to Malabo: How has CAADP fared? ReSAKSS Working Paper 40, International Food Policy Research Institute,
- Benin, S., Mogues, T., Cudjoe, G., & Randriamamonjy, J. (2009). Public expenditures and agricultural productivity growth in Ghana. International Association of Agricultural Economists, Conference, Beijing, China, August 2009, pp. 16–22.
- Blavasciunaite, D., Garsviene, L., & Matuzeviciute, K. (2020). Trade balance effects on economic growth: Evidence from European Union Countries. Economies, 8(3), 54. https://doi.org/10.3390/economies8030054
- Calderón, C., & Servén, L. (2004). The effects of infrastructure development on growth and income distribution. World Bank Policy Research Paper, WPS 3400. World Bank,
- Cervantes-Godoy, D., & Dewbre, J. (2010). Economic Importance of Agriculture for Poverty Reduction. OECD Food, Agriculture and Fisheries Papers 23, OECD Publishing, Paris. https://doi.org/10.1787/5kmmv9s20944-en
- Chauke, P. K., Manyise, T., Francis, A., Pfumayaramba, P. K., Raidimi, E. N., & Maiwanashe, A. (2015). Comparative impact of public expenditure on agricultural growth: Error correction model for SA and Zimbabwe. Journal of Human Ecology, 50(3), 245–251. https://doi.org/10.1080/09709274.2015.11906880
- Chiawa, M. A., Torruam, J. T., & Abur, C. C. (2012). Co-integration and causality analysis of government expenditure and economic growth in Nigeria. International Journal of Scientific and Technology Research, 1(8), 165–174. http://www.ijstr.org/final-print/sep2012/Cointegration-And-Causality-Analysis-of-Government-Expenditure-And-Economic-Growth-In-Nigeria.pdf
- Chipaumire, G., Ngirande, H., Mangena, M., & Ruswa, Y. (2014). The impact of government spending on economic growth: Case South Africa. Mediterranean Journal of Social Science, 5(1), 109–118. https://doi.org/10.5901/mjss.2014.v5n1p109
- Del Regil, A. (2021). Keynesian economics and the welfare state. Revista Internacional de Salarios Dignos, 3(1), 86–115. https://repositorio.lasalle.mx/handle/lasalle/2582
- Devarajan, S., Swaroop, V., & Zou, H. (1996). The composition of public expenditure and economic growth. Journal of Monetary Economics, 37(2), 313–344. https://doi.org/10.1016/0304-3932(96)01249-4
- Domar, E. D. (1946). Capital expansion, rate of growth, and employment. Econometrica, 14(2), 137–147. Accessed on November 2016 Available online http://www.jstor.org/stable/1905364
- Durlauf, S. N., Kourtellos, A., & Minkin, A. (2000). The local solow growth model. European Economic Review, 45(4), 928–940. https://doi.org/10.1016/S0014-2921(01)00120-9
- Edeme, R. K., Nkalu, N. C., Idenyi, J. C., & Arazu, W. O. (2020). Infrastructural development, sustainable agricultural output and employment in ECOWAS countries. Sustainable Futures, 2, 100010. https://doi.org/10.1016/j.sftr.2020.100010
- Fan, S., & Saurkar, A. (2006). Public spending in developing countries: Trends determination and impact. Working Paper, IFPRI.
- FAO. (2018). Ending extreme poverty in rural areas. Food and Agriculture Organization of the United Nations. Available at. http://www.fao.org/3/CA1908EN/ca1908en.pdf
- Galbraith, J. K. (2009). The great crash 1929. Mifflin Harcourt: Houghton.
- Gemmell, N., Kneller, R., & Sanz, I. (2012). Does the composition of government expenditure matter for economic growth? Retrieved April 20, 2015. Available online: http://www.victoria.ac.nz/sacl/about/cpf/research/pdfs-research/1GKSOECDPubExp-and-Growth.pdf.
- Harrod, R. F. (1939). An essay on dynamic theory. The Economic Journal, 49(193), 14–33. Available online http://www.jstor.org/stable/2225181
- Hemming, D. J., Chirwa, E. W., Dorward, A., Ruffhead, H. J., Hill, R., Osborn, J., & Phillips, D. (2018). Agricultural input subsidies for improving productivity, farm income, consumer welfare and wider growth in low‐and lower‐middle‐income countries: A systematic review. Campbell Systematic Reviews, 14(1), 1–153. https://doi.org/10.4073/csr.2018.4
- Hoover, K. D. (2006). Causality in economics and econometrics (2nd ed.). Palgrave Macmillan.
- IFPRI (International Food Policy Research Institute). (2013). Agricultural Science and Technology Indicators (ASTI) database. https://www.asti.cgiar.org/data/.
- ITC. (2015). International trade centre calculations based on UN COMTRADE statistics. Retrieved August 4, 2014. Available online: http://www.trademap.org.
- Javdani, M. (2012). Malawi’s agricultural input subsidy: Study of a green revolution-style strategy for food security. International Journal of Agricultural Sustainability, 10(2), 150–163. https://doi.org/10.1080/14735903.2012.675731
- Jayne, T. S., & Rashid, S. (2013). Input subsidy programs in Sub-Saharan Africa: A synthesis of recent evidence. International Association of Agricultural Economists, 44(6), 547–562. https://doi.org/10.1111/agec.12073
- Johansen, S. (1988). Statistical analysis and co-integrating vectors. Journal of Economic Dynamics and Control, 12(2–3), 231–254. https://doi.org/10.1016/0165-1889(88)90041-3
- Kelly, T. (1997). Public expenditures and growth. The Journal of Development Studies, 34(1), 60–84. https://doi.org/10.1080/00220389708422503
- Keynes, J. M. (1936). General theory of employment, interest and money. Palgrave Macmillan.
- Khan, M. S., & Reinhart, C. M. (1989). Private investment and economic growth in developing countries. International Monetary Fund, Research Department.
- Kimenyi, M. S., Routman, B., & Westbury, A. (2012). CAADP at 10: Progress toward agricultural prosperity. Policy Paper, Africa Growth Initiative at Brookings.
- Llanto, G. M. (2012). The impact of infrastructure on agricultural productivity. PIDS Discussion Paper Series, No. 2012-12. Philippine Institute of Development Studies,
- Mallick, H. (2008). Government spending, trade openness and economic growth in India: A time series analysis. eSocialSciences Working Paper, 1809.
- Mason, N. M., Jayne, T. S., & Mofya-Mukuka, R. (2013). Zambia’s input subsidy programs. Agricultural Economics, 44(6), 613–628. https://doi.org/10.1111/agec.12077
- Mason, N. M., Wineman, A., & Tembo, S. T. (2020). Reducing poverty by ‘ignoring the experts’? Evidence on input subsidies in Zambia. Food Security, 12(5), 1157–1172. https://doi.org/10.1007/s12571-020-01032-z
- Mncina, S. D., & Agholor, A. I. (2021). Comprehensive agricultural support programme as the prime mover of agricultural development agenda in South Africa. South African Journal of Agricultural Extension, 49(1), 122–140. https://doi.org/10.17159/2413-3221/2021/v49n1a10782
- Moyo, C., & Garidzirai, R. (2022). Trade balance and economic growth: Evidence from African countries. International Journal of Trade and Global Markets, 15(4), 497–515. https://doi.org/10.1504/IJTGM.2022.125935
- Mwabutwa, C., & Pauw, K. (2017). Tracking agricultural spending when government structures and accounting systems change: The case of Malawi. African Journal of Agricultural and Resource Economics, 12(2), 111–124. http://www.afjare.org/resources/issues/vol_12_no2/2.%20Mwabutwa%20Pauw.pdf
- Naim, M. (2000). Washington consensus or Washington confusion? Foreign Policy, 118(118), 86–103. https://doi.org/10.2307/1149672
- Nomaler, Ö., Spinola, D., & Verspagen, B. (2021). R&D-based economic growth in a super multiplier model. Structural Change and Economic Dynamics, 59, 1–19. https://doi.org/10.1016/j.strueco.2021.07.002
- OECD. (2014). Government support for agriculture”, in OECD factbook 2014: Economic, environmental and social statistics, OECD Publishing. Accessed March 2015. Available online: https://doi.org/10.1787/factbook-2014-92-en.
- OECD. (2022). Subsidies, competition and trade, OECD competition policy roundtable background note. http://www.oecd.org/daf/competition/subsidies-competition-and-trade-2022.pdf.
- Ouru, L. W., Kibet, L., Kalio, A., & Mose, N. (2018). Effect of research and development on agricultural sector growth in the East African community. Journal of Development and Agricultural Economics, 10(2), 45–54. https://doi.org/10.5897/JDAE2017.0873
- Pelsa, I., & Balina, S. Development of economic theory–from theories of economic growth and economic development to the paradigm of sustainable development. (2022). DIEM: Dubrovnik International Economic Meeting, 7(1), 91–101. Sveučilište u Dubrovniku. https://doi.org/10.17818/DIEM/2022/1.10
- Phetsavong, K., & Ichihashi, M. (2012). The impact of public and private investment on economic growth: Evidence from developing Asian countries. IDEC Discussion paper, Hiroshima University.
- Pindyck, R. S., & Rubinfeld, D. L. (2013). Microeconomics (8th ed.). Pearson Education, Inc.
- Romer, P. M. (1990). Are non-convexities important for understanding growth. The American Economic Review, 80(2), 97–103. http://www.jstor.org/stable/2006550
- Saad, W., & Kalkechi, K. (2009). The nature of government expenditure and its impact on sustainable economic growth. Middle Eastern Finance and Economics, 1(4), 39–45. https://www.researchgate.net/profile/Wadad-Saad/publication/255634788_The_Nature_of_Government_Expenditure_and_its_Impact_on_Sustainable_Economic_Growth/links/55bc68e908aec0e5f4419aba/The-Nature-of-Government-Expenditure-and-its-Impact-on-Sustainable-Economic-Growth.pdf
- Salih, M. A. R. (2012). The relationship between economic growth and government expenditure: Evidence from Sudan. International Business Research, 5(8), 40–46. https://doi.org/10.5539/ibr.v5n8p40
- Sato, R. (1963). Fiscal policy in a neo-classical growth model: An analysis of time required for equilibrating adjustment. The Review of Economic Studies, 30(1), 16–23. https://doi.org/10.2307/2296026
- Say, J. B. (1971). A treatise on political economy or the production, distribution and consumption of wealth (first ed.). 1803. A.M. Kelley Publishers.
- Schultz, T. (1979). The economics of being poor. Journal of Political Economy, 88(4), 639–651. https://doi.org/10.1086/260895
- Seck, P. A., Agboh-Noameshie, A., Diagne, A., & Bamba, I. (2013). Repackaging Agricultural research for greater impact on agricultural growth in Africa. Journal of Food Security, 1(2), 30–41. https://doi.org/10.12691/jfs-1-2-4
- Shrestha, P. K. (2009). The composition of public expenditure, physical infrastructure and economic growth in Nepal. Economic Review, 21, 79–95. https://doi.org/10.3126/nrber.v21i1.52806
- Sie, S. J., Kueh, J., Abdullah, M. A., & Mohamad, A. A. (2021). Impact of public spending on private investment in Malaysia: Crowding-in or crowding-out effect. Global Business & Management Research, 13(2), 28–42. https://ir.unimas.my/id/eprint/35423/ .
- Silwal, R. (2008). The causes of trade deficit of Nepal. An unpublished masters of arts thesis. Institute of Social Studies, Available online: https://thesis.eur.nl/pub/6726/Rajan%20Silwal%20ECD.pdf.
- Smith, A. (1976). An inquiry into the nature and causes of the wealth of nations, (R.H. Campbell, A.S. Skinner & W.B. Todd, Eds.). Clarendon Press.first publication 1776. https://doi.org/10.1093/oseo/instance.00043218
- Solow, R. M. (1956). A contribution to the theory of economic growth. Quarterly Journal of Economics, 70(1), 65–94. https://doi.org/10.2307/1884513
- Soyeju, O. (2015). Making a case for a development-driven approach to law as a linchpin for the post-2015 development Agenda. Potchefstroom Electronic Law Journal, 18(2), 363–396. https://doi.org/10.4314/pelj.v18i2.10
- Spence, M. (2021). Some thoughts on the Washington consensus and subsequent global development experience. Journal of Economic Perspectives, 35(3), 67–82. https://doi.org/10.1257/jep.35.3.67
- Stads, G. J., & Beintema, N. Agricultural R&D expenditure in Africa: Analysis of growth and volatility. (2015). European Journal of Development Research, 27(3), 391–406. Available online. https://doi.org/10.1057/ejdr.2015.25
- Steven, K. (Ed.). (2003). Two hundred years of say’s law: Essays on economic theory’s most controversial principle. Edward Elgar.
- Summer, D. A. (2008). Agricultural subsidy programs the concise encyclopedia of economics. Library of economics and liberty. Retrieved September 7, 2015. Available online: http://www.ecolib.org/library/Enc/AgriculturalSubsidyPrograms.html.
- Sunkanmi, O. A., & Abayomi, O. O. (2014). Testing public expenditure and poverty reduction nexus in Nigeria. Development Country Studies, 4(6), 116–122. https://www.iiste.org/Journals/index.php/DCS/article/view/11790
- Terlau, W., Hirsch, D., & Blanke, M. (2019). Smallholder farmers as a backbone for the implementation of the sustainable development goals. Sustainable Development, 27(3), 523–529. https://doi.org/10.1002/sd.1907
- Todaro, M. P., & Smith, S. T. (2012). Economic development (11th ed.). Pearson.
- Torruam, J., Chiawa, M., & Abur, C. (2014). Co-integration analysis of public expenditure on tertiary education and economic growth in Nigeria. Journal of Applied Statistics, 5(2), 137–146. https://dc.cbn.gov.ng/jas/vol5/iss2/7/
- Udoh, E. (2011). An examination of public expenditure, private investment and agricultural sector growth in Nigeria: Bounds testing approach. International Journal of Business & Social Science, 2(13), 285–291. https://ijbssnet.com/journals/Vol._2_No._13_Special_Issue_July_2011/34.pdf
- Van De Walle, D. (1998). Assessing the welfare impact of public spending. World Development, 26(3), 365–379. https://doi.org/10.1016/S0305-750X(97)10064-X
- Weißhuhn, P., Helming, K., & Ferretti, J. (2018). Research impact assessment in agriculture. A review of approaches and impact areas. Research Evaluation, 27(1), 36–42. https://doi.org/10.1093/reseval/rvx034
- Wheelock, D. C. (2008). The federal response to home mortgage distress: Lessons from the great depression. Federal Reserve Bank of St Louis Review, 90(3), 133–148. https://doi.org/10.20955/r.90.133-148
- Williamson, J. (2004). The strange history of the Washington consensus. Journal of Post Keynesian Economics, 27(2), 195–206. https://doi.org/10.1080/01603477.2004.11051438
- Wooldridge, J. M. (2012). Introductory econometrics. A modern approach (5th ed.). South-Western Cengage Learning.
- World Bank. (2015a). World development indicators, Washington D.C. 2015 data: PPP (constant 2005 international $). http://data.worldbank.org/indicator/PA.NUS.PPP
- Wu, Q., Guan, X., Zhang, J., & Xu, Y. (2019). The role of rural infrastructure in reducing production costs and promoting resource-conserving agriculture. International Journal of Environmental Research and Public Health, 16(18), 3493. https://doi.org/10.3390/ijerph16183493
- Xin, X., Wu, H., & Shan, T. (2022). Rural infrastructure and poverty in China. PLos One, 17(6), e0266528. https://doi.org/10.1371/journal.pone.0266528