
Abstract
The wellbeing of millions of Ghanaians hinges on food security. As the country strives to meet the United Nations Sustainable Development Goals Agenda 2030, fish consumption must be sustained. Predicting the future trends of fish consumption and supply is of significant importance to policy-makers and fisheries managers to better anticipate future demands, plan actions to effectively meet them and sustainably manage the fisheries. The present study seeks to quantify the future and historical fish consumption (consumption per capita and apparent consumption), production (captures, aquaculture, and commodities) and fish trade (imports) estimate and projections from 2017 to 2030. We obtained data from the Ministry of Fisheries and Aquaculture Development, Fisheries Scientific Survey Division, Ghana Statistical Services, United Nations International Trade Statistics Database, Organisation for Economic Co-operation and Development, World Bank, FishStatJ, Food and Agriculture Organization online query panels, and other online publications. Our analyses showed that fish consumption will continue to fluctuate with an expected highest peak of 905,400 tonnes by 2028 and drop to 889,096 by 2030. Overall consumption is expected to average 839,272 tonnes from 2019 to 2030, growing at an annual rate of 0.61% from 2017 to 2030. Per capita fish consumption is expected to decrease slightly, reaching 23.93 kg by 2030. Growth in capture fisheries will be very slow at 0.06%, while aquaculture is expected to grow at 6.58%. In terms of fish supply, capture fisheries, aquaculture, and imports are expected to contribute 45%, 9%, and 46%, respectively. Pelagic fish import is expected to be 392,450 tonnes, making up 96.4% of all fish imports by 2030. The need for Ghana to be self-sufficient in fish production and reduce imports by sustainably managing the small pelagic fishery should be paramount. To achieve sustainable fish production, supply, and consumption, the study suggests that there is a need to urgently accelerate aquaculture development, reduce unstainable harvest levels, and ensure general improvement in the fisheries management practices.
1. Introduction
Food and nutrition security continues to be an agenda for the Government of Ghana and the global community. With a projected population of 37 million by 2030 (Worldmeters, Citation2019), the production and consumption of animal protein must be critically examined. Trends in the prevalence of undernourishment and severely food-insecure populations over the past few years are raising serious food security concerns. The prevalence of undernourishment has increased from 1.3 million in 2011 to 1.7 million people in 2017, with a severely food-insecure population rising from 2.2 million in 2014 to 2.3 million people in 2018 (FAO, Citation2019). These trends together with the growing human population present daunting food security challenges to stakeholders; government, scientists, local and international organizations, and the general population at large. In addressing this, the great task is how to sustainably provide adequate, high-quality, accessible, and affordable animal protein to meet the demand of present and future populations. Fortunately, the fisheries and aquaculture sector offers an enormous opportunity to expand food and nutrition security with minimal detrimental effects on the environment (FAO online query, Citation2020).
Fish is the cheapest and most consumed animal protein (60%) in Ghana. Fish and fishery products of different species are traded and readily available for consumption throughout the country. The most encountered forms are fresh, smoke-salted, dried, salt-dried, canned, fried, or grilled (Asiedu et al., Citation2018; FAO, Citation2014, Citation2016; MOFAD, Citation2015). Demand and taste preference for fish is very high, with 75–80% of fish caught consumed locally (FAO, Citation2016; MoFAD, Citation2015). Furthermore, fish demand has increased rapidly over the past few years, growing from 960,000 tonnes in 2010 to 1.1 million tonnes in 2018 (MoFAD, Citation2018). Within the same period, per capita fish consumption increased from 24.2 kg to 27.9 kg at a rate of 1.6 percent per annum (MoFAD, Citation2018). Currently, per capita fish consumption stands at 28 kg (FAO online query, Citation2020), much higher than the current per capita consumption of Africa and the world at 10.5 kg and 20.2 kg, respectively (FAO, Citation2016; 2022). The rising demand for fish is attributed to the fact that fish offers a major source of high-quality and cheapest protein relative to the prices of other high-quality protein sources such as milk, meat, and eggs. In terms of total food consumption, cash expenditure and home produced, food fish accounted for 22.1% of the total mean annual food consumption in 2016, far higher than meat (9.4%), milk, cheese, and eggs (2.8%) combined (GSS, Citation2014). Similarly, fish made up 22.4% of total household food expenditure, and 24.6% in poor households (Quaye, Citation2018). Despite the significant role of fish in the nutrition of both poor and rich households in Ghana, the production sector is facing serious sustainable challenges and putting millions of the population at risk. Notable challenges are climate change (Lam et al., Citation2012), illegal, unreported and unregulated fishing, declining catches, and household income in the small-scale subsector. These will thwart the collective effort to attain zero hunger, nutrition security, good health and well-being, no poverty, and protect life below water of the UN Agenda 2030 (MoFAD, Citation2015).
Understanding and predicting the future trends of fish consumption and supply is of significant importance to policy-makers and fisheries managers to better anticipate future demands, plan actions to effectively meet them and enhance sustainable fisheries management. The objective of this paper is to present an analysis of present and prospective fish consumption in Ghana. Specifically, we focus on; supply, demand, production, and per capita consumption in the context of population growth by the year 2030.
2. Material and methods
2.1. Area
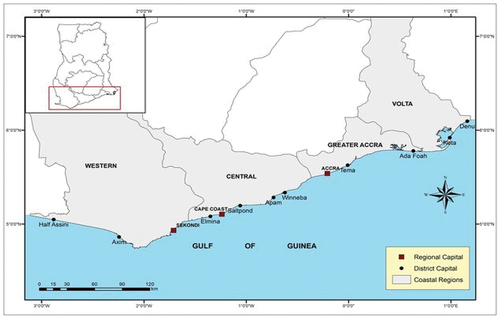
The Republic of Ghana was the focus of this study. Ghana has a coastline of 550 km which is divided into four regions (Volta, Greater Accra, Central and Western) (Figure ). Marine fish catch from the coastal regions makes up about 70% of the annual total catch. The fisheries sector is made up of artisanal, semi-industrial, industrial, and aquaculture.
Figure 1. Map of Ghana showing the coastline and coastal regions (adapted from Ameyaw, Citation2017).
2.2. Data sources
The study relied primarily on data from the Ministry of Fisheries and Aquaculture Development, Fisheries Scientific Survey Division, Ghana Statistical Service, FishStatJ,Footnote1 UNCOMTRADE,Footnote2 OECD,Footnote3 FAO online query panels, and online publications. The data were in four areas; fish production, fish consumption, fish trade, and population. The fish production dataset comprised of catches in weight from marine, freshwater, and aquaculture production. These constituted the fish production sector of Ghana. The consumption dataset comprised of total annual fish consumption (tonnes) and per capita consumption (kg/person/year). The trade dataset comprised of both weight (tonnes) and value (in US$) of fish imports and exports. These three datasets (fish production, consumption, and trade) are termed fishery data in this study (1961–2018). Historical and prospective population data were collected from the World Bank (Citation2013),Footnote4 Worldometers (2019),Footnote5 and Ghana Statistical Service (1961–2030). To validate the fishery data obtained, a key informant at the Ministry of Fisheries and Aquaculture Development was contacted and raw data obtained to verify the online data retrievedFootnote6.
2.3. Data analysis
Data collected was transferred, exported, and/or entered into Microsoft Excel 2019 for storage, visualization, modification, and performing calculations. From the raw data, total production, fish supply, per capita fish consumption, annual growth rate, aggregate (compound) average growth rate, consumption, fish supply, and requirement ratio were calculated. The moving average (MA) function was used to generate predicted historical data for fish consumption, per capita fish consumption, and imports. A single factor ANOVA was performed for original and predicted to determine if the MA could give precise predictions compared to original historical data. The emphasis of data analysis was to; (i) describe the trend from the past to the current data and (ii) forecast the future trend of the studied variables.
2.3.1. Time series analysis
The prospective fish consumption, production, and supply analyses were performed using autoregressive integrated moving average (ARIMA) modelling and forecasting methodologies (Box and Jenkins, Citation1994). ARIMA models are widely used in time series analysis to understand the underlying patterns of historical data and predict future trends. The standard notation for ARIMA models is ARIMA (p, d, q), where p is the order of the autoregressive (AR) model, d is the degree of differencing, and q is the order of the moving average (MA) model (Gordon et al., Citation2013). Differencing is required to transform a non-stationary time series into a stationary one before using historical data to predict future values. Stationary time series are those whose statistical properties, such as mean, variance, and autocorrelation, remain constant over time. The working assumption is that the statistical properties of time series data will be the same in the future as they have been in the past. Hence, ARIMA models are generally linear and forecast future values using “auto” correlations and moving averages over residual errors in the data. This method is handy in studying the dynamic relationship between variables over time, making it a valuable tool in demand forecasting, especially in predicting future food demand and supply.
The modelling and forecasting of future fish consumption, production, and supply were done using the historical annual fishery data (fish production, consumption, and trade) under data sources, from the period 1961 to 2018. Forecasts were generated following the Box-Jenkins 3-step ARIMA modelling and forecasting process: model identification, parameter estimation, and diagnostic checking (Box and Jenkins, Citation1994). Model identification involves selecting the appropriate ARIMA model based on autocorrelation and partial autocorrelation plots. Parameter estimation involves estimating the coefficients of the selected ARIMA model using Akaike Information Criterion (AIC), Bayesian Information Criterion (BIC), maximum likelihood, and standard error as performance metrics. The residuals of the model are then examined to confirm that they are white noise and do not exhibit significant autocorrelation or partial autocorrelation (diagnostic checking). The order of differencing (d) was determined from trend analysis, regression (p) and moving average (q) based on autocorrelation and partial autocorrelation plots. The adequate model was selected based on AIC and BIC. The AIC and BIC are information criteria used to compare the relative quality of statistical models. The model with the lowest AIC and BIC values is considered the best fit for the data (Box and Jenkins, Citation1994).
To forecast apparent fish consumption, per capita consumption, production, import, export, and population, we used the autoregressive integrated moving average (ARIMA) in SPSS. Forecasted results and existing historical (original) data were plotted for visualization. We factored in climate change using Lam et al. (Citation2012). According to Lam et al. (Citation2012), fish production in Ghana will decline by 41.5–55% by 2050 as a result of climate change.
Outputs were termed as follows:
Historical (original): raw historical results as collected from relevant agencies, annual reports, online sources
Predicted: resulted projections of historical data from the analysis
Forecasted: projected future trends based on predicted
3. Findings
3.1. Fish consumption: past, present, and future
Figure shows the historical (original), predicted, and forecasted apparent total fish consumption. Predicted and original fish consumption show close relatedness in pattern terms (Figure ). Original fish consumption averaged 412,409 tonnes from 1961 to 2018. Similarly, the predicted total fish consumption averaged 412,251 tonnes within the same period. Due to the close relationship between the predicted and original values, the model was used for prospective fish consumption estimations. From the forecasted data, fish consumption is expected to grow exponentially from 2017 through 2030, peaking at 905,400 tonnes in 2028. The total fish intake is estimated at 889,096 by 2030 (Figure ), indicating a decline from 2028. Consumption is projected to average 839,272 tonnes from 2019 to 2030, increasing at an annual rate of 0.61% from 2017 to 2030 (Table ).
Figure 2. Fish consumption of Ghana; historical, predicted and forecasted.
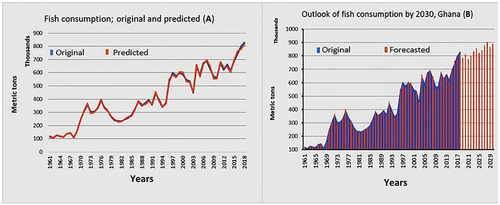
Table 1. Prospective growth of fish demand, supply, and population
3.2. Per capita fish consumption: past, present, and future
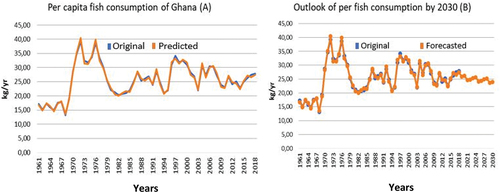
Figure depicts the historical, predicted historical, and projected per capita fish consumption trends. Figure compares the original historical and predicted historical per capita fish consumption patterns from 1961 through 2018. The per capita fish intake averaged 25.69 kg for both the original and forecasted data within the period 1961–2018, demonstrating the accuracy and predictability of the method. Subsequently, the prediction was extended through 2030, and the results are presented in Figure . The average per capita intake of fish is projected to fall somewhat between 2017 and 2030, reaching its lowest level of 23.70 kg in 2029. By 2030, a modest rise to 23,93 kg/capita is anticipated. A forecasted negative growth of −0.76% is expected between 2017 and 2030, with an average of 24,89 kg between 2019 and 2030 (Table ).
Figure 3. Per capita fish consumption of Ghana; historical predicted and forecasted.
3.3. Growth in fish consumption, production, and commodities
Table summarizes fish consumption, supply, and population. Aquaculture is expected to grow rapidly at an average rate of 6.58 from 2017 to 2030, about 10.7 times that of fish consumption and 3.45 times that of population growth within the same period. The growth in capture fisheries will be very slow at 0.06%. Although fish consumption is expected to increase, per capita fish consumption will decline (−0.76). Fish imports are estimated to be 14.8 times that of capture fisheries from 2017 to 2030. And by 2030, fish imports are expected to reach 406,955 tonnes 1.07 times higher than capture fish production. Factoring in climate change (41.5–55%), capture fisheries production could fall between 171,088 and 222,415 by 2030.
3.4. Outlook of fish supply by 2030
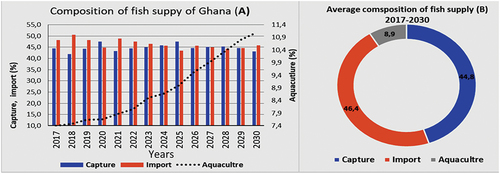
Contribution of capture fisheries and imports is expected to vary insignificantly, while contributions from aquaculture are projected to grow (Figure ). By 2030, capture fisheries is expected to constitute approximately 43% of the forecasted consumption. Contribution from imports is anticipated to be slightly higher (46%) than capture fisheries contribution and make up the largest share of all total fish consumed that year. The contribution from aquaculture is projected to increase rapidly and contributing 11% of overall fish intake by 2030. The contribution of capture fisheries is expected to average 45% from 2017 to 2030 (Figure ). The major fish supply channels will be imports (46%), capture fish fisheries (44.8%), and aquaculture (8.9%) (Figure ).
Figure 4. Contribution to fish consumption by sources.
3.5. Fish imports: past, present, and prospective
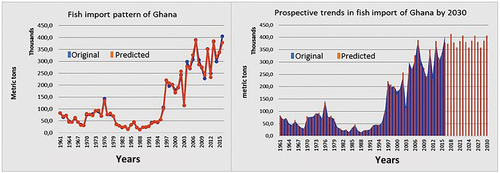
Historical and prospective fish import analysis results, between 1961 and 2030, are given in Figure . The original and predicted historical fish imports averaged 131,924 tonnes and 131,696 tonnes from 1961 to 2016. Forecasted imports show a continuous annual fluctuation, with a peak value of 407,406 tonnes in 2022 and lowest value of 357,547 tonnes by 2024. And by 2030, fish imports are expected to be 406,955 tonnes, making up approximately 46% of total fish consumption.
Figure 5. Fish import of Ghana; historical and predicted.
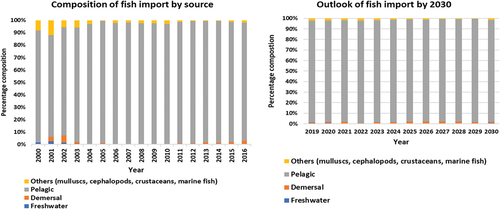
Present and prospective analysis of the composition of fish imports shows that pelagic fish imports will continue as the most imported fish group through 2030 (Figure ). Imports of pelagic fish made up about 96% of all fish imported from 2000 to 2016. Analysis of the composition of historical and forecasted imports shows a similar trend. And by 2030, pelagic fish imports are expected to be 392,450 tonnes, making up 96.4% of all fish imports in the year.
Figure 6. Past and prospective fish import.
4. Discussion
The results show that overall fish consumption would increase at a rate of 0.61% from 2017 to 2030, reaching about 890,000 tonnes by then. On the other hand, per capita fish consumption is anticipated to decline slightly by 0.76% within the same period. The FAO online query (Citation2020) report predicted that total global fish consumption would increase by 89% by 2030, while per capita fish intake in Africa, contrary to other regions, is expected to fall by 3.0%. For sub-Saharan Africa, a dramatic growth of 30% in total fish consumption and a slight decline of 1% in per capita fish intake has been projected from 2010 to 2030 (Gordon et al., Citation2013). A similar analysis by Gordon et al. (Citation2013) reported that aggregate fish consumption would increase while per capita intake would decline slightly by 2030. This pattern of rising overall fish consumption and reducing per capita fish intake may be attributed to population growth, meaning that the number of people eating fish would increase whereas individual fish intake would reduce. Similarly, population growth has been previously implicated as the major driver of increasing aggregate fish demand in sub-Saharan Africa (Gordon et al., Citation2013).
With limited resources, an ever-expanding population implies an increasingly widening demand and supply gap. For instance, Ghana’s population growth rate estimated at 1.89 during the 2017–2030 period significantly higher than the combined growth rates capture fisheries production (0.06%) and fish imports (0.89%) which constitute the largest share of total fish supply in the country. This could have wide-ranging consequences on fish availability and accessibility. As rapid population growth outpaces production and increasing per capita consumption in other regions reduces fish available for import, fish becomes increasingly scarce and people are forced to find alternative choices. Moreover, an increase in fish prices would most likely compel poor countries to cut down their fish intake, which would consequently result in overall decline in per capita consumption. Other factors like decline in catches, IUU, underdeveloped aquaculture industry, large postharvest losses, climate change, policy, and lack of good landing, road, and market infrastructure can also impact fish availability, demand, and consumption (FAO online query, Citation2020; Gordon & Pulis, Citation2012). Fish is essentially important to the nutrition security of Ghana. The decline in per capita fish consumption has far-reaching consequences for affordable protein intake and micronutrients vital for growth and development (Oken et al., Citation2008; McGrane et al., Citation2012). Considering the current state of hunger, poverty, and undernourishment in Ghana, significant decline in fish consumption would impede our many efforts to end hunger and poverty. There is, therefore, the need to accelerate aquaculture development, increase value addition, reduce overcapacity and unstainable harvest levels, and ensure general improvement in the fisheries management practices.
Climate change will reduce production by 41.5–55%, increasing the prevalence of undernourishment by 12% (Lam et al., Citation2012). Adaptive strategies must be exploited to reduce the impact of climate change on the fisheries. Climate change could also reduce employment opportunities in the fisheries sector by 50% (Lam et al., Citation2012). This will seriously affect over 1 million people and push them to food insecurity and poverty.
Fish imports are projected to increase most likely due to increased total fish consumption and inadequate local production (Garcia et al., Citation2005; Gordon et al., Citation2013; Hall et al., Citation2011). In relation to the continental picture, Africa is expected to become dependent on fish imports for human consumption (overall increase to 26%, at 2.5% per annum) (FAOSTAT, Citation2018). Fish and fish products are expected to be among the highly traded products globally by 2030 (FAO online query, Citation2020). A large part of the fish imported will be pelagic fish, 96.4% of total imports, supporting the view that 70% or more by volume of all fish consumed in Africa is categorized as low value (Gordon & Pulis, Citation2012). At the end of the day, food and nutritional security must be met.
4.1. Conclusion and policy recommendation for sustainable consumption
The findings from the analysis of the present and prospective fish consumption in Ghana show a huge fish demand and supply gap. Total fish production is expected to constitute about 43% of the total fish requirement of Ghana. Overall fish consumption is expected to reach 889,096 tonnes by 2030. At the current growth rate, per capita fish consumption is predicted to decline from 28 kg in 2018 to 23.9 kg in 2030. Total fish consumption is projected to increase dramatically with the growing population. Fish consumption would increase, but people would be eating less fish. Fish production from marine, freshwater, and aquaculture is predicted to total 478,796 tonnes by 2030, making up approximately 54% of the total fish needed, with imports making up the remainder. Although overall fish production is expected to increase, production from captured sources is expected to decline from the current average of 450,000 tonnes to 380,196 tonnes. Capture fisheries would decline considerably over the period from 2019 to 2030. Future growth would be aquaculture-driven, with a growth rate of 6.58 per annum. These trends coupled with declining fish stocks and the present undernourished population in Ghana threaten the highlighted urgency for zero hunger, good health and well-being, and responsible consumption and production. Without urgent and rigorous actions, the impact will be catastrophic for; socio-economic livelihoods, food security, and sustainable ecosystem needs. For Ghana to achieve sustainable fish production, supply, and consumption, we recommend the following: i) an urgent need for policies to accelerate aquaculture development by the Ministry of Fisheries and Aquaculture Development, Fisheries Commission, and other relevant stakeholders; ii) reduce unstainable harvest levels taking into account the number of vessels; iii) ensure general improvement in the fisheries management practices; and iv) explore adaptive strategies and improve the adaptive capacity of fishers to climate change.
Correction
This article has been corrected with minor changes. These changes do not impact the academic content of the article.
Acknowledgments
This work was supported by the Management and Resilience of transboundary small pelagic fisheries in West Africa – GREPPAO project, funded by the European Union under the PESCAO program (EuropeAid/158370/DD/ACT/Multi), and piloted by the University of Portsmouth. We thank the two anonymous reviewers whose comments helped to improve the content of this paper.
Disclosure statement
No potential conflict of interest was reported by the author(s).
Additional information
Funding
Notes on contributors
Berchie Asiedu
Berchie Asiedu is an Associate Professor at the Department of Fisheries and Water Resources, University of Energy and Natural Resources, Sunyani, Ghana. His areas of expertise are fisheries, aquaculture, climate change and blue economy.
Seidu Iddrisu
Seidu Iddrisu is a Research Assistant for the Management and Resilience of transboundary small pelagic fisheries in West Africa - GREPPAO project. His areas of expertise are fisheries, aquaculture, and natural resource management.
Pierre Failler
Pierre Failler is a Professor of Economics in the Faculty of Business and Law and Director of the Centre for Blue Governance, University of Portsmouth, UK. He is UNESCO Chair Holder in Ocean Governance. He specialises in development economics, particularly environmental or ecological economics.
Notes
6. final result of a Food Balance Sheet, i.e. the apparent per capita consumption of fish and fishery products (FAO, 2017)
References
- Ameyaw, G. A. (2017). Managing conflicts in the marine fisheries sectors in Ghana, Doctor of Philosophy thesis, Australian National Centre for Ocean Resources and Security (ANCORS), University of Wollongong. http://ro.uow.edu.au/theses1/102
- Asiedu, B., Failler, P., & Beygens, Y. (2018). Ensuring food security: An analysis of the industrial smoking fishery sector of Ghana. Agriculture & Food Security, 7(38). https://doi.org/10.1186/s40066-018-0187-z
- Box, G. E., & Jenkins, G. M. (1994). Time Series Analysis: Forecasting and Control (3rd ed.). Prentice Hall.
- FAO. (2014). The state of world fisheries and aquaculture 2014.
- FAO. (2016). Fisheries and Aquaculture Country Profile. The Republic of Ghana. Available at: http://www.fao.org/fishery/facp/GHA/en#CountrySector-SectorSocioEcoContribution
- FAO. (2017). FAO Yearbook of Fishery and Aquaculture Statistics. 2015 (pp. 107). Rome, FAO. 978-92-5-009987-3.
- FAO. (2019). FAOSTAT Ghana. Hunger and Food insecurity. Available online: http://www.fao.org/faostat/en/#country/81
- FAO online query. (2020) http://www.fao.org/figis/servlet/SQServlet?file=/usr/local/tomcat/8.5.16/figis/webapps/figis/temp/hqp_64483149961856254.xml&outtype=html
- FAOSTAT. (2018). Commodity balances - livestock and fish primary equivalent. Rome, FAO.
- Garcia, S. M., Grainger, R. J. R., Beddington, J. R., & Kirkwood, G. P. (2005). Gloom and doom? The future of marine capture fisheries. Philosophical Transactions of the Royal Society B, 360(1453), 21–9. https://doi.org/10.1098/rstb.2004.1580
- Gordon, A., Finegold, C., Crissman, C. C., & Pulis, A. (2013). Fish Production, Consumption, and Trade in Sub-Saharan Africa: A Review Analysis. WorldFish, 48.
- Gordon, A., & Pulis, A. (2012). The consumption of low-value food fish in Sub-Saharan Africa: Evidence from Ghana, Uganda and Senegal. WorldFish report prepared for World Bank Fish to 2030.
- GSS. (2014). Ghana living standards survey round 6. GSS, Accra. 223 pp.
- Hall, S. J., Delaporte, A., Phillips, M. M., Beveridge, M., & Keefe, M. O. (2011). Blue frontiers: Managing the environmental costs of aquaculture. WorldFish Center.
- Lam, V. W. Y., Cheung, W. W. L., Swartz, W., & Sumaila, U. R. (2012). Climate change impacts on fisheries in West Africa: Implications for economic, food and nutritional security. African Journal of Marine Science, 34(1), 103–117. https://doi.org/10.2989/1814232X.2012.673294
- McGrane, M., Fungwe, T. V., Blum-Kemelor, D., & O’Connell, K. (2012). Maternal Intake of Seafood Omega-3 Fatty Acids and Infant Health: A Review of the Evidence. Nutrition Insight 46. Center for Nutrition Policy and Promotion. U.S. Department of Agriculture, Center for Nutrition Policy and Promotion. U.S. Department of Agriculture.
- MoFAD. 2015. Annual report 2014. MoFAD Accra. 63 pp.
- MoFAD. (2018). Annual report 2017. MoFAD, Accra. 77 pp.
- Oken, E., Østerdal, M. L., Gillman, M. W., Knudsen, V. K., Halldorsson, T. I., Strom, M., Bellinger, D. C., Hadders-Algra, M., Michaelsen, K. F., & Olsen, S. F. (2008). Associations of maternal fish intake during pregnancy and breastfeeding duration with attainment of developmental milestones in early childhood: A study from the Danish National Birth Cohort. The American Journal of Clinical Nutrition, 88(3), 789–796. https://doi.org/10.1093/ajcn/88.3.789
- Quaye, E. A. (2018). Fish consumption behavior of low-income households in urban areas of greater Accra and northern regions of Ghana. MPhil thesis, University of Ghana, 92 pp.
- World Bank. (2013). World Development Indicators 2013 (pp. 145). World Bank. https://doi.org/10.1596/978-0-8213-9824-1
- Worldmeters. (2019). Past and estimate population of Ghana. Available online: https://www.worldometers.info/world-population/ghana-population/