
 ?Mathematical formulae have been encoded as MathML and are displayed in this HTML version using MathJax in order to improve their display. Uncheck the box to turn MathJax off. This feature requires Javascript. Click on a formula to zoom.
Abstract
Food insecurity becomes severe in areas where agriculture is households’ sole income source. Accordingly, this study looked into food security and the role of livelihood diversification in the Damot Woyde district in Southern Ethiopia. Data were gathered using a structured survey questionnaire, focus group discussion, key informants interview and field observation. The household food balance model (HFBM) and HFIAS (household food insecurity access scale) methods were employed to assess food security (availability and access respectively). The data was analyzed using Simpson’s index of diversity, binary logistic regression, multiple linear regression, and the independent sample t-test. The findings revealed that 69% of Woina Dega and 77% of Kolla (HFBM) households were food insecure. HFIAS also showed that only 22.2% of Woina Dega and 11.5% of Kolla households have been food secure. But in other, households, 26.6% of Woina Dega and 36% of Kolla were severely food insecure. Both the binary logistic and linear regression results indicated that livelihood diversification has a positive and important influence on food security in the study area. Hence, we posit that livelihood income diversification lessens the threats of food shortages in rural farm households.
1. Introduction
Food insecurity remains a significant development issue in developing countries. Nearly 12% (928 million) of the world’s population was extremely food insecure in 2020 (Fao & Unicef, Citation2021). Food insecurity has emerged as a global challenge for policymakers, particularly in Sub-Saharan Africa, where population growth outpaces the amount and quality of food required to feed the population (Adjimoti & Kwadzo, Citation2018). Despite significant improvements in economic growth and welfare enhanced in developing nations over the recent decades, most developing nations still lack food security (Mota et al., Citation2019).According to a partial analysis of the Global Report on Food Crises in 53 countries, nearly 193 million people worldwide were food in crisis in 2021, with 22.6% (43.59 million people) in East Africa (Global Network Against Food Crisis GNAFC and Food Security Information Network FSIN, Citation2022).
Ethiopia’s food security condition is strongly tied to severe, repeated food shortages and famine, which are caused by continuous drought (Mota et al., Citation2019). As per Food Security Information Network’s (FSIN) partial assessment, about 8.68% (16.76 million people) in Ethiopia were experiencing a food crisis in 2021, putting it as one of the nations with the worst rates of below five child wasting and stunting (Global Network Against Food Crisis GNAFC and Food Security Information Network FSIN, Citation2022). As to the Central Statistical Agency (CSA) [Ethiopia] and ICF (Citation2016), approximately 80% of Ethiopians reside in rural areas with inadequate infrastructure, and most households are unquestionably smallholders. Food insecurity has become among the major life-threatening challenges in rural Ethiopia, aggravated by a lack of infrastructure, drought, climate variability, population pressure, and other factors (Etea et al., Citation2019). For instance, the Global Hunger Index (GHI) (Citation2022) ranked Ethiopia 104th (27.6 GHI Score, labeled as serious) out of 121 countries worldwide, and 3rd among East African countries (GHI, Citation2022).
Ethiopia’s agricultural sector is primarily based on rain-fed subsistence production, making it extremely vulnerable to drought, environmental degradation, and other hazards. Droughts continue to threaten the food supply of millions of smallholder farming households in the country, who cultivate less than 0.5 ha (World Food Program Ethiopia Office WFP and Central Statistical Agency of Ethiopia CSA, Citation2019). As a result (Etea et al., Citation2019), reported that the PSNP (Productive Safety Net Program) has assisted eight million recurrently food insecure societies since 2005.
The main triggers of food anxiety in rural Ethiopia are a lack of diverse livelihood options and a reliance solely on agricultural production (Zeleke et al., Citation2017). According to the same authors, agriculture alone cannot offer sufficient livelihood opportunities in many rural areas. Numerous studies show that diversification of livelihood and food security are intrinsically tied. Livelihood diversification generates extra earnings, relieving household financial constraints (Etea et al., Citation2019), and having various income sources with consistent amounts is critical to ensuring household food security (Dev et al., Citation2016). The study by Babatunde and Qaim (Citation2010) also reported that diversifying off-farm activities increased food production by relieving household capital constraints.
Damot Woyde district, like most other parts of rural Ethiopia, has been threatened by and afflicted by food insecurity and poverty for decades. Despite various studies on food security issues, few attempts (Mentamo & Geda, Citation2016; World Food Program Ethiopia Office WFP and Central Statistical Agency of Ethiopia CSA, Citation2019) have been made to express food security and livelihood diversification in Ethiopia. To the best of our knowledge, no studies have been conducted to indicate the depth and extent of food insecurity as well as link livelihood diversification with food security in the study area. As a result, the study aimed to investigate agro-climate-based food security status (availability and access) in rural farm households and the role of livelihood diversification in enhancing food security in Damot Woyde district, southern Ethiopia. Furthermore, the outcomes of this study may influence policymakers to prioritize livelihood diversification over agriculture dependence to reduce poverty and food insecurity.
2. Materials and methods
2.1. Research area description
This research was carried out in the Damot Woyde district, located in Wolaita Zone, Southern Ethiopia (Figure ). Geographically, it is located between 6° 40’56’’ − 6° 59’30”‘N latitudes and 37° 52’20’‘- 38° 04’35’” E longitudes. Baddessa Town, the study district’s administrative capital, is 335 km south and 26 km east of Addis Ababa and Sodo (the capital town of the Wolaita zone) respectively. Currently, the district has 24 kebeles (Ethiopia’s smallest administrative unit), which occupy 352 square kilometers, with a total population of 121,478 (Central Statistical Agency CSA, Citation2020).
Figure 1. Location map of the study area.
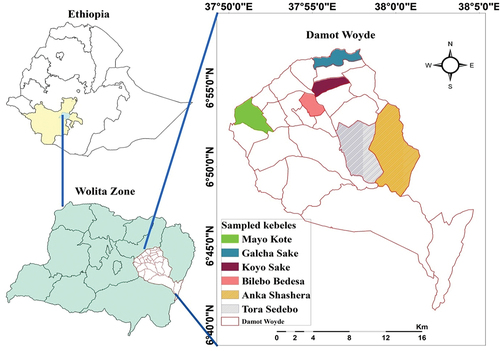
Damot Woyde district is characterized by two agro-climatic zones: Woina Dega (Midland) covers 1600 m-2100 m above sea level (60% of the District) and the remaining 40% is Kolla (Lowlands) covers 1000 m-1600 m above sea level. Though the amount and intensity of rainfall vary yearly, there are two primary rainfall seasons in the area: Belg (March-May) and Meher (June- October). Subsistence agriculture is the most common means of income in the research area (Bergene, Citation2014).
To some extent, off-farm and non-farm are used as additional sources of income in the district. Enset, cereals and root crops are staple crops in the area. Yet, as to our witness, some of the root crops, such as Sweet Potato and Yam are on the way to disappearing, and the size and quantities of Enset are diminishing in the area.
2.2. Research design, approach and sampling procedure
This study used a household-based cross-sectional survey research design and a quantitative dominant mixed-methods research approach. The convergent mixed approach allows for the collection of quantitative and qualitative data at a similar time, and it is likely the most well-known of the major mixed methods models (Creswell & David Creswell, Citation2018).
This study employed a multistage sampling technique. Damot Woyde district was purposefully chosen in the first phase based on food insecurity conditions. The study Kebeles was stratified into two different strata in the second phase to cover varying agro-climate zones. To maintain the proportionality rule, four Kebeles from Woina Dega and two Kebeles from Kolla were chosen at random in the third stage. The sample size required was determined in the fourth stage using the (Kothari, Citation2004) sample size determination model, which is expressed as:
Where, z = 1.96 (95% confidence interval); p=sampling proportion, 0.5; q = 1-p; e= precision level or error margin = 0.05 (5%); N=total household number in selected agro-ecological zones (sampling frame) = 3327; n=sample size required. Accordingly, 346 households were selected from the sample kebeles using a random proportionate sampling method.
2.3. Data sources and collection methods
To achieve the stated objectives, we used data from both primary and secondary bases. 346 household head survey respondents, 27 key informants, six focus group discussions (FGD), and field observations were employed to gather primary data. The structured questionnaire and nine occurrence questions from the HFIAS (Household Food Insecurity Access Scale) were used in the household survey. Secondary information was gathered from important books, journal articles, websites, documents, and official reports, both published and unpublished.
2.4. Data analysis
2.4.1. Measuring food insecurity
Several methods have been employed to assess various food security aspects: access, availability, utilization, and stability. However, obtaining a single comparable measurement across time and place while also capturing all of these dimensions together was difficult (Carletto et al., Citation2013; Coates, Citation2007; Sahu et al., Citation2017). Thus, this research employed HFIAS and Household Food Balance Model (HFBM) to measure food access and availability in rural farm households respectively.
Household food balance model
The net obtainable food for each households was calculated via the HFBM Mathematical Equation, which was modified by (Mulugeta, Citation2012), which (Degefa, Citation1996) adopted from the FAO Regional Food Balance Model and is now utilized by many scholars in this area to calculate the amount of food available per capita. Ethiopian Health and Nutrition Research Institute (EHNRI, Citation1998) food composition tables were used to convert net available food to dietary calorie equivalent. Finally, the computed per capita calorie was compared to the suggested minimum daily calorie needed by an adult who is moderately active (2100 kcal/day/person for Ethiopia) to determine food secure and food insecure households in the area. However, because the unit of analysis for this study is household level, intra-household differences or individual issues will not be addressed. Furthermore, this model fails to demonstrate variations within the household, which in reality vary based on age, gender, health status, and job differences.
Modified HFBM:
Modified HFBM
Where: NGA = Net Grain Available (quintal/household/year), GP = Grain Production (quintals/household/year), GB = Grain Bought (quintals/household/year), FA = Food Assistance received (quintals/household/year), GG = Grain Gained by Gift or Remittance (quintals/household/year), HL = Post Harvest Losses caused by disasters, thievery, grain pests, etc. (kilogram/household/year), RG = Reserve grain for seed (quintals/household/year), GS = Grain Sold (quintals/household/year) and GD = Grain amount donated to others during a year (quintals/household/year)
The HFIAS measurement, in terms of experience-based measuring, which the United States uses to approximate the country’s pervasiveness of food insecurity, was adopted (Coates, Citation2007). The measure was created to grasp a household’s expectable responses and reactions indicating that food would be inadequate both quality and quantity, as well as anxious about food production (for the previous month/30 days in this case). The quantitative data from the household surveys were analyzed using the Statistical Package for Social Science (SPSS version-26), Stata16, and Microsoft Excel. Arc-GIS (10.7) was employed to map the study area, and Mendeley Desktop was employed as the reference management software.
2.4.2. Calculating food security index
The food security threshold in this study was set at the mean daily lower limit calorie consumption of a moderately active adult equivalent, 2100 kcal/day/person for Ethiopia (EHNRI, Citation1998). The caloric intake per capita household was calculated and compared to the per capita food security benchmark (2100 Kcal/day). Thus, the index of food security (FSI) was calculated as follows (Etea et al., Citation2019):
Where, FSI is the index of food security or status of the ith household, Yi is the ith household’s current daily per capita calorie consumption, and R is the suggested daily calorie consumption per capita (2100 kcal). When, FSI ≥ 1, the assumed household is considered as food secure, else, food insecure.
2.4.3. Surplus or shortfall index
Based on FSI, several food security measures are calculated (Omotesho et al., Citation2006); the shortfall/surplus index, P is given as:
Where, P=surplus/shortfall index; Gj=(Xj–R)/R is the amount of average daily calorie deficiency or surplus faced by household j, Xj is the average daily calorie available to the jth household, R is the food security line’s recommended daily energy levels and K= the number of households which are food secure (for the surplus index) or food insecure (for the shortfall index).
2.4.4. Measuring food insecurity gaps
The food insecurity gap quantifies the amount to which households are below or above the food security line on an aggregate level. This study also discussed food insecurity measures like the Gap of Food Insecurity and Gap of Squared Food Insecurity, which represent successively more specific features of households’ food insecurity status (Maharjan & Khatri-Chhetri, Citation2006). According to these authors, the Gap of Food Insecurity is computed as:
Where, FIGi = Food Insecurity Gap of ith food insecure rural farm household, Thi = the benchmark (2100 Kcal/day) for ith food insecure rural farm household, FSi = is the mean daily calorie intake obtainable to the ith food insecure rural farm household.
Therefore, the entire gap of food insecurity is computed as:
Where, TFIG is the whole food insecurity gap, which denotes the degree of food insecurity
in the food insecure rural farm households and N is the figure of food insecure rural farm households.
The Gap of squared Food Insecurity, which shows the harshness of food shortages insecurity in rural farm households, can be expressed as:
Where, SFIG = Gap of Squared Food Insecurity of rural farm household
2.4.5. Simpson’s Index of Diversity (SID)
Several researchers utilized various approaches to assess the household’s level of income diversity. Among the most frequently employed measures are the Herfindahl-Hirschman index and Simpson’s diversity of index (SID) (Archibald et al., Citation2014; Schwarze & Zeller, Citation2005). The SID has recently become widely employed to measure the income diversity impact on rural livelihoods (Adjimoti & Kwadzo, Citation2018; Etea et al., Citation2019; Mentamo & Geda, Citation2016). As a result, for this research, the researcher used the SID approach, which is detailed below:
Where SID is Simpson’s diversity of index, N is the entire amount of income bases, and Pi is the share of household income from ith bases. SID always has a value that ranges from 0 to 1. The nearer the index value is to one, the greater the degree of livelihood diversification, and the closer the index value is to zero, the greater the degree of livelihood specialization.
2.4.6. Binary logistic regression
To assess the impact of rural household income diversity on the status of food security, the researcher employed binary logistic regression. The dependent variable for estimating the logistic model was the status food security, which gets a score of 1 for food secure households and 0 otherwise. Since the dependent variable is dichotomous with continuous and discrete predictor variables, the binary logistic model is preferable for estimating the impact of explanatory variables on the dependent variable. As a result, the logistic model was mathematically specified as follows (Neupane et al., Citation2002):
Where, subscript i denotes the ith observation in the sample, P is the possibility of the outcome, 0 = is the intercept term, and 1, 2, … , 9 are the coefficients associated with each explanatory variable X1, X2, … , X9:
X1 = Household head’s sex
X2 = Education of household head (Schooling years)
X3 = Size of the household
X4 = Age dependency ratio
X5 = Annual income
X6 = Simpson’s index of diversity (SID)
X7 = Farmland size(Ha)
X8 = Soil and water conservation (SWC)
X9 = Agricultural extension service
2.4.7. Multiple linear regression
Furthermore, the role of livelihood income diversification on the food security index was determined using multiple linear regression. The model is described below (Gujarati, Citation2004):
Where, Yi is the index of food security; X1i, X2i, … , X9i are explanatory variables; β0 is the intercept, β1 is the coefficient slope on X1, β2 is the coefficient on X2, and etc; and ui is an error term.
2.4.8. Independent samples t-test
The Woina Dega and Kolla rural farm households’ mean daily calorie consumption and SID were compared using a t-test to see if they were statistically different.
3. Results and Discusion
3.1. Descriptive Analysis
Table displays descriptive statistics on the socio-demographic and economic characteristics of the participant households. As shown in Table , the respondents’ level of education, annual gross income, livelihood income diversity level (SID), total farmland size, average calorie intake per person per day, and FSI varied significantly between the study areas’ two agro-climatic zones. Except for farmland size, most of the analysis results show that Woina Dega households relatively outperformed Kolla households. Furthermore, the Woina Dega households’ mean daily intake of calories and SID were considerably greater than those of the Kolla households (P < 0.01).
Table 1. Descriptive analysis of key socio-demographic and economic variables
3.2. Livelihood Income Bases of Rural Farm Households
Farming contributed 51% and 55% of total income in the Woina Dega and Kolla households, respectively, to household livelihood income from total economic activities (Figure ). Although farming accounts for a large portion of livelihood income in both agro-climatic zones, Woina Dega households diversify their livelihood sources more than Kolla households (P < 0.01). Non-farm, off-farm, livestock, and other activities such as productive safety net (PSN), gifts/inheritance, and remittances, contributed 19%, 12%, 5%, and 13% of Woina Dega households’ livelihood income, and 8%, 13%, 10%, and 14% of Kolla households’ livelihood income, respectively. The relative share of off-farm and other sources (PSN, gifts/inheritance and remittances) contributions to livelihood sources to both agro-climatic zones, non-farm contributes significantly to Woina Dega households than Kolla households. In contrast, the Kolla households earned substantially more money from farming activities and livestock as compared with the Woina Dega households.
Figure 2. Contribution of livelihood income from different bases.
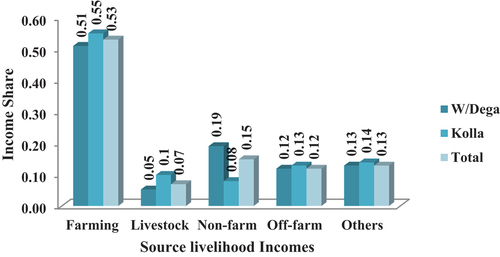
Relating to the less engagement of non-farm activities, rural households from the Kolla agro-climate zone stated that: “mostly our sources of livelihoods depend on agricultural activities which are highly sensitive to climate variability shocks. Infrastructure problems (mainly road), the initial capital required to engage in petty trade and the distance to market all have an influence on our non-farm activities. Even some off-farm activities considered to be immoral by rural farm households are also significant impediments to participation.” [Discussions in Kolla ACZ, April 2022].
As shown in Figure , rural farm households have a significant share of their income from other sources. However, the majority of key informants and FGD participants from both agro-climate zones reported that the productive safety net (PSN) covers a significant proportion of food insecure households. One key informant, for example, stated that “PSN is active for six months per year and delivered in the form of cash to selected food insecure households. The payment is 375 ET Birr per household member and it treats up to six members in one household. If the household has six members and is supported by PSN, the household may receive 2250 ET Birr per month. As a result, it is difficult for poor households to survive without PSN.”
3.3. Rural farm households’ food security situation
The rural farm households’ status of food security in the district was calculated using both the calorie intake (HFBM) and experience (HFIAS) methods. We calculated the mean dietary consumption of every household of various ages and genders using the calorie consumption method, converting net available food into Adult Consumption Equivalents. The study found that 69% of Woina Dega and 77% of Kolla households were food insecure (Table ). In the study district, only 31% of Woina Dega and 23% of Kolla were food secure. Only 28% of the study district’s households met the recommended calorie intake for Ethiopia (2100 kcal), while a large proportion (72%) of households were unable to secure food. Furthermore, the mean daily adult equivalent (AE) calorie intake of Woina Dega households was relatively higher than that of Kolla households (P < 0.01). Nonetheless, in both study areas, the majority of households (69% of Woina Dega and 77% of Kolla) were food insecure (Table ). Moreover, both agro-climate zone households’ average daily AE calorie consumption was less than the amount proposed for Ethiopia (2100 kcal), which the study employed as a food security benchmark. Woina Dega households covered 79.4% of the threshold, while Kolla households covered 71.7%.
Table 2. Food security situations of rural farm households (HFBM)
According to the surplus and shortfall indices, only 13.3% of Woina Dega and 7.5% of Kolla households were fully food secure yet 34.4% of Woina Dega and 36.7% of Kolla households falling below the line of food security (Table )., while a reasonable amount of rural farm families (52.3% of Woina Dega and 55.8% of Kolla) unfortunately were at the borderline of the food security, neither lower nor higher than the reference line. Due to their reliance on agriculture (climate-sensitive) and limited access to adaptive capacities, several smallholding households may face food insecurity in the near future. Furthermore, the food insecurity gap reveals that households with food insecurity in Woina Dega and Kolla consumed 34% and 37% fewer calories per capita than food secure households, respectively. Inconsistent with previous studies (Ahmed et al., Citation2017; John et al., Citation2013), the food insecurity problem was 13% and 15% severe in Woina Dega and Kolla households respectively.
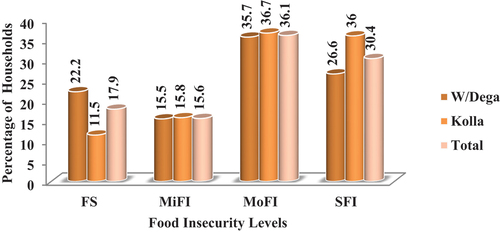
In the experience-based measure (Coates, Citation2007), households were divided into four food security status categories. Food secure (FS), mildly food insecure (MiFI), moderately food insecure (MoFI), and severely food insecure (SFI) are the classifications (Figure ). As a result, 22.2% of Woina Dega households and 11.5% of Kolla households were food secure (had none of the food insecurity circumstances or was rarely concerned about having enough food). Conversely, a significant proportion of households, or 26.6% of Woina Dega and 36% of Kolla, were severely food insecure (frequently reducing the size and quantity of meals), whereas the remainder of participants were mildly and moderately food insecure.
Figure 3. Household’s status of food security (experience-based measure).
3.4. The role of households’ livelihood diversification on food security
Using calorie intake-based measures, a binary logistic model was used to examine the result of livelihood diversification on food security in the study district (Table ). The estimated coefficients βi only indicate the direction of the explanatory variable’s impact on the binary outcome variable (Menard, Citation2000) and fails to clarify how much the likelihood of the ith households being food secure changes as the value of the independent variable changes. Hence, to better understand the outcomes, we determined the marginal effects following (Abid et al., Citation2015), where the marginal effect denotes the magnitude of the influence of a unit alteration in the predictor variable on the likelihood of a household being food secure. Based on the study outcomes, rural farm households’ status food security is statistically significant and positively associated with livelihood income diversification, farmland size, continuous soil and water management applications, agricultural extension services availability, and annual income, and inversely connected with household size (Table ).
Table 3. Role of household livelihood diversification on food security
The logistic model (Calorie intake-based) revealed that the amount of household members decreases the likelihood of a rural household being food secure. In the study district, just one household size increase was associated with a 4.7% reduction in the likelihood of households being food secure. This implies that a rise in the size of households places additional burdens on producing members and may disrupt their status of food security due to limited resources. These findings are consistent with those of other studies (Ahmed et al., Citation2017; Echebiri et al., Citation2017; Etea et al., Citation2019), which found a negative relationship between increasing the household size and the status of food security. Though not statistically significant, education did contribute to the district’s food security status.
The influence of livelihood income diversification on the status food security (based on calorie intake) found that income diversification aided food security. The marginal effect indicates that increasing livelihood diversification increased the likelihood of households being food secure. As a result, a 1% upsurge in the score of the SID was linked with a 49% increase in the chance of households being food secure. Households that diversified their livelihood income sources were more likely to be self-sufficient in food, particularly those that diversified into non-farm and off-farm options.
The size of agricultural land possessed by rural farmers was strongly connected to food security. Farmers utilize farmland as assets to acquire credit and rent out farmland to make the income from farming, hence substantial farmland holding is a sign of wealth in rural Ethiopia (Etea et al., Citation2019). An increase of one hectare in farmland size is related to a 9.8% increase in the possibility of respondents being food secure. Furthermore, the findings show that when rural farm households protect their land fertility through consistent soil and water protection and easily accessible agricultural extension services, the likelihood of food security increases.The findings also revealed that a one percent increase in the availability of extension services for agriculture and continuous application of soil and water protection increased the likelihood of households’ food security by 0.71 and 0.58%, respectively (Table ).
3.5. The influence of livelihood diversity on the food security index
We also used linear regression to further observe the result of livelihood income diversification and other socio-economic factors on the food security index of agricultural households in the district. The regression model in Table depicts the association between selected explanatory variables and the outcome variable (food security index). The tolerance and variance inflation factor (VIF) was used to test for the presence of a severe multicollinearity problem, and the outcomes for all variables show that the data had no severe multicollinearity tricky.
Table 4. The influence of livelihood diversity on the food security index
The beta (β) coefficients indicate the magnitude of the individual predictor variable’s contribution, which means that the greater the value of (β), the larger the influence on the outcome variable. The R2 = 0.859 in the model indicates a good percentage of the variation in the criterion variable was explained by the sets of predictor variables. Most of the predictor variables entered in the regression were revealed to be significantly and strongly related with the outcome variable.
The linear regression analysis shows that a one-unit increase in household size, as shown in Table , reduces the level of food security index in the rural household by 0.051. Farmland size owned, soil and water upkeep, availability of extension services for agriculture, annual household gross income and livelihood diversification (SID) were all statistically significant at p < 0.001. The size of farmland for rural households is also important. A unit increase in farmland size owned resulted in a 0.143 level increase in the rural household’s food security index. According to the beta coefficient value, a one percent increase in the application of soil and water management, as well as the availability of extension services for agriculture resulted in a 9% and 8.8% increase in the food security index of rural household, respectively.
Livelihood diversification had a significant and positive influence on the level of the food security index, with a single unit change in SID causing a 0.358 unit change in the dependent variables. The analysis shows that increasing the outcome of the SID improves the households’ status of food security in the district. This result is consistent with prior studies (Etea et al., Citation2019; Onunka & Olumba, Citation2017; Robaa & Tolossa, Citation2016). Echebiri et al. (Citation2017) also proposed livelihood diversification as a remedy to the severe food insecurity that disturbs rural households in Nigeria. The study’s overall outcome confirms that income diversity enhances food security in the district’s households.
4. Conclusion
This study investigated the rural farm households’ status of food security and the role of livelihood diversification in improving food security employing, a household head survey of 346 rural farm households from two agro-climatic zones in Damot Woyde district. The study’s findings show that farm households’ status of food security issue is not improving, with a large proportion of farm households still food insecure or on the verge of food insecurity. Accordingly, the study revealed that a significant number of the sample households (69% and 77% in HFBM and 78% and 88.5% in HFIAS of Woina Dega and Kolla households, respectively) were food insecure at the time of the survey. Accordingly, the status of food insecurity in the study district is extremely problematic and alarming and needs an urgent and sustained reaction.
The study found that non-farm and off-farm income was small in comparison to farm-dominated livelihood income in both agro-climate zone households. However, Woina Dega households are comparatively better in their income diversification (mean SID = 0.64) than households of Kolla (mean SID = 0.59). Even though most rural households in the district were food insecure, households that diversify their livelihood income sources are more likely to be food secure. The regressions indicated that diversifying one’s source of income has a positive influence on the status of food security. Hence, livelihood income diversification can be an antidote to prolonged food insecurity for households of both agro-climate zones in the study district. However, income diversification was only implemented on a limited scale and thus was unsuccessful to bring about fundamental improvements in the lives of the agricultural communities in the district.
5. Recommendation
Though the livelihood diversification contributes a greate to lessen the food insecurity of farm households, the application of diversifying income sources in the study area were inadequate. As a result, we suggest that the government of any level and other stakeholders develop policies and programs to increase livelihood income diversification to promote income-generating activities and reduce the incidence of food problems in the study district.
This research only looked at the availability and access dimensions of food security to assess the status of farm households’ food security. We noticed that the status of food security fluctuates before and after harvesting seasons in the study district; that means the degree of food insecurity was great before harvesting. As a result, we propose that future research investigate variations in food security status while accounting for seasonal differences and the limits of the current study.
Ethics approval and informed consent
The researchers obtained support letters from Arba Minch University’s School of Graduate Studies before beginning the actual research activities. The letters were sent to the Damot Woyde district administration and concerned governmental and nongovernmental organizations working in food security, agriculture, and rural development at the respected study sites. Before collecting data, informed consent was obtained from the study units: household heads, participants in focus group discussions, and key informants.
Acknowledgments
The authors would like to thank Dilla College of Education for sponsoring the first author for a Ph.D. study. The authors also would like to extend their deep thanks to Damot Woyde district administration, farmers, local administrators, key informants, focus group participants and development agent workers who willingly shared their experience and provided necessary data at the expense of their precious time.
Disclosure statement
No potential conflict of interest was reported by the author(s).
Data availability statement
The datasets employed and/or analyzed for this study are available from the corresponding author upon reasonable request.
Additional information
Funding
Notes on contributors

Eshetu Bichisa Bitana
Eshetu Bichisa Bitana, the corresponding author, Studied Socioeconomic Development Planning at Dilla University (MA) in 2016; Geography and Environmental Studies at Mekelle University (B.Ed.) in 2008 and now he is a Ph.D. candidate at Arba Minch University, Department of Geography and Environmental Studies. He is a Lecturer at Dilla College of Education. His research interests include themes on Climate change/variability, Food security, Livelihood vulnerability and resilience, Natural resource management, Sustainable development and Population related issues.
Senbetie Toma Lachore
Senbetie Toma Lachore (Ph.D.) is an Associate Professor in the Department of Geography and Environmental Studies, Kotebe Metropolitan University, Addis Ababa, Ethiopia.
Abera Uncha Utallo
Abera Uncha Utallo (Ph.D.) is an Associate Professor in the Department of Geography and Environmental Studies, Arba Minch University, Arba Minch, Ethiopia
References
- Abid, M., Scheffran, J., Schneider, U. A., & Ashfaq, M. (2015). Farmers’ perceptions of and adaptation strategies to climate change and their determinants: The case of Punjab province, Pakistan. Earth System Dynamics, 6(1), 225–14. https://doi.org/10.5194/esd-6-225-2015
- Adjimoti, G. O., & Kwadzo, G. T. M. (2018). Crop diversification and household food security status: Evidence from rural Benin. Agriculture & Food Security, 7(82). https://doi.org/10.1186/s40066-018-0233-x
- Ahmed, U. I., Ying, L., Bashir, M. K., Abid, M., Zulfiqar, F., & Mertens, F. (2017). Status and determinants of small farming households’ food security and role of market access in enhancing food security in rural Pakistan. PLoS One, 12(10), e0185466. https://doi.org/10.1371/journal.pone.0185466
- Archibald, B., Agyeman, S., Asuming-Brempong, S., & Onumah, E. E. (2014). Determinants of income diversification of farm households in the Western Region of Ghana. Quarterly Journal of International Agriculture, 53(1), 55–72.
- Babatunde, R. O., & Qaim, M. (2010). Impact of off-farm income on food security and nutrition in Nigeria. Food Policy, 35(4), 303–311. https://doi.org/10.1016/j.foodpol.2010.01.006
- Bergene, T. (2014). Climate change/variability, food security status and people’s adaptation strategies in Damot Woyde Woreda, Wolayta Zone, SNNPR,Ethiopia [ Unpublished master’s thesis]. Addis Ababa Wuniversity.
- Carletto, C., Zezza, A., & Banerjee, R. (2013). Towards better measurement of household food security: Harmonizing indicators and the role of household surveys. Global Food Security, 2(1), 30–40. https://doi.org/10.1016/j.gfs.2012.11.006
- Central Statistical Agency (CSA). (2020). Population projection of Ethiopia: Population size by sex, area and density by region, Zone and Wereda. CSA: Addis Ababa, Ethiopia.
- Central Statistical Agency (CSA) [Ethiopia] and ICF. (2016). Ethiopia demographic and health survey 2016. CSA and ICF. https://doi.org/10.2147/ahmt.s148434
- Coates, J. (2007). Household Food Insecurity Access Scale (HFIAS) for measurement of food access : Indicator guide (V.3). FHI 360/FANTA. August.
- Creswell, J. W., & David Creswell, J. (2018). Research design: Qualitative, quantitative, and mixed methods approaches (Fifth ed.). SAGE Publications, Inc.
- Degefa, T. (1996). Belg crop production as a strategy of households’ food security: A comparative study of Belg Grower and Non-Belg Farmers in Munessa Wereda, Arsi Zone [ Unpublished master’s thesis]. Addis Ababa University.
- Dev, T., Sultana, N., & Hossain, E. (2016). Analysis of the impact of income diversification strategies on food security status of rural households in Bangladesh: A case study of Rajshahi District. American Journal of Theoretical and Applied Business, 2(4), 46–56. https://doi.org/10.11648/j.ajtab.20160204.13
- Echebiri, R. N., Onwusiribe, C. N., & Nwaogu, D. C. (2017). Effect of livelihood diversification on food security status of rural farm households in Abia State Nigeria. Scientific Papers Series Management, Economic Engineering in Agriculture & Rural Development, 17(1), 159–166.
- EHNRI, F. A. O. (1998). Food composition table for use in Ethiopia Part III and IV. In Addis Ababa. Ethiopian Health and Nutrition Research Institute.
- Etea, B. G., Zhou, D., Abebe, K. A., & Sedebo, D. A. (2019). Household income diversification and food security: Evidence from Rural and Semi-Urban Areas in Ethiopia. Sustainability, 11(12), 16. Doi:10.3390/Su11123232. https://doi.org/10.3390/su11123232
- Fao, I., & Unicef, W. (2021). The State of food security and nutrition in the World 2021. Transforming food systems for food security, improved nutrition and affordable healthy diets for all. FAO. https://doi.org/10.4060/cb5409en
- Global Hunger Index (GHI). (2022). Global hunger index: Food systems transformation and local governance. Concern Worldwide and Welthungerhilfe.
- Global Network Against Food Crisis (GNAFC) and Food Security Information Network (FSIN). (2022). Global report on food crises: Joint analysis for better decisions. FSIN.
- Gujarati, D. N. (2004). Basic Econometrics. GaryBurke. The Economic Journal, 82(326). https://doi.org/10.2307/2230043
- John, K. M., Kuwornu, D. M., & Suleyman, D. P. K. A. (2013). Analysis of food security status of farming households in the forest belt of the central region of Ghana. Russian Journal of Agricultural & Socio-Economic Sciences, 13(1), 26–42. https://doi.org/10.18551/rjoas.2013-01.04
- Kothari, C. R. (2004). Research methodology: Methods and thechniques (2nd ed.). New Age International Publishers.
- Maharjan, K. L., & Khatri-Chhetri, A. (2006). Household food security in rural areas of Nepal: Relationship between socio-economic characteristics and food security status [Paper presentation]. International Association of Agricultural Economics Conference, Gold Coast, Austra, August 12-18, 2006.
- Menard, S. (2000). Coefficients of determination for multiple logistic regression analysis. Behalf of the American Statistical Association, 54(1), 17–24. https://doi.org/10.1080/00031305.2000.10474502
- Mentamo, M., & Geda, N. R. (2016). Livelihood diversification under severe food insecurity scenario among smallholder farmers in Kadida Gamela District, Southern Ethiopia. Kontakt, 18(4), e258–e264. https://doi.org/10.1016/j.kontakt.2016.09.003
- Mota, A. A., Lachore, S. T., & Handiso, Y. H. (2019). Assessment of food insecurity and its determinants in the rural households in Damot Gale Woreda, Wolaita zone, southern Ethiopia. Agriculture & Food Security, 8(1). https://doi.org/10.1186/s40066-019-0254-0
- Mulugeta, M. (2012). Resettlement and food security nexus in Ethiopia: A case study from Nonno District [ Doctorial Dissertation. Addis Ababa University. LAP LAMBERET Academic Publishing GmbH & Co.KG]
- Neupane, R. P., Sharma, K. R., & Thapa, G. B. (2002). Adoption of agroforestry in the hills of Nepal: A logistic regression analysis. Agricultural Systems, 72(3), 177–196. https://doi.org/10.1016/S0308-521X(01)00066-X/
- Omotesho, O. A., Adewumi, M. O., & Ayinde, O. E. (2006). Determinants of food security among the rural farming households in Kwara State, Nigeria. African Journal of General Agriculture, 2(1), 7–15. https://doi.org/10.1016/S0308-521X(01)00066-X
- Onunka, C. N., & Olumba, C. C. (2017). Analysis of the effect of livelihood diversification on the food security status of the rural farming households in UDI L. G. A of Enugu State. International Journal of Agricultural Science and Research (IJASR), 7(6), 389–398. https://doi.org/10.24247/ijasrdec201751
- Robaa, B., & Tolossa, D. (2016). Rural livelihood diversification and its effects on household food security: A case study at Damota Gale Woreda. Eastern Africa Social Science Research Review, 32(1), 93–118. https://doi.org/10.1353/eas.2016.0001
- Sahu, A. K., Chüzho, Z., & Das, S. (2017). Measuring household food security index for high hill tribal community of Nagaland, India. Journal of Food Security, 5(5), 155–161. https://doi.org/10.12691/jfs-5-5-1
- Schwarze, S., & Zeller, M. (2005). Income diversification of rural households in Central Sulawesi, Indonesia. Quarterly Journal of International Agriculture, 44(1), 61–73.
- World Food Program Ethiopia Office (WFP) and Central Statistical Agency of Ethiopia (CSA). (2019). Comprehensive Food Security and Vulnerability Analysis (CFSVA). U.S. Government Interagency Partners.
- Zeleke, T., Yousuf, J., & Zemedu, L. (2017). Impact of Livelihood diversification on rural household’s food security in Fedis Weroda, Eastern Hararge Zone, Oromiya Region, Ethiopia, University of Haramaya, Haramaya-Ethiopia. Journal of Poverty, Investment and Development, 32, 36–42.