
 ?Mathematical formulae have been encoded as MathML and are displayed in this HTML version using MathJax in order to improve their display. Uncheck the box to turn MathJax off. This feature requires Javascript. Click on a formula to zoom.
Abstract
The main objective of this study was to analyze drought-induced agricultural livelihood vulnerability through a comprehensive assessment of agro-meteorological, biophysical, and socioeconomic variables in North Wollo. The study area has four main livelihood zones, namely, Abay Tekeze watershed (ATW), North Wollo east plain (NWEP), North Wollo highland belg (NWHB), and Northeast woina-dega mixed cereal (NEWMC). A total of 274 sample households were selected from all the livelihood zones by considering wealth rankings. A Survey questionnaire, supplemented with focus group discussions and key informant interviews, was used to collect the data. Principal component analysis was applied to determine the indicators and assign weights. Consequently, from 66 indicators 32 were prioritized to measure the exposure, sensitivity, and adaptive capacity of the system. Both the livelihood vulnerability framework (LVI) and vulnerability sourcebook approach (LVIVSBA) were applied to assess livelihood vulnerability. The results revealed that the entire study area was characterized by higher exposure (0.653) and higher sensitivity (0.632) scores to drought impacts, while it exhibited a lower adaptive capacity (0.37). In both approaches, NWHB obtained the highest vulnerability score (0.681/0.715) followed by NWEP (0.634/0.619), whilst ATW revealed the lowest (0.583/0.555) in LVI and LVIVSBA, respectively. Similarly, the poor (0.671/0.670), medium (0.589/0.593), and better-off (0.554/0.537) were relatively ordered from the highest to the lowest. In conclusion, differential livelihood vulnerability does exist across the livelihood zones and wealth groups. The major sub-components which worsen household’s vulnerability were access to irrigation, food self-sufficiency problem, scarcity of livestock fodder, poor access to basic infrastructure, lower livelihood diversification, inadequate economic resources, low educational status, lack of training and support. Hence, the study calls for decision-makers and development partners to develop context-specific planning and interventions that strengthen the farmers’ adaptive capacity and minimize their exposure and sensitivity to the issue.
PUBLIC INTEREST STATEMENT
Ethiopia has been highly vulnerable to recurrent droughts. Since agriculture is the most sensitive sector, the rapidly changing climate likely exacerbated the drought-related problems facing agricultural livelihoods. The recurrence and lingering nature of droughts have deteriorated the adaptive capacity of the farming households. The repercussions of these crises on agriculture-based livelihoods are significant, as roughly more than 90% of agriculture in Ethiopia is subsistence and rain-fed. Such influences can potentially pose far-reaching and long-lasting cascading impacts, increasing the probability of the co-occurrence of other risks that also aggravate vulnerability situations. However, uniform exposure to droughts among the farming households’ within the same locality, and wealth status does not translate to similar livelihood vulnerability situations. This may be attributed to their differential sensitivity and adaptive capacity. It creates difficulties for planners and donors to prioritize households in need, and it fine-tunes early warning systems and climate change adaptation measures. Therefore, examining the livelihood vulnerability of the farming households by integrating local-context socio-economic and biophysical data from various sources can help prioritize localities for timely interventions and evade future risks.
1. Introduction
Drought is among the most disastrous natural hazards that occur in all climate regimes (Kiem et al., Citation2016; Saha et al., Citation2022), but it could be prevalent in livelihoods that rely on rain-fed agriculture. With predicted climate change, the frequency, duration, area coverage, and severity of droughts are expected to worsen, and the aerial extents of drought-affected regions are projected to increase in the future (Eze et al., Citation2020). The problem is persistent in Africa, particularly in countries of Sub-Saharan Africa (SSA) (Shiferaw et al., Citation2014). In the last five decades, drought in such countries has induced immense impacts on asset reduction, environmental degradation, and unemployment. It also subjects their people to destitution and forced migration (Dendir & Simane, Citation2019; Hermans & Garbe, Citation2019). Thus, the recurring droughts trapped those countries in vicious cycles of poverty.
Agriculture is the most sensitive sector (Roy et al., Citation2022; Shiferaw et al., Citation2014), where about 84% of the damage and losses in it are caused by droughts (Engdaw, Citation2014). In effect, the livelihood of farmers is sensitive to any climate extremes, given their strong dependence on weather-sensitive natural resources (Asfaw et al., Citation2021). As Shiferaw et al. (Citation2014) noted, many parts of SSA face a 10–40% risk of failed seasons during the main cropping calendar each year. The repercussions of these crises on agriculture-based livelihoods are significant as roughly 90% of agriculture in the SSA is largely subsistence rain-fed type (Antwi-Agyei et al., Citation2016).
Ethiopia is among the SSA countries where drought has long been considered the most severe long-term climatic shock and the main concern for farm families (Maru et al., Citation2021). Mekonen and Berlie (Citation2021) point out that a combination of climate change, rapid population growth, shrinking agricultural lands, cultivation of marginal lands, land overexploitation, and a lack of proper soil and water conservation techniques contributed to recurring droughts. Drought frequency has increased over the past few decades, with events occurring every two to three years in the drought-prone regions, as compared to decadal intervals in the past (Bayissa et al., Citation2018); and still, it portends as the hallmark of the country (Mera, Citation2018). According to Touma et al. (Citation2015), such crises are mostly followed by famine, social ramifications, and political turmoil. Specifically, the northern parts of Ethiopia including Tigray, Wollo and its surroundings have formerly been often affected by recurrent drought and associated famines (Gebre et al., Citation2017). This was adversely putting the population at risk of starvation and severe poverty situations (Asfaw et al., Citation2021). According to Wassie et al. (Citation2023), about 80% of the population depends on food aid, especially during drought years, with 60% of them requiring assistance for six to twelve months. With such complexity, agricultural output in the area may decline below recovery levels, coupled with environmental degradation and depletion of natural resources, which again intensify climatic extremes to recur. These direct and indirect influences can potentially pose far-reaching and long-lasting cascading impacts by increasing the probability of the co-occurrence of other risks (UNDRR, Citation2021).
Since the Citation1970s, Ethiopia has experienced more than 10 major drought periods (Abeje et al., Citation2019), often followed by devastating famine (Asfaw et al., Citation2021). These severe droughts negatively impacted human life and socio-economic development. Between 1997 and 2007, drought costs Ethiopia $1.1 billion each year which is more than the amount the country invested in the agriculture sector (OXFAM, Citation2011). Drought claimed the greatest loss of life in 1973, 1974, and 1984, while the greatest number of affected people occurred in the Citation2002 drought (14.2 million, or 20% of the country’s population) (Degefu & Bewket, Citation2015). Droughts in 1984/85 and 2002/03 reduced the country’s gross domestic product (GDP) by roughly 9.7 and 3.8%, respectively (Conway et al., Citation2007). At the same time, agricultural outputs decreased by 21% and 12%, respectively. The damages related to droughts have been more extensive as drought, by its very nature, has an extended lifetime (Bento et al., Citation2018). For instance, the immediate impact of Ethiopia’s early 1980s drought on farmers’ income and livelihoods extended for more than a decade (Dercon, Citation2004).
Consequently, around three million Ethiopians are affected by crop production shortfalls each year, in addition to the aid given to 7.6 million people by the Productive Safety Net Program (PSNP). The PSNP is helping Ethiopia’s poorest and most food-insecure families due to prolonged droughts (Teshome & Zhang, Citation2019). Ethiopia is now one of the world’s greatest recipients of humanitarian aid, with considerable climate-related drought and water-related constraints on crop and livestock productivity (WFP, Citation2015). Since the Citation1980s, the Ethiopian government and international donors have spent considerable capital and resources to suppress the drought-impacted crisis. For instance, in response to the Citation2015 El Niño-induced drought (highest on record), the Ethiopian government has provided over $200 million for emergency support, while humanitarian needs demand additional international short-term support of $1.4 billion (HRD, Citation2016). Taking the lead, the government of Ethiopia allocated more than $735 million for the drought crisis in 2016. The international community also allocated over $1 billion in that year in addition to the other $985 million joint contributions of donors to address humanitarian needs and safeguard decadal development gains (HRD, Citation2017). Though such aids have been practical, it has always been inadequate to reverse the problem.
Drought is one of the most complex and least-understood types of environmental disasters (Mahyou et al., Citation2010; Mera, Citation2018; Saha et al., Citation2022) due to its multiple causing mechanisms operating at different temporal and spatial scales (Kiem et al., Citation2016). Being complex, vulnerability to drought is not a directly observable phenomenon. This attests to studying and quantifying livelihood vulnerability to drought being one of the most challenging tasks (Roy et al., Citation2022; Sehgal & Dhakar, Citation2016). As a result, available studies lack objective vulnerability information to prioritize and target the population at risk. Therefore, appropriate investigation of livelihood vulnerability to persistent droughts and using the results for drought planning is vital to improve the preparedness of a region affected (Naumann et al., Citation2014).
In Ethiopia, no detailed studies have been conducted on vulnerability to drought impacts at local levels. Many of the studies (Abeje et al., Citation2019; Asrat & Simane, Citation2017; Dendir & Simane, Citation2019; Endalew & Sen, Citation2020; Mekonen & Berlie, Citation2021; Simane et al., Citation2016; Tesso et al., Citation2012) conducted on vulnerability analysis are based primarily on climate change and variability impacts. Only a few studies (Hill & Porter, Citation2017; Maru et al., Citation2021) provide a detailed analysis of livelihood vulnerability, specifically to drought conditions. These studies noted the complex distribution of livelihood vulnerabilities across agro-ecologies and farm typologies. However, such larger-scale studies are too aggregated, and local variations are overlooked. Since the Ethiopian highlands are highly dissected and fragmented, the prevailing climate extremes like droughts and the sensitivity of agricultural systems to the recurring droughts can change over time and within a distance of a few kilometers (Maru et al., Citation2021). Therefore, livelihood vulnerability assessments available at the national or regional scales offered an insufficient understanding of context-specific livelihood vulnerabilities and systems resilience in drought-prone parts of the Ethiopian highlands.
Although the previous studies have contributed their share to the current knowledge and understanding of livelihood vulnerability to climate change and associated droughts, there are still noticeable gaps that this study tried to fill. Therefore, the core objective of the study was to analyze drought-induced agricultural livelihood vulnerability through a comprehensive assessment of agro-meteorological, biophysical, and socio-economic variables in northeast highlands of Ethiopia, specifically North Wollo. Particularly, it tries to identify the major variables and quantify their level of influence in determining agro-based livelihood vulneraries to the drought-induced impacts; characterize the livelihood vulnerability situations of smallholder farmers across their livelihood zones and wealth ranks. The study introduced a modified form of livelihood vulnerability sourcebook approach (LVIVSBA) in measuring livelihood vulnerability in addition to the integrated livelihood vulnerability index (LVI). To the best of the authors’ knowledge, no such models have been applied for vulnerability analysis in Ethiopia. Hence, examining the effectiveness of LVIVSBA in measuring livelihood vulnerabilities against the livelihood vulnerability framework (LVI) approach is one of its objectives. To this end, the study contributed critical information to planners and donors, prioritizes households in need, and fine-tunes early warning systems and climate change adaptation measures. In effect, it helps to address the current drought-induced challenges and reduce future risks.
2. Vulnerability: Theoretical and conceptual framework
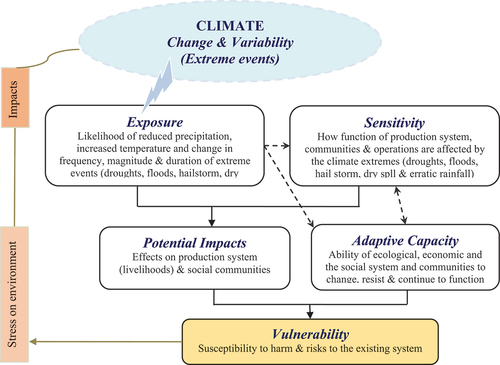
Vulnerability is a multifaceted concept (Jamshidi et al., Citation2018) that varies across temporal and spatial scales and is influenced by social, economic, demographic, cultural, geographic, institutional, governance, and environmental factors (Nair & Bharat, Citation2011). It is defined as the degree of risk and an individual’s or a social group’s ability or inability to respond to, in the sense of coping with, recovering from, or adapting to any external stress exerted on their livelihoods and well-being (Brooks et al., Citation2005; Chinwendu et al., Citation2017). The intergovernmental panel on climate change (IPCC) highlighted vulnerability as “a function of the character, magnitude, and rate of climate change and variation to which a system is exposed, its sensitivity, and adaptive capacity” (IPCC, Citation2001). These three components are capable of influencing vulnerability and may increase or decrease it according to characteristics inherent to the human or natural system imposing it (Hahn et al., Citation2009). Thus, the vulnerability of any system is typically thought to be a function of its exposure to a hazard, sensitivity to that hazard, and the system’s ability to cope with, adapt to, or recover from the impacts (Chinwendu et al., Citation2017).
As indicated in Figure , vulnerability and its three components (exposure, sensitivity, and adaptive capacity), as well as their determinants, are system-specific and place-specific. They can vary over time in the form of rising temperatures, drought episodes, extreme cold events, etc (Tesso et al., Citation2012). As vulnerability is context-specific and purpose-specific, none of the vulnerability concepts can be considered better or worse than the others (Mendoza et al., Citation2014).
Figure 1. A schematic diagram showing the relationship between vulnerability factors and extreme climate events.
3. Materials and methods
3.1. Study area
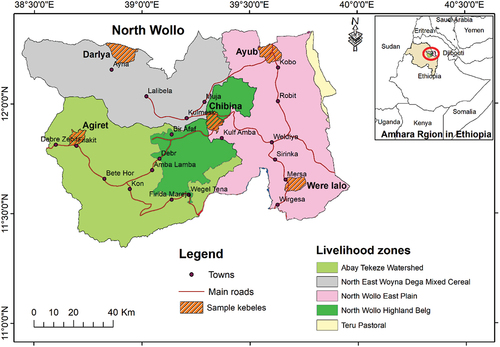
The study was carried out in the North Wollo Zone, part of the northeast highlands of Ethiopia (Figure ). It is located between 11°N and 12°N, and 39°E and 40°E, having a total area of 12,179.6 km2. The 10 rural districts of the Zone are dominated by rugged mountainous areas and steep slopes that limit farming activities. The altitude ranges from 968 m.a.s.l. in the Habru district to 4,258 m.a.s.l. in the Lasta district. Agro-ecologically, lowland (Kolla), mid-latitude (Woina-Dega), highland (Dega), and upper highland (Wurch) account for 38, 34, 21, and 7% of the zone, respectively (Gebre et al., Citation2017).
Figure 2. Map of the study area.
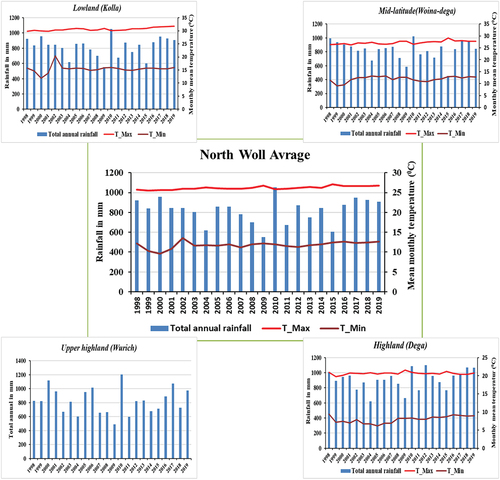
In 2017, the estimated population of the area was 1,824,361, where about 85.2% of the population lives in rural areas. Based on the temperature and rainfall data (1998–2019), the mean annual maximum temperature ranges from 20.6°C to 30.4°C in the highland and lowland areas, respectively. In contrast, the mean annual minimum temperature ranges from 7.1°C to 15.4°C in cool and warm drier parts the zone, respectively. The area receives a total annual rainfall of 1,061.2 mm in the woina-dega and 624.8 mm in the drier parts of the Kolla agro-ecologies (Figure ).
Figure 3. Rainfall and temperature distribution of North Wollo (1998–2019).
The smallholder farmers make their livelihoods from a mixed crop-livestock production system. We adopted the livelihood classification prepared by the FEWS NET (https://fews.net/east-africa/ethiopia/livelihood-zone-map/january-2018) to identify the four main livelihood zones in the area. Among the livelihood zones, North Wollo East Plain (NWEP), Northeast Woina-dega Mixed Cereal (NEWMC), Abay Tekeze Watershed (ATW), and North Wollo Highland Belg (NWHB), cover 32.6, 25.3, 29.4, and 11.4% area of the zone, respectively. Besides, the True pastoral livelihood zone covers the smallest area (1.3% of the zone). The dominant crops grown are barley, wheat, teff, sorghum, maize, and pulse. From livestock types, cattle, sheep, goats, donkeys, and horses are commonly raised in the area.
3.2. Data source and analytical tools
3.2.1. Socio-economic data
The primary data was obtained from a household questionnaire survey. A structured questionnaire was designed to address major and sub-indicators necessary for the livelihood vulnerability analysis. Five woredas were selected purposely from the four livelihood zones. From these, five rural kebele administrations were selected contingent on the area coverage of the livelihood zones and agro-ecologies using a simple lottery technique. Samples in each kebele account for the three wealth groups (better-off, medium, and poor). The classification was based on the standard set by the local agricultural office and later refined by the focus group discussions (FGDs).
A total of 274 samples were selected from the aggregated 7754 HHs of the specified kebeles, in the survey year 2020. Since the number of better-off, medium, and poor differs from kebele to kebele, probability proportionate to size was used to fix the sample size in each. Hence, from 638 better-offs, 2050 medium, and 5066 poor wealth groups, 22, 73, and 179 household samples were considered, respectively.
The Qualitative data was collected through the in-depth interviews of 20 key informants (KIs), discussion with five FGDs, and field observations. A purposive sampling technique was employed to select KIs and FGD participants. The KIs were experts in the Woredas, health extension workers, development agents, and elderly farmers. Each FGD consists of eight participants drawn from different ages, sexes, and wealth rankings. Open-ended questions and checklists were used for collecting data from KIs and FGDs.
3.2.2. Meteorological data
Daily precipitation and temperature data were obtained from the national meteorology agency of Ethiopia for five selected stations from 2000–2019. Such five stations (Kobo, Mersa, Lalibela, Kone, and Debrezebet) fairly represent the study area’s four agro-ecologies and four major livelihood zones. This data was used to see the vulnerability of farmers based on the change and variability of the meteorological components within the specified study period.
3.3. Method of analysis
3.3.1. Identification of livelihood vulnerability indicators
Recently, many scholars have used the indicator approach to construct a livelihood vulnerability index (LVI) in different contexts (Asrat & Simane, Citation2017; Weldegebriel & Amphune, Citation2017). The indicator approach, proposed by Hahn et al. (Citation2009), includes an explicit climate component and is framed in a way that allows for the use of household survey data (Antwi-Agyei et al., Citation2012). The output provides a snapshot of the livelihood vulnerability of a specific household, community, or system and does not capture the temporal and spatial changes.
In this study, we used the indicator approach integrated with a modified form of vulnerability sourcebook approach (LVIVSBA). To address the dynamic nature of the vulnerability, a local-level participatory approach was employed, including KIs, FGDs, and oral narratives to capture how vulnerability has evolved within the local community and analyze its trend. This provides a better understanding of how past biophysical and socio-economic activities have shaped vulnerability in such communities and offer useful insights into livelihood trajectories.
As introduced by Polsky et al. (Citation2007) and applied by Wu et al. (Citation2017), the vulnerability scoping diagram (VSD) and related set of indicators is a useful vehicle for conducting vulnerability assessment comparisons. We adopted the VSD model based primarily on the basic vulnerability components (exposure, sensitivity, and adaptive capacity). Such components are built on climatic and non-climatic stressors (Antwi-Agyei et al., Citation2016). The selection of indicators has been accomplished based on extensive literature (Asrat & Simane, Citation2017; Corobov et al., Citation2013; Mendoza et al., Citation2014; Simane et al., Citation2016) and discussions with experts. We categorized 12 vulnerability indicators under the three vulnerability factors (exposure, sensitivity, and adaptive capacity), comprising 66 sub-components (Table ).
Table 1. Levels of scoring for the proposed livelihood vulnerability indicators
All the 66 sub-components feasibly measure various aspects of livelihood vulnerability but may have some degree of overlap. Abson et al. (Citation2012) suggest that the extent of vulnerability should be quantified using independent/uncorrelated indicators in policy-relevant researches. So, we used PCA to sort out the independent indicators because it condenses a large number of variables into a smaller number of spatially explicit, potentially incommensurable variables while preserving as much information as possible (Sharma et al., Citation2018). Before we began the process, the Kaiser-Maier-Olkin (KMO) measure of sampling adequacy and Bartlett’s sphericity tests were used to test whether all the variables encoded within the dataset of 274 households could be factored for the PCA or not. The variables are suitable if the KMO values are greater than 0.5 and Bartlett’s sphericity test is significant at p < 0.05 (Jolliffe, Citation2002).
In the process, when the original indicators (variables) are correlated, the higher-order principal components (PCs) capture more total variability in the data than any single original indicator. Leaving out the lower-order PCs reduces the number of indicators while minimizing information loss (USAID, Citation2014). According to Kaiser’s rule, the cutoff for suitable components lies with those PCs having eigenvalues above one. Occasionally, however, when a variable provides independent information compared to the other variables, it would be unwise to remove it. In terms of total variance explained, a sensible cutoff is very often in the range of 70% to 90%, which can sometimes be higher or lower depending on the practical details of a particular data set. Accordingly, an eigenvalue of 0.7 was suggested to be the correct level of cutoff (Jolliffe, Citation2002) and thus, applied in this study. The other criteria for the component’s exclusion was its functional relationship. As explained above, only positively associated indicators were selected for adaptive capacity. Those with negatives were selected for exposure and sensitivity according to their order of influence loaded in the rotated component matrix table.
The PCA was run for each contributing factor revealing a total of 32 uncorrelated PCs. Such uncorrelated PCs are valuable because the scores of each PC encapsulate a unique trait of the overall livelihood vulnerability represented by the original set of the 66 indicators. Finally, 6, 8, and 18 components were identified for exposure, sensitivity, and adaptive capacity, respectively (Table ) for the overall livelihood vulnerability analysis. All the 32 components explain 82.9% of the total variation in the data set, sufficient to represent all the remaining variables. The total variance explained by those PCs enclosed under each vulnerability factor is above 70% (the minimum threshold for variable inclusion). Though the purposes may vary, several studies in Ethiopia (Asfaw et al., Citation2021; Maru et al., Citation2021; Mekonnene et al., Citation2019) and elsewhere (Dossou et al., Citation2021) have applied PCA either for data reduction or for assigning weights or both, which confirms with the validity of the PCA method used in this study.
Table 2. Test statistics to determine the appropriate principal components
3.3.2. Computing the livelihood vulnerability indices
When the sub-components used exist in a different scale of measurement, they need to be normalized to bring indicator values within the close range between zero and one (Jamshidi et al., Citation2018). In addition, it helps to normalize the range of continuous initial variables so that they all contribute equally to the analysis by avoiding the dominance of variables with a larger range over those with a smaller range.
In the household survey, sampled farmers were invited to respond to some of the sub-indicators seeking a response in the form of continuous data (e.g., age, farm experience, landholding, off-farm and non-farm income, etc.). The other sub-indicators have 2 to 4 alternatives that the farming households may respond to or are characterized by. Fortunately, weights were assigned to each alternative depending on their magnitude affecting smallholders’ livelihoods. Higher values were assigned to those which affect livelihood vulnerability to a greater extent, and lower values to those which raise their adaptive capacity comparably with the others listed. After all the values were fixed, weighted arithmetic aggregation was applied. This again was changed to percent impact or percent influence of the case at hand. Then, by setting the minimum percentage (10%) and the maximum (90%), normalization was accomplished to transform the indicator values into a metric scale that ranges from 0 to 1. Thus, the following two formulas (Asrat & Simane, Citation2017; Mendoza et al., Citation2014) were used for normalization (EquationEq. 1(1)
(1) ):
Where, Zi = the normalized value of sub-component indicator i (0–1); Xi = HHs original value of that indicator i; Xi-max = the highest value among all indicators; Xi-min = the lowest value among all indicators
3.3.3. Assigning weights
There is no standard weighting method against which the different weighting methods are tested for precision (Abson et al., Citation2012). Nonetheless, PCA is widely used in several studies (Boka, Citation2017; Maru et al., Citation2021; Mekonnene et al., Citation2019; Tesso et al., Citation2012) to construct indices for which there are no well-defined weights. In the present study, therefore, PCA was applied to generate weights for each vulnerability indicator based on the assumption that a common factor explains the variance in the vulnerability. PCA was run for the selected vulnerability factors of exposure, sensitivity, and adaptive capacity separately in SPSS software. The initial eigenvalues of the principal components retained were used as the weights for the indicators (EquationEq. 2(2)
(2) ) since each eigenvalue tells us about the fraction of the total variance explained by each loading. The weights assigned to each indicator vary between 0 and 1. This magnitude describes each indicator’s contribution to the index’s value (Dossou et al., Citation2021; Sharma et al., Citation2018).
Where, Wi = the weight of ith PC; Ei = the eigenvalue of the ith PC & P = the number of PCs retained
After weights were assigned and the standardized value for each sub-component was obtained, the aggregated index for contributing factors and the shares of major components from the scores became known. As applied by Hahn et al. (Citation2009), Adu et al. (Citation2018), and Panthi et al. (Citation2015), both the LVI framed by Hahn et al. (Citation2009) and the IPCC framework for calculating LVI (LVIIPCC) were used as a benchmark to evaluate the overall livelihood vulnerability of households to drought in different livelihood zones and agro-ecologies of their study area. In the present study, we used the modified version of the vulnerability sourcebook approach (LVIVSBA) instead of the LVIIPCC.
3.3.4. Livelihood Vulnerability Index (LVI)
The LVI was developed based on the livelihood vulnerability framework to analyze the major components of livelihoods and the sub-components (contextual factors) that influence them. As discussed in Table , 12 major components were designed for this analysis. Each major component is made up of several sub-components from which information was collected from each sample households. After the normalization process (EquationEq. 1(1)
(1) ), LVI was computed using Equationequation 3
(3)
(3) .
Where, LVI is livelihood vulnerability index; n is the number of major components; is the weight assigned to each major components and
is the computed vulnerability score of each major component
The weights allocated to each major component were based on the number of sub-components that make up each major component, and this was made practical to ensure that all the sub-components contribute equally to the overall LVI. The value of LVI was scaled from 0 to 1, showing low and extreme livelihood vulnerability, respectively.
3.3.5. Vulnerability Sourcebook Approach for Calculating LVI (LVIVSBA)
The other method used to compute LVI is the vulnerability sourcebook approach. This approach was designed after the fifth assessment report of the IPCC by Germany’s “Vulnerability Network’’ to assess domestic vulnerability across different sectors at the various administrative levels. It provides a practical and scientifically sound methodological approach to vulnerability assessments and its application in monitoring and evaluating climate adaptation. It was prepared so that it could support developing countries in their endeavor to achieve climate-resilient sustainable development (Fritzsche et al., Citation2014). However, its modified form is applied in the present study. It works as a function of the vulnerability factors (exposure, sensitivity, and adaptive capacity). This is defined by grouping the 12 major components within the vulnerability factors. Various sub-components were also incorporated into vulnerability measurement as the LVI approach. Before calculating LVIVSBA, standardization of the sub-components (EquationEq. 1(1)
(1) ) and aggregation of major components (EquationEq. 3
(3)
(3) ) into the assigned contributing factors were accomplished.
Where, CF = IPCC defined contributing factor; PCi = the ith sub-component value belonging to the vulnerability factors; Wi = the weight of sub-components; P = number of PCs
Then, exposure and sensitivity were aggregated into potential impacts (EquationEq. 5(5)
(5) ). Finally, as applied by Lindoso et al. (Citation2014), simple arithmetic aggregation of the potential impact and the adaptive capacity deducted from one was made using Equationequation 6
(6)
(6) to specify the LVIVSBA. This index was again scaled from 0 (the least vulnerable livelihood) to 1 (the most vulnerable livelihood).
Where, PI = potential impact; LVIVSBA = livelihood vulnerability index in vulnerability sourcebook approach
For more detail characterization, as applied by Mekonnene et al. (Citation2019), the LVI values obtained in both cases were categorized as low vulnerability (0 ≤ LVI ≤ 0.45), medium (0.45 < LVI ≤ 0.70), and high (0.70 < LVI ≤ 1.00). The data management and analysis were performed using software including SPSS (version 20), XLSTAT 2021, and Microsoft Office Excel sheets.
4. Results
4.1. Vulnerability to climate extreme events
Changes in climatic conditions, lit up by seasonal variations in temperature and rainfall amount, and associated extreme events determine the exposure of the farming households as a unit and the environmental system as a whole. A highly exposed environment has an undesirable effect on agricultural activities, which determines the livelihood vulnerability of the farming communities. We measured exposure by temperature and precipitation time series analysis and by examining the occurrence of climatic extremes (drought, hailstorm, etc.).
Since there is significant variation in climatic conditions across agro-ecologies or livelihood zones, their exposure to extreme climate events and associated hazards will also vary. The indicators of exposure filtered by the PCA for the livelihood zonation and the individual households of our study are shown in Table .
Table 3. Normalized values and vulnerability scores for the sub-components used to measure exposure
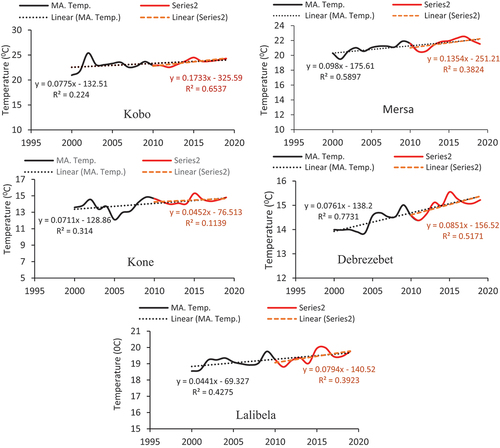
The trend analysis of time series temperature on the selected five stations (Figure ), showed variation in mean annual temperature, but an increasing trend in temperature was detected in all the livelihood zones in the last 20 years. The highest increase was observed in Mersa station (0.098 °C/year) in the NWEP and the lowest in Lalibela station (0.044 °C/year) in the NEWMC livelihood zone. During the recent decade (2010–2019), the mean annual temperature of most stations have shown the highest trend of increase as compared with the earlier decade. This is an indication that recent years have been warmer than the years before a decade, having a greater influence on the agricultural system and thereby intensifying agricultural livelihood vulnerability. Due to this, the sub-indicator “change in temperature” has a value with a uniformly increasing trend that does not fulfill one of the assumptions (sampling adequacy) required for the PCA analysis. Hence, all the livelihood zones and wealth ranks were directly assigned the maximum normalized value of one out of the PCA.
Figure 4. Trend of temperature change in North Wollo (2000 – 2019). Kobo & Mesra stations for North Wollo East plain (NWEP); Lalibela for North east woina-dega mixed cereal (NEWMC); Debrezebit for Abay Tekez watershed (ATW); Kone for North Wollo highland belg (NWHB) livelihood zones. Red-colored trend lines and equations show the temperature trend of the recent decade.
4.2. Sensitivity of farmers to the biophysical environment and the agriculture system
The temperature rise and untimely rainfall registered in all the study sites are creating more conducive conditions for the different crop and livestock diseases to disseminate, various pests to infest, and troublesome weeds to prevail. They are considered among the major constraints in boosting agricultural production. Key informants and FGD discussants also confirmed that the year-to-year rise in temperature and untimely rain that occurs before or ahead of the agricultural calendar was the primary cause of the high prevalence of crop and livestock diseases, pests, and weeds. One of the soil and water conservation experts in Gidan woreda said,
One can easily feel that the temperature is increasing from year to year. Late-onset and early cessation of rainfall have seriously affected the agricultural activities. Moreover, untimely rain just before a harvesting period is also becoming common, quite different from before. It spoils standing crops by physically dumping them and making seeds germinate. The rising temperature coupled with untimely rain paves the way for different crop weeds to prevail, pests to infest, and diseases that we are not accustomed to before easily disseminate. (28 March 2020)
As indicated in Table , crop weed prevalence was the primary determinant factor. Based on the survey result, about 70.1% of the farmers rated crop weeds as their greatest crop production challenge. NWMC was highly affected by weed problems with a vulnerability score of 0.79, followed by NWEP (0.76) and NWHB (0.75). The Better-off were less affected by crop weeds (0.13) than the poor households (0.81) as they applied more farm inputs (improved seeds, pesticides, and herbicides). Besides, they have more access to information and the capacity to buy.
Table 4. Farmers sensitivity to the biophysical environment and agricultural system
Early warning of drought or other climate extremes can alert farmers to sell their livestock and buy food and other necessities before it shrinks or dies (van Ginkel & Biradar, Citation2021). Nonetheless, only few farmers in the study area obtained early warning information about drought and other climate extremes. Due to this, they were too sensitive to this vulnerability component. In relative terms, higher vulnerability scores are recorded in NWHB (0.77) and NWEP (0.74). Attributable to their higher access to information, the better-off were less sensitive (0.35) than the medium (0.71) and the poor (0.75) households.
The agricultural system was the other central spot of concern where the sensitivity of the smallholdings was examined for the vulnerability assessment. Generally, the significant sub-components with more weight and greater influence on the degree of sensitivity were access to irrigation, food self-sufficiency, and scarcity of livestock fodder. Geographically, NWHB (0.57) and NWMC (0.57) were more sensitive than the other livelihood zones. Economically, the poor households (0.59) were more sensitive and severely affected sections of the community than the middle and better-off households (Table ).
4.3. Adaptive capacity of the agricultural system
As observed in Table , the demographic characteristics incorporated three sub-components, including marital status, farm experience, and the productive age of a family. Various studies (Deressa et al., Citation2009; Tesso et al., Citation2012) found that the household head’s marital status and age, which also determine farm experience, influence their adaptation to drought-related impacts. Accordingly, the male-headed households and the married ones adapt more readily to climatic extremes than the female-headed and single ones. Over 87% of the sampled farmers have got married in the study area; thus, they were more adaptive (0.96) and less vulnerable.
Table 5. Adaptive capacity of the agricultural system in North Wollo, 2020
On the other hand, the farm experience of smallholders increases with age. Experienced farmers are expected to be more engaged in most adaptation options than less experienced ones. Due to this, they are likely to have more information and knowledge on drought conditions and related crop and livestock management practices. In the study sites of North Wollo, the sampled households have an average farm experience of 33.6 years, and with this, the study area obtained an adaptive capacity score of 0.53. All the better-off with the highest farm experience (39.6 years) were found to have by far the lowest vulnerability score (0.03) than the poor and medium households. A similar study conducted by Tesso (Citation2013) in western Ethiopia confirmed that households with many years of farm experience had higher levels of adaptive capacity and were characterized by lower vulnerability to climate-induced shocks.
Educational status can influence farmers’ decisions to adjust agricultural practices in response to climate extreme events. The sampled smallholders were characterized by low educational status, where around 64% of them were illiterate. Hence, the overall adaptive capacity towards education becomes much lower (0.04), with a slight difference across livelihood zones and wealth ranks. However, the survey result shows that about 62% of them were found to have at least one child in school. This can compensate for their education and possibly raise their adaptive capacity to the issue (0.35), making them relatively less vulnerable. This was confirmed by the findings of Asrat and Simane (Citation2017) in that the better the educational status of a household and its family members, the better the chance of adapting to the impacts of climate-induced extreme events.
4.4. Overall livelihood vulnerability of smallholder farmers to drought impacts
The vulnerability scores of the 12 major components across the four livelihood zones and wealth rankings are summarized in the spider diagrams (Figure ). In all agro-ecologies, farming households were found to be less resilient towards infrastructure (with an adaptive capacity score ranging from 0.04 to 0.21) and wealth with a score of 0.07 to 0.27. Similarly, these two indicators were lower among the different wealth rankings (Figure ) having the highest values for the better-off and the lowest for the poor. The diagram also revealed that ATW has relatively better livelihood diversification (0.69). At the same time, NWMC (0.88) was characterized by an appreciated perception of climate and associated droughts signifying that farmers are more willing to apply all remedial action and technology available to tackle drought impacts.
Figure 5. Spider diagram showing the vulnerability scores of major components across the livelihood zones (a), and wealth ranks (b); Triangular diagram showing the contributing factor scores of livelihood zones (c), and wealth rankings (d), North Wollo, 2020.
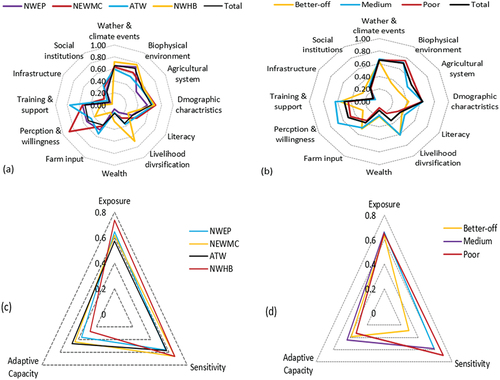
From the two vulnerability triangles, one can understand that the study area was characterized by higher exposure (0.653) and higher sensitivity (0.632) values, while it exhibited lower adaptive capacity (0.37). Minor differences do exist across the livelihood zones and wealth status. Consequently, NWHB has shown the highest exposure and minimum adaptive capacity, making the area highly vulnerable to drought impacts. It was also evident that the poor households exhibit the highest values of exposure and sensitivity and the lowest adaptive capacity (Figure ), making them more vulnerable than the other wealthy groups. One can also easily recognize from this figure that all the wealth groups have nearly similar exposure values to weather and climate events. Yet, their difference in livelihood vulnerability arises from their differential sensitivity and adaptive capacity.
Generally, the computed vulnerability scores assured that the smallholder farmers in all four livelihood zones were vulnerable to the adverse effects of drought because of high exposure, high sensitivity, and lower adaptive capacity. Exposure and sensitivity together indicated the potential impact of drought on livelihoods in the area (Table ). In this regard, all the livelihood zones were encountered with high potential impact. However, NWHB came up with the highest potential impact (0.701) and ATW with the lowest (0.575). Notable differences in potential impacts have also occurred across wealth rankings. Studies reported that the poor were more vulnerable to natural hazards than the better-off, yet poverty and vulnerability are not always linked (Wilhelmi & Wilhite, Citation2002). As expected, the poor smallholders exhibited the highest potential impact (0.673) than the middle (0.624) and better-off (0.464) ones. A similar finding by Antwi-Agyei et al. (Citation2012) advances this output by underlining that households considered rich by the local communities were less vulnerable to climate-induced impacts than the poor.
Table 6. Vulnerability scores of major indicators and the overall livelihood vulnerability to droughts in North Wollo, 2020
5. Discussion
Differential agriculture-based livelihood vulnerabilities to drought impacts have been observed in different parts of Ethiopia. Such vulnerabilities are also distinct in terms of variation in livelihood zones, and wealth ranks of the farming community (Maru et al., Citation2021; Wassie et al., Citation2023). In this study, livelihood vulnerability was assessed using two indices (LVI and LVIVSBA) through multiple major and sub-indicators. The scores of computed indices showed that farmers in all four livelihood zones were highly vulnerable to the negative effects of drought. Nevertheless, they showed varied vulnerability patterns.
5.1. Vulnerability to climate extremes, sensitivity and adaptive capacity
One of the indicators used to examine the livelihood vulnerability of farmers was considering their perceptions in the observed time-series pattern of precipitation, and associated impacts on agricultural production. Each household and the FGD discussants argued that the rainfall pattern was erratic. One of the KI in Worelalo kebele said that “the nature of rainfall is not like what has been before. In most of the recent years, rainfall comes late and ends early. Such onset and cessation of rainfall have created the greatest challenge in my agricultural production, where I have no other livelihood option.” Such unpredictable rainfall pattern during the main cropping season caused negative effects on crop production by disturbing the cropping calendar. In each livelihood zone, over 75% of the households reported that the late-onset and early cessation of rainfall greatly affected their agriculture. Consequently, higher vulnerability scores (0.82–0.91) were registered to it in all the livelihood zonation (Table ).
Drought, hailstorm, and extreme event occurrences were the other prioritized indicators for the vulnerability analysis. Overall, 94.5% of households reported that the extent of extreme events and their related impacts have been increasing in recent years. The issue is shared with households as high as 100% in NWEP and as low as (88%) in NWHB (dega and wurich agro-ecology) so that they are characterized by higher normalized scores accordingly (Table ). On the other hand, the hailstorms had no considerable impact on farmers’ livelihoods. Similar findings has been obtained by Maru et al. (Citation2021) in that the score of drought risk was the highest (0.61) in lowland areas than the other agro-ecologies over the Awash basin, Ethiopia.
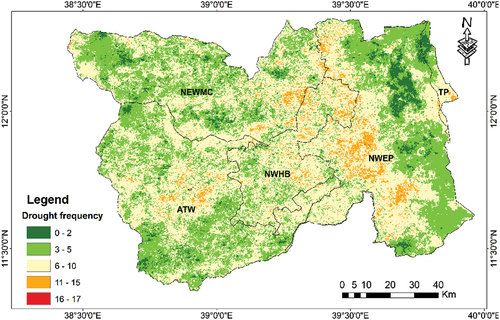
The frequency of drought occurrence was examined as one of the factors affecting the livelihood vulnerability of the rural community in North Wollo. Vegetation health index (VHI) was used to investigate the frequency of droughts in each livelihood zone (Figure ). In their agricultural drought characterization of the area, Wassie et al. (Citation2022) stated that about 56.5, 53.3, 56.8, and 77.9% of the area in NWEP, NEWMC, ATW, and NWHB livelihood zones, respectively, have been affected by drought more than five times in the last 20 years. The PCA also gave the priority and the highest weight for “drought recurrence” among the 10 input variables (indicators) of exposure. Accordingly, NWHB gained the highest vulnerability score (0.81), followed by NWEP (0.47), meaning that the area is highly exposed to extreme climatic events, indifference from the others. These two livelihood zones were characterized by the highest CF scores (0.74 and 0.65), where the NWHB was even higher than the entire area (0.65).
Figure 6. Vegetation health index (VHI) based agricultural drought frequency in North Wollo (2000–2019) across the livelihood zones. NWEP = North Wollo East plain; NEWMC = North east woina-dega mixd cereal; ATW = Abay Tekez watershed; NWHB = North Wollo highland belg; TP = True pastoral livelihood zones.
Farmers’ sensitivity to the biophysical environment and agricultural system has been observed to have influence on their agro-based livelihoods. Among these, soil erosion was considered one source of vulnerability, with no significant difference in vulnerability scores across wealth groups and livelihood zones (Table ). It is because farmers are always trying to maintain the fertility of their farm plots by applying chemical fertilizer (77.7%), manure (40.5%), and compost (23.3%). That is why they perceive it as not being a big deal in affecting their livelihood. Accordingly, it gained the lowest vulnerability score (0.19) against the other sub-components. However, this result complies with the findings of most studies (Asfaw et al., Citation2021; Simane et al., Citation2016; Tesso, Citation2013) that poor soil fertility still portends as the major challenge of the farming sector affecting livelihood vulnerability in different parts of Ethiopia.
Based on the survey results, most households (79.5%) reported that they are facing food shortages from one to nine months each year. Of these, 68.5% were under a food deficit for 3–9 months. The period of food scarcity falls during the months of the main crop growing season when the crop has not yet been harvested (from May to September, with a peak in July and August). Hence, this sub-indicator has gained the heaviest weight and the highest vulnerability score, with slight differences across livelihood zones (Table ). However, as was expected, the better-off households had the lowest score (0.33), and the poor had the maximum possible (1.00).
The poor and less capable households of Ethiopian smallholder farmers practice agricultural land rental intermittently. Accordingly, farmers in the study area rent their land to a fellow farmer for sharecropping or cash. One of the 72-year-old KI in Ayub kebele of Kobo district suggested his opinion as:
I and fellow farmers may rent our land to others for a variety of reasons, including a need for immediate cash, during lack of capacity to cultivate the land due to old age, widowhood (especially women, when their husband dies), sickness (for those with no sun to perform the task), poverty (when one has not even a single draft animal or cannot pay for plowing his plot), and during temporary departure from the residence in search of labor or other reasons. (20 March 2020)
Due to such facts, over 50% of women-headed households in the study area were renting out their land to other farmers. In addition, of the total 16.1% of households who rented out land in the entire area, 93.2% were poor. Hence, renting out the land was done mainly by the poor and less capable and most women farmers.
Adaptive capacity of the agricultural system of the farming households was measured using 9 major indicators and 18 sub-components. Livelihood diversification was considered as one indicator for measuring vulnerability. According to Boka (Citation2017), livelihood diversification has long been recognized as a drought risk management strategy and source of resilience. Engaging families in more livelihood options enables farmers to save money and improve their wealth status. In North Wollo, however, only 12.8% of the sampled households could save money after fulfilling their annual expenses in 2019. This makes their adaptive capacity very low (0.04). Only small portions of small holdings were engaged in off-farm (12.8%) and non-farm (18.6%) income sources. Some of the common activities that the farming households were engaged in were charcoal making, daily labor, crop and livestock trade, petty trade, wood log selling, and selling local drinks. However, the income obtained from off-farm and non-farm activities was not satisfactory, except for very few individuals. Hence, such engagements were not critically important in improving their adaptive capacity. Accordingly, the aggregated adaptive capacity for off-farm income (0.07), and non-farm income (0.12) was very low. Though, engaging in more livelihood options are essential and give chances to build resilience against the effects of droughts, the outputs of many studies such as Tesso et al. (Citation2012), Maru et al. (Citation2021), Wassie et al. (Citation2023) entail that most rural smallholders in various study areas were found less engaged in it.
Application of farm inputs such as fertilizer, improved seeds, herbicides, pesticides, etc., is one of the most important variables in maximizing crop production. Here, the application of improved seeds and pesticides was prioritized to see the situation of livelihood vulnerability and its adaptive capacity. In this regard, 39.1% of the respondents were found to have applied improved seeds at the time of the survey, with more application in ATW (82%), and the lowest in NWHB (14.7%). About 43.8% of the entire smallholders were applying pesticides. However, most farmers who used such farm inputs were found in NWEP (68.5%) than in the rest of the livelihood zones. Perhaps, this livelihood zone is found in kolla agro-ecology, where pest infestation is expected to be higher. Therefore, the adaptive capacity was relatively higher (0.73). However, the higher expense of buying chemicals should be reconsidered as the other obstacle that suppresses farmers’ adaptive capacity.
Farmers’ willingness to apply any future remedial action to mitigate and adapt to drought impacts and their perception of alleviating the problem was considered among the indicators to measure the adaptive capacity. Based on the results obtained, only 47% of the sampled smallholders confirmed the possibility of mitigating and adapting to drought impacts. The remaining 53% have a solid pessimistic attitude towards the issue. Thus, the entire area gained an aggregated adaptive capacity score of 0.51. In addition, about 53% of them were willing to apply any suggested remedial action and technology available to mitigate droughts. Of those farmers who were unwilling to take any recommended action in the future, 88.8% of them were without any formal education. This is a clear indication that educational status is an essential determining factor not only for the current but also for farmers’ future sacrifices to take action in drought impact adaptation. A similar result was highlighted by Deressa et al. (Citation2009) in their study on determinants of farmers’ choice of adaptation to climate change in the Nile Basin of Ethiopia. Therefore, more awareness creation is required, and bolder action should be taken to change their attitude and make them actively participate in future drought-related adaptation interventions.
In general, inadequate access to infrastructural services such as distance to market, access to road networks, credit, clinics, and veterinary services can influence farmers’ vulnerability to drought risks. Lacking access to these services induces low agricultural production and less adaptive capacity. For instance, households with easy market access have a chance of getting access to input, selling their products, exchanging information, and diversifying their livelihood. In the present study, the availability and accessibility of roads were prioritized in the PCA to measure the adaptive capacity of the smallholder farmers. In this regard, only 17.9% of the sampled farmers were found to live below 4 km from either all-weather or dry-weather roads. Hence, a great majority of farmers have been facing a big challenge in selling, buying, and transporting farm inputs and outputs. This dramatically lowers their adaptive capacity scores (0.1) and maximizes their vulnerability (0.9) to the issue.
It is a common tradition in Ethiopian society to engage and actively participate in different social institutions such as Idir and Mahber. O’Brien et al. (Citation2004) concluded that social institutions play a critical role in constraining and enabling farmers’ adaptation to the changing climate and its extreme events. Likewise, Deressa et al. (Citation2009) proved that social networks through such institutions play a significant role in the adoption of agricultural technologies by acting as conduits for financial transfers, solving credit constraints, and facilitating information transfer. In this regard, the sampled farmers were found more vulnerable to Iquib (0.01) and mekenajo (0.01) than their engagement in Idir (0.74).
5.2. Livelihood vulnerabilities across the livelihood zones and wealth ranks
Surprisingly, the livelihood vulnerability computed in both the livelihood vulnerability framework (LVI) and the LVIVSBA approach confirmed the same vulnerability ranks across the wealth groups and livelihood zones with minimal difference in vulnerability scores (Table ). However, in all the livelihood zones, the lowest and maximum vulnerability scores were obtained from LVIVSBA results (0.555–0.715) rather than the LVI score (0.583–0.681). NWHB, NWEP, NWMC, and ATW were ordered from the first to the fourth vulnerability rank using both index values. Similarly, the poor, medium, and better-off were relatively ranked from the highest to the lowest livelihood vulnerability.As indicated in Figure , since the LVIVSBA value ranges from 0–1, the value of the index directly shows the vulnerability and indirectly the non-vulnerable situations of households in the area. Both the highest (0.72) and lowest value of the index (0.28) was registered in NWHB livelihood zone indicating that it has the highest vulnerable and the lowest non vulnerable households compared to the other livelihood zones.
Figure 7. Livelihood zone-based agricultural livelihood vulnerability using LVIVSBA in North Wollo, 2020.
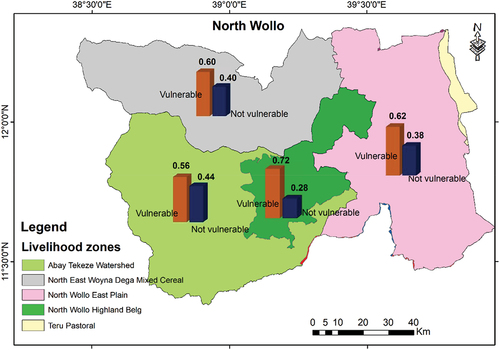
Hence, based on the (IPCC, Citation2001) vulnerability ranking, NWHB is categorized under high livelihood vulnerability and the rest as moderate. Together with this, since the whole system obtained a livelihood vulnerability index of 0.640 and 0.637 in LIV and LVIVSBA, respectively, it is characterized as moderate vulnerability. However, as the values of LVI in the system are approaching the intervals showing the highest vulnerability (0.7–1.0), an unprecedented effort is urgently required to minimize the level of potential impacts and successively raise their capacity to adapt.
6. Conclusions and policy implications
Ethiopia has been highly vulnerable to recurrent droughts. The rapidly changing climate likely exacerbated the drought-related problems of agricultural livelihoods. Therefore, examining livelihood vulnerability of the farming households by integrating local context socio-economic and biophysical data of various sources helps prioritize localities for timely interventions and evade future risks.
Based on the indicator method of assessment using LVI and LVIVSBA, the entire study area showed higher exposure to weather and climate events and higher sensitivity to the biophysical environment and agricultural system. Correspondingly, the study area revealed a lower adaptive capacity. The major sub-components which have more weight and greater influence on households’ sensitivity were access to irrigation, food self-sufficiency, scarcity of livestock fodder, and soil erosion. In addition, poor access to basic infrastructure and available technologies, low levels of livelihood diversification, inadequate economic resources, low educational status, lack of training and support, limited participation in social institutions, and low perception and willingness (knowledge, beliefs, attitudes, and concerns about) largely diminish the adaptive capacity of smallholder farmers and worsen their vulnerability. Therefore, the computed vulnerability scores indicated that the farmers in all four livelihood zones were vulnerable to the adverse effects of drought. However, there were differential livelihood vulnerabilities across the four major livelihood zones and wealth ranks.
In conclusion, the study calls for stakeholders to develop context-specific interventions to fortify the adaptive capacity of farmers and reduce their sensitivity so that drought-induced livelihood vulnerability can be reduced. This has to be complemented with timely early warnings to make farmers prepare ahead of stress and alert them to take the necessary action before the worst impact occurs. Besides, drought-induced livelihood vulnerability is a function of all the indicators and sub-indicators utilized for this study. Consequently, the weak and smaller indicator values observed within the different livelihood zones and wealth ranks should be considered the leading entry points to prioritize future interventions. Finally, the study wants to note that The LVIVSBA, as a new modified approach, is a useful index in measuring livelihood vulnerability, even better than the integrated livelihood approach (LVI) since it can numerically fix the potential impacts by using the exposure and sensitivity variables. However, most of the results of the study are obtained from the data collected at a snapshot of livelihood vulnerability situations, which does not capture the temporal and spatial changes. Thus, further research is recommended in the study area and other parts of Ethiopia to examine the livelihood vulnerabilities of farmers to drought-induced impacts, which are purpose-specific and context-specific in space and time.
Author’s contribution
The first author collect data, analyzes it, and wrote the manuscript. The second and third authors gave technical support and conceptual advice with comments for improvement. All authors discussed the contents, methods, and results of the manuscript. They also read, edit and approved it.
Availability of data
The datasets used during the current study are freely available on websites listed in the acknowledgment.
Acknowledgment
We would like to thank the USGS earth explorer for freely downloading different MODIS images of the study watershed from http://earthexplorer.usgs.gov. We also acknowledge the Ethiopian National Meteorological Service Agency for providing time series daily rainfall and temperature data of the study area. We are grateful to Bahir Dar University, for partially funding this project.
Disclosure statement
No potential conflict of interest was reported by the author(s).
Additional information
Funding
Notes on contributors

Simachew B. Wassie
Simachew Bantigegn Wassie has received his MA and Ph.D. in Environment and Natural resource management. Currently, he is full-time lecturers in the Department of Geography and Environmental Studies at Bahir Dar University, Ethiopia. He has been teaching several geography courses and has engaged in different research projects. He has keen research interests on issues of environment and natural resource management, climate change and variability, as well as livelihood and food security.
Daniel A. Mengistu
Daniel Ayalew Mengistu (associate professor) is an academic staff in Bahir Dar University, Department of Geography and Environmental Studies. He has been teaching several years in the field of remote sensing and geo-information science, advising many masters and PhD students, and published several articles.
Arega B. Birlie
Professor Arega Bazezew is an academic staff of in the department of Geography and Environmental Studies, Bahir Dar University. He has a special interest in livelihood and food security and research-related statistics. He has several years of teaching experience and has engaged in teaching courses across Ethiopia.
Daniel K. Waktola
Daniel Kassahun Waktola is currently working in the Department of Geographic Information Systems at Austin Community College in Austin, USA. He has a special interest in GIS and remote sensing and has several research publications related to the field.
References
- Abeje, M. T., Tsunekawa, A., Haregeweyn, N., Nigussie, Z., Adgo, E., Ayalew, Z., Tsubo, M., Elias, A., Berihun, D., Quandt, A., Berihun, M. L., & Masunaga, T. (2019). Communities’ Livelihood vulnerability to climate variability in Ethiopia. Sustainability, 11(22), 6302. https://doi.org/10.3390/su11226302
- Abson, D. J., Dougill, A. J., & Stringer, L. C. (2012). Using Principal Component Analysis for information-rich socio-ecological vulnerability mapping in Southern Africa. Applied Geography, 35(1–2), 515–29. https://doi.org/10.1016/j.apgeog.2012.08.004
- Adu, D. T., Kuwornu, J. K. M., Anim-Somuah, H., & Sasaki, N. (2018). Application of livelihood vulnerability index in assessing smallholder maize farming households’ vulnerability to climate change in Brong-Ahafo region of Ghana. Kasetsart Journal of Social Sciences, 39(1), 22–32. https://doi.org/10.1016/j.kjss.2017.06.009
- Antwi-Agyei, P., Dougill, A. J., Fraser, E. D. G., & Stringer, L. C. (2012). Characterising the nature of household vulnerability to climate variability: Empirical evidence from two regions of Ghana. Environment Development and Sustainability, 15(4), 903–926. https://doi.org/10.1007/s10668-012-9418-9
- Antwi-Agyei, P., Quinn, C. H., Adiku, S. G. K., Codjoe, S. N. A., Dougill, A. J., Lamboll, R., & Dovie, D. B. K. (2016). Perceived stressors of climate vulnerability across scales in the Savannah zone of Ghana: A participatory approach. Regional Environmental Change, 17(1), 213–227. https://doi.org/10.1007/s10113-016-0993-4
- Asfaw, A., Bantider, A., Simane, B., & Hassen, A. (2021). Smallholder farmers’ livelihood vulnerability to climate change-induced hazards: An agroecology-based comparative analysis in Northcentral Ethiopia (Woleka Sub-basin). Heliyon, 7(4), e06761. https://doi.org/10.1016/j.heliyon.2021.e06761
- Asrat, P., & Simane, B. (2017). Characterizing vulnerability of crop-based rural systems to climate change and variability: Agro-ecology specific empirical evidence from the dabus watershed, Ethiopia. American Journal of Climate Change, 06(4), 643–667. https://doi.org/10.4236/ajcc.2017.64033
- Bayissa, Y., Maskey, S., Tadesse, T., van Andel, S., Moges, S., van Griensven, A., & Solomatine, D. (2018). Comparison of the performance of six drought indices in characterizing historical drought for the upper blue nile basin, Ethiopia. Geosciences, 8(3), 81. https://doi.org/10.3390/geosciences8030081
- Bento, V., Trigo, I., Gouveia, C., & DaCamara, C. (2018). Contribution of Land Surface Temperature (TCI) to vegetation health index: A comparative study using clear sky and all-weather climate data records. Remote Sensing, 10(9), 1324. https://doi.org/10.3390/rs10091324
- Boka, G. T. (2017). Measuring Ethiopian households’ resilience to climate change and variability. Research Fellow at the African Development Bank Group.
- Brooks, N., Adger, W., & Kelly, P. (2005). The determinants of vulnerability and adaptive capacity at the national level and the implications for adaptation. Global Environmental Change, 15(2), 151–163. https://doi.org/10.1016/j.gloenvcha.2004.12.006
- Chinwendu, O. G., Sadiku, S. O., Okhimamhe, A. O., & Eichie, J. (2017). Households vulnerability and adaptation to climate variability induced water stress on downstream Kaduna River basin. American Journal of Climate Change, 06(2), 247–267. https://doi.org/10.4236/ajcc.2017.62013
- Conway, D., Schipper, L., Yesuf, M., Kassie, M., Persechino, A., & Kebede, B. (2007). Reducing vulnerability in Ethiopia: Addressing the implications of climate change: Integration of results from Phase I. University of East Anglia, Overseas Development Group.
- Corobov, R., Sîrodoev, I., Koeppel, S., Denisov, N., & Sîrodoev, G. (2013). Assessment of climate change vulnerability at the local level: A case study on the Dniester river basin (Moldova). Scientific World Journal, 2013, 1–13. https://doi.org/10.1155/2013/173794
- Degefu, M. A., & Bewket, W. (2015). Trends and spatial patterns of drought incidence in the omo‐ghibe river basin, Ethiopia. Geografiska Annaler, Series A: Physical Geography, 97(2), 395–414. https://doi.org/10.1111/geoa.12080
- Dendir, Z., & Simane, B. (2019). Livelihood vulnerability to climate variability and change in different agroecological zones of Gurage Administrative Zone, Ethiopia. Progress in Disaster Science, 3, 100035. https://doi.org/10.1016/j.pdisas.2019.100035
- Dercon, S. (2004). Growth and shocks: Evidence from rural Ethiopia. Journal of Development Economics, 74(2), 309–329. https://doi.org/10.1016/j.jdeveco.2004.01.001
- Deressa, T. T., Hassan, R. M., Ringler, C., Alemu, T., & Yesuf, M. (2009). Determinants of farmers’ choice of adaptation methods to climate change in the Nile Basin of Ethiopia. Global Environmental Change, 19(2), 248–255. https://doi.org/10.1016/j.gloenvcha.2009.01.002
- Dossou, J. F., Li, X. X., Sadek, M., Almouctar, M. A. S., & Mostafa, E. (2021). Hybrid model for ecological vulnerability assessment in Benin. Scientific Reports, 11(2449). https://doi.org/10.1038/s41598-021-81742-2
- Endalew, H. A., & Sen, S. (2020). Effects of climate shocks on Ethiopian rural households: An integrated livelihood vulnerability approach. Journal of Environmental Planning and Management, 64(3), 399–431. https://doi.org/10.1080/09640568.2020.1764840
- Engdaw, M. M. (2014) Drought Trend Assessment Using Multi-Temporal Satellite products and In-Situ Data for Amhara Region, Ethiopia. Ph.D. Thesis
- Eze, E., Girma, Zenebe, A. A., Zenebe, G., & Teka, A. (2020). Feasible crop insurance indexes for drought risk management in Northern Ethiopia. International Journal of Disaster Risk Reduction International Journal of Disaster Risk Reduction, 47, 47. https://doi.org/10.1016/j.ijdrr.2020.101544
- Fritzsche, K., Schneiderbauer, S., Bubeck, P., Kienberger, S., Buth, M., Zebisch, M., & Kahlenborn, W. (2014). The Vulnerability Sourcebook: Concept and guidelines for standardised vulnerability assessments. Deutsche Gesellschaft für.
- Gebre, E., Berhan, G., & Lelago, A. (2017). Application of remote sensing and GIS to characterize agricultural drought conditions in North Wollo Zone, Amhara regional state, Ethiopia. Journal of Natural Sciences Research, 7(17), 41–50. https://doi.org/10.7176/JNSR
- Hahn, M. B., Riederer, A. M., & Foster, S. O. (2009). The Livelihood Vulnerability Index: A pragmatic approach to assessing risks from climate variability and change—A case study in Mozambique. Global Environmental Change, 19(1), 74–88. https://doi.org/10.1016/j.gloenvcha.2008.11.002
- Hermans, K., & Garbe, L. (2019). Droughts, livelihoods, and human migration in northern Ethiopia. Regional Environmental Change, 19(4), 1101–1111. https://doi.org/10.1007/s10113-019-01473-z
- Hill, R. V., & Porter, C. (2017). Vulnerability to drought and food price shocks: Evidence from Ethiopia. World Development, 96, 65–77. https://doi.org/10.1016/j.worlddev.2017.02.025
- HRD. (2016). Joint government and humanitarian partners’ document: 2016 humanitarian requirement document. OCHA. http://reliefweb.int/report/ethiopia/ethiopia-humanitarian-requirements-document-2016
- HRD. (2017). Joint government and humanitarian partners’ document: 2017 humanitarian requirements document. OCHA. https://reliefweb.int/report/ethiopia/ethiopia-humanitarian-requirements-document-17-january-2017
- IPCC. (2001) Climate change 2001: impacts, adaptation, and vulnerability: Contribution of working group ii to the third assessment report. Intergovernmental Panel on climate change (IPCC), Cambridge University Press
- Jamshidi, O., Asadi, A., Kalantari, K., Azadi, H., & Scheffran, J. (2018). Vulnerability to climate change of smallholder farmers in the Hamadan Province, Iran. Climate Risk Management, 23, 146–159. https://doi.org/10.1016/j.crm.2018.06.002
- Jolliffe, I. T. (2002). Choosing a subset of principal components or variables. In Bickel, P., Diggle, P., Fienberg, S., Krickeberg, K., Olkin, I., Wermuth, N., & Zeger, S. (Eds.), Principal component analysis, ser. Springer Ser. Statist. (2nd ed, pp. 111–149). Springer.
- Kiem, A. S., Johnson, F., Westra, S., van Dijk, A., Evans, J. P., O’Donnell, A., Rouillard, A., Barr, C., Tyler, J., Thyer, M., Jakob, D., Woldemeskel, F., Sivakumar, B., & Mehrotra, R. (2016). Natural hazards in Australia: Droughts. Climatic Change, 139(1), 37–54. https://doi.org/10.1007/s10584-016-1798-7
- Lindoso, D. P., Rocha, J. D., Debortoli, N., Parente, E. F., II, Bursztyn, M., Rodrigues-Filho, S., & Rodrigues-Filho, S. (2014). Integrated assessment of smallholder farming’s vulnerability to drought in the Brazilian Semi-arid: A case study in Ceará. Climatic Change, 127(1), 93–105. https://doi.org/10.1007/s10584-014-1116-1
- Mahyou, H., Karrou, M., Mimouni, J., Mrabet, R., & Mourid, M. E. (2010). Drought risk assessment in pasture arid Morocco through remote sensing. African Journal of Environmental Science and Technology, 4(12), 8.
- Maru, H., Haileslassie, A., Zeleke, T., & Esayas, B. (2021). Analysis of smallholders’ livelihood vulnerability to drought across agroecology and farm typology in the upper awash sub-basin, Ethiopia. Sustainability, 13(17), 9764. https://doi.org/10.3390/su13179764
- Mekonen, A. A., & Berlie, A. B. (2021). Rural households’ livelihood vulnerability to climate variability and extremes: A livelihood zone-based approach in the Northeastern Highlands of Ethiopia. Ecological Processes, 10(1), 55. https://doi.org/10.1186/s13717-021-00313-5
- Mekonnene, Z., Woldamanuel, T., & Kassa, H. (2019). Socio-ecological vulnerability to climate change/variability in central rift valley, Ethiopia. Advances in Climate Change Research, 10(1), 9–20. https://doi.org/10.1016/j.accre.2019.03.002
- Mendoza, M., The, B., Naret, H., Ballaran, J. V., & Arias, J. (2014). Assessing vulnerability to climate change impacts in Cambodia, the Philippines and Vietnam: An analysis at the commune and household level. Journal of Environmental Science and Management, 17(2), 78–91. https://doi.org/10.47125/jesam/2014_2/08
- Mera, G. A. (2018). Drought and its impacts in Ethiopia. Weather and Climate Extremes, 22, 24–35. https://doi.org/10.1016/j.wace.2018.10.002
- Nair, R. S., & Bharat, A. (2011). Methodological frameworks for assessing vulnerability to climate change. Institute of Town Planner, India Journal, 8(1), 01–15.
- Naumann, G., Barbosa, P., Garrote, L., Iglesias, A., & Vogt, J. (2014). Exploring drought vulnerability in Africa: An indicator-based analysis to be used in early warning systems. Hydrology and Earth System Sciences, 18(5), 1591–1604. https://doi.org/10.5194/hess-18-1591-2014
- O’Brien, K., Leichenko, R., Kelkar, U., Venema, H., Aandahl, G., Tompkins, H., Javed, A., Bhadwal, S., Barg, S., Nygaard, L., & West, J. (2004). Mapping vulnerability to multiple stressors: Climate change and globalization in India. Global Environmental Change, 14(4), 303–313. https://doi.org/10.1016/j.gloenvcha.2004.01.001
- OXFAM. (2011). Briefing on the horn of Africa drought 2011. Disaster risk reduction – fundamental to saving lives and reducing poverty. Oxfam GB, Oxford, UK.
- Panthi, J., Aryal, S., Dahal, P., Bhandari, P., Krakauer, N. Y., & Pandey, P. (2015). Livelihood vulnerability approach to assessing climate change impacts on mixed agro-livestock smallholders around the Gandaki River Basin in Nepal. Regional Environmental Change, 16(4), 1121–1132. https://doi.org/10.1007/s10113-015-0833-y
- Polsky, C., Neff, R., & Yarnal, B. (2007). Building comparable global change vulnerability assessments: The vulnerability scoping diagram. Global Environmental Change, 17(3–4), 472–485. https://doi.org/10.1016/j.gloenvcha.2007.01.005
- Roy, P., Pal, S. C., Chakrabortty, R., Chowdhuri, I., Saha, A., & Shit, M. (2022). Climate change and groundwater overdraft impacts on agricultural drought in India: Vulnerability assessment, food security measures and policy recommendation. Science of the Total Environment, 849, 157850. https://doi.org/10.1016/j.scitotenv.2022.157850
- Saha, A., Pal, S. C., Chowdhuri, I., Roy, P., Chakrabortty, R., & Shit, M. (2022). Vulnerability assessment of drought in India: Insights from meteorological, hydrological, agricultural and socio-economic perspectives. Gondwana Research, S1342937X22003197. https://doi.org/10.1016/j.gr.2022.11.006
- Sehgal, V. K., & Dhakar, R. (2016). Geospatial approach for assessment of biophysical vulnerability to agricultural drought and its intra-seasonal variations. Environmental Monitoring and Assessment, 188(3), 197. https://doi.org/10.1007/s10661-016-5187-5
- Sharma, J., Murthy, I. K., Esteves, T., Negi, P., Sushma, S., Dasgupta, S., Barua, A., Bala, G., & Ravindranath, N. (2018). Vulnerability and risk assessment: Framework, methods, and guideline. Indian Institute of Science.
- Shiferaw, B., Tesfaye, K., Kassie, M., Abate, T., Prasanna, B. M., & Menkir, A. (2014). Managing vulnerability to drought and enhancing livelihood resilience in sub-Saharan Africa: Technological, institutional and policy options. Weather and Climate Extremes, 3, 67–79. https://doi.org/10.1016/j.wace.2014.04.004
- Simane, B., Zaitchik, B. F., & Foltz, J. D. (2016). Agroecosystem specific climate vulnerability analysis: Application of the livelihood vulnerability index to a tropical highland region. Mitigation and Adaptation Strategies for Global Change, 21(1), 39–65. https://doi.org/10.1007/s11027-014-9568-1
- Teshome, A., & Zhang, J. (2019). Increase of extreme drought over Ethiopia under climate warming. Advances in Meteorology, 2019, 1–18. https://doi.org/10.1155/2019/5235429
- Tesso, G. (2013). Individual-level vulnerability to climate change impact among crop dependent communities of western Ethiopia. Journal of Agricultural Economics and Development, 2(9), 356–370.
- Tesso, G., Emana, B., & Ketema, M. (2012). Analysis of vulnerability and resilience to climate change-induced shocks in North Shewa, Ethiopia. Agricultural Sciences, 3(6), 871–888. https://doi.org/10.4236/as.2012.36106
- Touma, D., Ashfaq, M., Nayak, M. A., Kao, S.-C., & Diffenbaugh, N. S. (2015). A multi-model and multi-index evaluation of drought characteristics in the 21st century. Journal of Hydrology, 526, 196–207. https://doi.org/10.1016/j.jhydrol.2014.12.011
- UNDRR. (2021) Special report on drought 2021: Global Assessment Report on Disaster Risk Reduction. United Nations Office for Disaster Risk Reduction (UNDRR), Geneva.
- USAID. (2014). Spatial climate change vulnerability assessments: A review of data, methods, and issues, African and Latin American Resilience to Climate Change (ARCC). U.S. Agency for International Devlopment.
- van Ginkel, M., & Biradar, C. (2021). Drought early warning in agri-food systems. Climate, 9(9), 134. https://doi.org/10.3390/cli9090134
- Wassie, S. B., Mengistu, D. A., & Birlie, A. B. (2022). Agricultural drought assessment and monitoring using MODIS-based multiple indices: The case of North Wollo, Ethiopia. Environmental Monitoring and Assessment, 194(10), 787. https://doi.org/10.1007/s10661-022-10455-4
- Wassie, S. B., Mengistu, D. A., & Birlie, A. B. (2023). Agricultural livelihood resilience in the face of recurring droughts: Empirical evidence from northeast Ethiopia. Heliyon, 9(6), e16422. https://doi.org/10.1016/j.heliyon.2023.e16422
- Weldegebriel, Z., & Amphune, B. (2017). Livelihood resilience in the face of recurring floods: Empirical evidence from Northwest Ethiopia. Weldegebriel and Amphune Geoenvironmental Disasters, 4(10), 1–19. https://doi.org/10.1186/s40677-017-0074-0
- WFP. (2015) World Food Program: Year in Review 2015.
- Wilhelmi, O. V., & Wilhite, D. A. (2002). Assessing vulnerability to agricultural drought: A Nebraska case study. Natural Hazards, 25(1), 37–58. https://doi.org/10.1023/A:1013388814894
- Wu, J., Lin, X., Wang, M., Peng, J., & Tu, Y. (2017). Assessing agricultural drought vulnerability by a VSD Model: A case study in Yunnan Province, China. Sustainability, 9(6), 918. https://doi.org/10.3390/su9060918