
 ?Mathematical formulae have been encoded as MathML and are displayed in this HTML version using MathJax in order to improve their display. Uncheck the box to turn MathJax off. This feature requires Javascript. Click on a formula to zoom.
Abstract
Watershed development and management practices (WDMP) have become essential to rural livelihood development. However, studies related to the livelihood implication of WDMP should have been considered. The present study assessed the impacts of WDMP on the livelihoods of watershed practitioners and non-practitioner households in the central highlands of Ethiopia. The investigation showed that the difference between practitioner and non-practitioner households’ total livelihood status was insignificant; both ranged in average level indexed within 0.34–0.66. The impact analysis result revealed that due to the implemented WDMP, the agricultural productivity and incomes of the community increased, employment opportunities were generated, and social service and infrastructure were improved. As WDMP increases by one standard deviation, agricultural productivity, income, employment generation, and social service and infrastructure increase by 0.555, 0.493, and 0.461 standard deviations, respectively. This is in addition to any direct (unmediated) effect that WDMP may have on agricultural productivity, income and employment generation, and social service and infrastructure. The study suggests that the community needs to improve natural and social capital for agricultural productivity. Besides, policymakers and non-governmental development-oriented organizations need to invest in natural, social, and physical capital to improve the social service and infrastructure of the study area. Furthermore, the government must identify and promote human, financial, physical, and natural capital elements that increase the study area’s income and employment generation opportunities.
1. Introduction
A watershed is an area that drains to a common outlet and supplies water by surface or subsurface flow to a drainage system. It includes both bio-physical and socio-economic units, including all-natural resources, people, and their socio-economic activities within the confines of the drainage divide, which ranges in size from a tiny region to thousands of square kilometers drained by a freshet (Adams et al., Citation2000; Darghouth et al., Citation2008). Watershed development and management organize and guide land, water, and other natural resources used in a watershed to deliver products and services while minimizing the adverse effects on soil and watershed resources. It involves interactions between soil, water, and land on a socio-economic, human-institutional, and biophysical level (Farrington et al., Citation1997; Ffolliott et al., Citation2002; Pande, Citation2020; Roesner, Citation1997; K. Singh, Citation1991).
As watershed development and management activities have a potential role for improvement and development in the socio-economic and natural resource base of degraded watershed areas, developing countries have been implementing to support their livelihoods (Kerr, Citation2002; Organization & Aquaculture, Citation1999; Rao & Weekly, Citation2000; V. P. Singh & Woolhiser, Citation2002; A. K. Singh et al., Citation2002; Wani et al., Citation2003).
In Ethiopia, the history of watershed management initiatives dates back to the 1970s; Since then, it has been executed throughout the country (Bantider et al., Citation2019; Chimdesa, Citation2016; Desta et al., Citation2005; Gebregziabher et al., Citation2016; Gemi & Semane, Citation2020; Hurni et al., Citation2010; Lakew et al., Citation2005; Negasa, Citation2020). Studies found out the practices decrease soil loss, increase the vegetative cover and grassland, reduce runoff velocity, enhance water infiltration, enhance soil structure, crop yield, biomass production, groundwater recharge, reduce soil erosion, enhance water availability and quality, diversify household income sources, and improve both household income and savings in different parts of Ethiopia (Assan & Beyene, Citation2013; Mekuriaw, Citation2017; Meshesha & Birhanu, Citation2015; Siraw et al., Citation2018; Tadesse et al., Citation2017; Yaebiyo et al., Citation2015). However, most of the studies conducted in the area were up to evaluating the watershed management and development practices from a single point of view, focusing only on its biophysical or environmental contribution without quantifying the overall change in the livelihood of the household.
Therefore, the study’s primary purpose was to measure the effect of watershed management and development practices on the livelihood assets of rural households in Ethiopia’s central highlands. The study assessed the livelihood status of watershed practitioners and non-practitioners first, measured the relationships between livelihood assets, that is, social, human, natural, physical, and financial capitals and watershed development and management practices; and finally examined the role of watershed development and management practices on income and employment generation, agricultural productivity, and social service and infrastructure.
2. Theoretical and conceptual frameworks
The study analyzed and understood rural livelihoods in terms of people’s access to five different types of capital assets, how households combine and transform those assets to build livelihoods that, to the greatest extent possible, meet their material and experiential needs, how households can use and enhance their social capital and how they can connect with other players in ways defined by the logics of the state, market, and associations in order to build their asset bases (Adams et al., Citation2000). It emphasizes the significance of combining different assets to achieve successful livelihood outcomes (Baffoe & Matsuda, Citation2018; Bebbington, Citation1999; F. Ellis, Citation2000; I. Scoones, Citation2009).
Watershed development and management practices are viewed as a vehicle to improve the livelihood security of rural people in many parts of the world. This study employed an analytical framework based on the sustainable livelihood framework model with necessary modifications. The sustainable livelihood perspective provides an opportunity to stand back and explore how watershed development and management affect the livelihoods of people experiencing poverty and how these impacts can be enhanced (Chambers & Conway, Citation1992; Dfid, Citation1999).
The livelihood framework allows one to “‘map’” the consequences of specific changes, including changes brought about through external interventions intended to improve people’s lives. Various studies have emphasized various aspects of watershed development and management intervention in the watershed areas and their impact on sustainable rural livelihoods. Interventions can aim to strengthen different capital assets depending on the needs of local communities, including food security, agricultural productivity, provision of social services and infrastructures, job creation, technology transfer, savings and credit, and so on (Bezemer et al., Citation2005; F. Ellis, Citation2000; F. Ellis, Citation2000; Reddy & Soussan, Citation2004; Sayer & Campbell, Citation2004).
The study assessed the impact by modifying the sustainable livelihood framework (Figure ). The purpose of applying the modified SLF in this study is the crucial factors affecting people’s livelihoods and the existing typical relationships presented. In the framework, livelihood assets include those capabilities, assets, and activities required for a means of living (Hussein, Citation2002; Natarajan et al., Citation2022). There are human, social, natural, physical, and financial capitals represented by pentagons that show households’ differential access to assets (Dfid, Citation1999; Karki, Citation2021). Livelihood outcome encompasses three latent variables of income and employment generation, agricultural productivity, and social service and infrastructure epitomized by a circle shape (Kassegn et al., Citation2021; Marchang & Studies, Citation2018; Mfunda & Røskaft, Citation2011). The framework assesses the relationship among WDMP, livelihood assets, and livelihood outcomes. Each indicator and variable were adapted and modified from (Carladous et al., Citation2019; Carney, Citation1998; F. Ellis, Citation2000; Mengistu & Assefa, Citation2020; Qasim et al., Citation2019; I. Scoones, Citation1998; Watson et al., Citation2002).
Figure 1. Conceptual framework.

The livelihood asset parameters (social, human, natural, physical, and financial capitals) were investigated through watershed development and management practices. Their impact is measured through the livelihood outcomes in income and employment generation increment, agricultural productivity, and social service and infrastructure; other outcomes are beyond the scope of the study. To verify which livelihood assets positively impact livelihood outcomes through WDMP, we must examine the relationship between WDMP and all five livelihood assets. The conceptual framework is based on the hypothesized relationships among latent variables and selected variables.
Human capital was measured by four variables, i.e., the household’s head age, years of education completed, the household size, and the number of the labor force in the household (Bingen et al., Citation2003; Chambers & Conway, Citation1992; Dfid, Citation1999; Solesbury, Citation2003). The financial status of households is assessed in terms of several income sources, agricultural and non-agricultural incomes of a household annually, the total size of livestock, and the availability of a source of credit (Dfid, Citation1999; I. Scoones, Citation1998; Solesbury, Citation2003). Social capital is the base for development and stability in all societies (Esfandeh et al., Citation2021; Xiong et al., Citation2021). The social capitals of the watershed communities were analyzed on their membership in any social organizations, their social network and harmony, and the presence of NGOs or local institutions (Chambers & Conway, Citation1992; Dfid, Citation1999; Katz, Citation2000; Ninan & Lakshmikanthamma, Citation2001; Solesbury, Citation2003). The physical capital status of the household is assessed on the components such as the quality of the housing structure, the types of items the household hold, the convenience of public transportation, and the distance to the nearest market (Chambers & Conway, Citation1992; Dfid, Citation1999; Rakodi, Citation1999; Solesbury, Citation2003). The status of households’ natural capitals is assessed in elucidations for understanding the factual position of the natural capital in terms of access to agricultural land, area of farmland belonging to the household, and area of high-quality farmland belonging to the household (Chambers & Conway, Citation1992; Dfid, Citation1999; Solesbury, Citation2003).
The watershed development and management (WDMP) are measured by the types of practices in the study watershed. WDMP is presented in terms of 11 manifest variables (). The manifest variables include the construction of soil and stone bund, fanyajuu bund, gully rehabilitation with check dam, drainage ditches, cut-off drain, grass/shrubs/strip, agroforestry, area closure, compost, legume-cereal crop rotation, and inter-cropping. Livelihood outcome encompasses three latent variables: income and employment generation, agricultural productivity, and social service and infrastructure ().
Table 2. Selected latent and manifested variables of watershed development practices and their outcomes
Variables, including increased income, employment generation, and household expenditure on food consumption, clothing, education, health, and entertainment, measure income and employment generation. Agricultural productivity, the third variable, manifested through variables; increased water availability, land use pattern, crop yield, cropping pattern, and increased status of fodder and livestock. The fourth variable, entitled social service and infrastructure quantified by six manifest variables: the presence of NGOs and local institutions, increment of the social relationship, improved access to transportation, health, and education, and better housing conditions of the household.
3. Materials and methods
3.1. Description of the study area
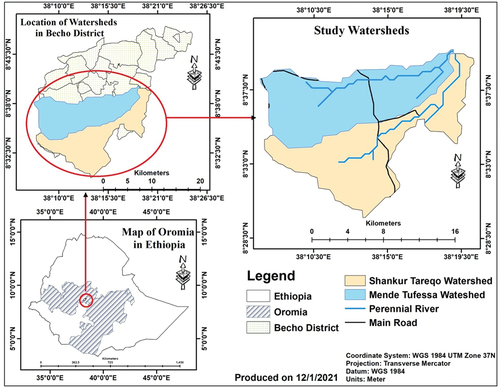
The study was conducted in the Becho woreda (Figure ) found in the Oromia regional state, part of the central highlands of Ethiopia, where watershed development and management activities are being implemented. Specifically, the study was conducted in two selected watersheds in the district (Shankur and Mende-Tufesa). These watersheds originated in southwest Oromia of central Ethiopia at about 80 km from the capital city, Addis Ababa, and 34 km from the zone capital, Woliso. They have a total area of 4358 ha, of which Mende-Tufesa contains about 2210 ha, whereas Shankur contains the remaining 2148 ha. Shankur and Mende-Tufesa watersheds exhibited altitude ranges from 2286 to 2773 and 2247–2755 m above sea level. Astronomically, the selected watersheds are between 8°32’25” − 8°36’45” N and 38°7’40” − 38°12’20” E (Tadese, Citation2020).
Figure 2. Map of the study area.
The watersheds lie exclusively on the headwaters of the Awash River basin. Different landforms, which include plains, slightly dissected side slopes, and piedmonts, characterize the area and degraded extinct central volcanoes, caldera remnants, and associated forms of high relief (Leenaars et al., Citation2016). One perennial river (Urago River) and two seasonal rivers (Shankur and Tareko Rivers) are in the study watersheds. Riverine and scattered trees and scrub are the predominant vegetation types found there. Over 90% of soils in the watersheds are verticals, locally known as TikurAfer. This soil is fertile and preferred for agricultural production, even though preparing the farm for production is challenging relative to other soil forms (Haileyesus & Mekuriaw, Citation2021). The significant watershed development and management activities carried out in the study watersheds are the construction of soil and stone bund, fanyajuu bund, gully rehabilitation with check dam, drainage ditches, cut off drain, grass/shrubs/strip, agroforestry, area closure, compost, legume-cereal crop rotation, and inter-cropping.
3.2. Sample technique and sample size determination
The study employed a multistage sampling technique to select a representative sample of the study households. In the first stage, the Becho district amongst the central highlands of Ethiopia was selected purposely. In the second stage, two watersheds were purposively selected through visual field observation and in consultation with experts of the Agricultural and Natural Resources Office of Becho Woreda, development agents (DAs), and local people. The watersheds were picked considering the subjectivity of watershed development and management practices in the area. The Shankur watershed (treated or a watershed subjected to different management practices) and the Mende-Tufesa watershed (supposed as a control watershed) are adjacent. Those areas are similar in Agro climate conditions, soil types, and land topography. Finally, in the third stage, sampled households from the selected study watersheds select using systematic random sampling techniques. The survey was conducted with the household heads of each sample household.
A proportional random sampling technique was applied to fix the sample size in the selected watershed sites. The total number of household heads in the selected sub-watershed or villages was 1636, of which 801 were from Shankur and 835 were from Mende-Tufesa . The sample size was determined by Kothari’s (Kothari) formula, which is described as follows;
Where n = sample size, Z= the value on the Z score at 95% confidence level = 1.96, e = Sampling error at 5%, p= = maximum population variability at 50%. i.e. (0.5), and q = 1-p = 0.5. The overall sample size of the study was determined as 312 households, of which 49% were from Shankur, and 51% were from Mende-Tufesa (Kothari, Citation2004).
3.3. Methods of data collection and analysis
The primary data was collected through key informant interviews, Focus Group Discussions (FGDs), and household surveys. In-depth interviews were conducted with key informants, including village heads, elders, and government officials. Five FGDs were conducted, three accompanied based on a single category design (Rabiee, Citation2004) for village elders and government officials comprising six to eight members each. The researcher administered the other two FGDs with a multiple-category design of eight and nine mixed participants. Each group discussion lasted 2 hours and 50 minutes until saturation was reached. Finally, a cross-sectional survey research design was employed to collect necessary information related to household characteristics and access to the five livelihood assets (natural, physical, financial, human, and social) using a structured questionnaire survey. Secondary data was collected from annual reports, journals, books, and census documents published and unpublished government reports.
Descriptive and inferential statistics were the main techniques used to analyze the quantitative data. Statistical Package for Social Sciences (SPSS) software version 26 and Microsoft Excel 2016 were used to manage and analyze the data. Besides, to test the hypothesized structural equation model, AMOS 23.0 was employed, and the maximum likelihood estimation was used to examine the proposed hypothetical model. Qualitative data generated through open-ended questionnaires, interviews, FGDs, and field observation were analyzed qualitatively by triangulating quantitative data.
3.3.1. Measuring the livelihood status of households
Eighteen variables representing the five livelihood assets (described in Table ) of selected watersheds were selected to measure the livelihood status of the household. The primary reasons for the selection of these variables were based on the works of literature and observational findings depending on the state of livelihood conditions and the role of watershed development and management practices for the watershed communities under study.
Table 1. Selected indicators and their unit
Human capital is measured by four variables, i.e., the household’s head age, level of education, household size, and the number of the labor force in the household (Bingen et al., Citation2003; Chambers & Conway, Citation1992; Dfid, Citation1999; Solesbury, Citation2003). The financial capital of households is assessed in terms of several income sources, the annual agricultural and non-agricultural income of the household, the total size of livestock, and the availability of a source of credit (Dfid, Citation1999; I. Scoones, Citation1998; Solesbury, Citation2003). The natural capital of the household is assessed in elucidations for understanding the factual position of the natural capital in terms of access to agricultural land, area of farmland and its fertility belonging to the household, and area of high-quality farmland belonging to the household (Chambers & Conway, Citation1992; Dfid, Citation1999; Solesbury, Citation2003). The physical capital of the household is assessed on the components such as the quality of the housing structure, the types of items in the household, the convenience of public transportation, and the distance to the nearest market (Chambers & Conway, Citation1992; Dfid, Citation1999; Rakodi, Citation1999; Solesbury, Citation2003). Finally, the social capital of the watershed communities was analyzed based on their membership in any social organizations, social networks, and harmony, and the presence of NGOs or local institutions in the study area (Chambers & Conway, Citation1992; Dfid, Citation1999; Katz, Citation2000; Ninan & Lakshmikanthamma, Citation2001; Solesbury, Citation2003).
After scheming livelihood assets with their relevant indicators, we adopted various scaling and indexing methods to make them comparable and to allow meaningful interpretation. Most of the indicators’ scores used in the study have been determined using rating scale methods. The rating scale method with varying weights was used to determine these variables. The indices derived from the variables in this study were between 0 to 1; higher values showed better livelihood assets. We then depicted these indices in the livelihood asset pentagon, a sustainable livelihood framework component (Qasim et al., Citation2019; Shivakoti & Shrestha, Citation2005).
According to the works of literature reviewed, indicators are determined in terms of different weight ages; with two critical values of 0 and 1 interpreted as poor and good, respectively; with three critical values of 0.33, 0.66, and 1 interpreted as poor, average, and good, respectively; with four critical values 0.25, 0.50, 0.75 and 1 interpreted as poor, average, good and very good respectively (Dutta & Guchhait-Barddhaman, Citation2018; Ibrahim et al., Citation2017; H. Liu et al., Citation2018; Z. Liu et al., Citation2018; Pelletier et al., Citation2016; Shivakoti & Shrestha, Citation2005). After calculations of the weight and calculation of the relevant indices for the concerned variables, we calculated a composite measurement index for each type of capital using an integrated measurement equation as follows;
Where: C= is the criteria score for each asset (0 ≤ C ≤ 1); n= denotes nth indicators of criteria (n = 1, 2, 3 … n); I= denotes the indicator; and T= denotes the total number of indicators.
Whereas we calculated the total livelihood assets for each watershed as follows;
Where LA= denotes livelihood assets; HC= refers to human capital; NC= natural capital; PC= physical capital; FC= financial capital, and SC= social capital.
The study conducted nonparametric Kruskal-Wallis tests to illustrate the livelihood asset differences between communities. It is used to test for the statistical significance of the results. Kruskal—Wallis tests were performed to examine whether there were significant differences among the household groups. These techniques compare the means of various groups to the relationship between a categorical explanatory variable and a quantitative response variable (Agresti & Finlay, Citation2009; Mavah et al., Citation2018; Quandt et al., Citation0000).
3.3.2. Measuring the relationships and impact of WDMP on livelihood assets
The Structured Equation Modeling (Gemi and Semane) method analyzes the data and investigates the causal relationship between latent and measurable observed variables. SEM is grouped under a combination of factor analysis and structural models: regression analysis/path analysis (Hox & Bechger, Citation1998). It allows for complex relationships between one or more independent variables and one or more dependent variables. SEM allows for ease of interpretation of latent variables and, as a model, has been implemented and scored good results by diverse studies (Gomez & Stavropoulos, Citation2021; Le Dang et al., Citation2014; Schreiber et al., Citation2006; Suárez et al., Citation2022; Villeneuve et al., Citation2018; Wang et al., Citation2021).
A two-step procedure for SEM took place. In the first step, goodness-of-fit testing was conducted. The goodness of fit allows the adequacy of the tested SEM to be evaluated. The second step evaluates how much it supported the hypothesized relationships between the latent variables within the current sample (Anderson & Gerbing, Citation1988). There were nine latent variables in the structural equation model (Gemi and Semane) examined. Specifically, the latent variables of livelihood outcome involve income and employment generation, agricultural productivity, and social service and infrastructure. The latent variable of watershed development and development is its practices. The latent variables of livelihood assets entail natural, human, physical, financial, and social capital.
The latent variables of livelihood assets involved natural capital, human capital, physical capital, financial capital, and social capital (described in Table ). We measured the relationships of each latent variable by five-point Likert scales that ranged from 1 (strongly disagree) to 5 (strongly agree).
4. Results and discussion
4.1. Livelihood status of the community
The status of the livelihood assets of Shankur Tereqo watershed and Mende-Tufesa watershed (supposed as a control watershed) units were comparatively analyzed based on the five capital statuses of the livelihood assets (Table ).
Table 3. Status of livelihood assets of Shankur Tereqo watershed and Mende-Tufesa watershed
4.1.1. Status of human capital
Human capital entails a combination of abilities that endow households or individuals with earning livelihoods accomplishment. Based on this study, the percent value of mean scores for indicators used showed a slight increase in the Shankur-Tereqo watershed (0.513) compared to the watershed (0.508). According to a livelihood index ranging from 0 to 0.33, interpreted as poor, one with 0.34–0.66 is average, and 0.67–1 is good. The human capital index of the study area lies within a range of 0.34–0.66; as a result, we can conclude that the household within the watershed had an average human capital and ranked second amongst livelihood assets studied in the highest index. Households living in both watersheds belonged to an average category of the human capital improvement scale.
The discussion with key informants revealed that the migration of youths from rural areas was widespread in the surveyed areas. The study investigated households’ human capital as an essential component of the livelihood generation; however, youths considered the backbone of the household in the agriculture arena need to be more engaged in labor. Migrating is an option for many youths. The focus group discussion noted that youths of the households flee to urban or the nearest city for different reasons. Amongst the suggested reasons, the following were pioneers; looking for a job, getting married to an urban dweller for better education, and considering living in a city as a dream life.
4.1.2. Status of financial capital
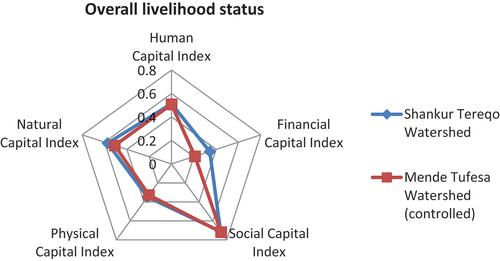
The financial capital of the household denotes the financial resources that individuals use to achieve livelihood objectives (Ibrahim et al., Citation2018). The status of financial capital showed one step ahead in the Shankur-Tereqo watershed (0.343) compared to the Mende Tufesa watershed (0.210). The financial capital status of the Shankur-Tereqo watershed, according to the score index value range, was within the 0.34–0.66 range analyzed as average (Figure ). In contrast, the controlled watershed was interpreted as poor in the 0 to 0.33 range. The Shankur-Tereqo watershed households belong to average financial capital than the control one. Comparatively, the household within the watershed lived with poor financial capital and ranked fifth or the lowest index value amongst livelihood assets studied.
Figure 3. Total livelihood index.
4.1.3. Status of social capital
The social capital index of the study area ranked first amongst other livelihood assets; as a result, we can conclude that the household within the watershed had the highest or good social capital. The percent value of mean scores on account of indicators used showed a slight increase in the watershed (0.719) compared to the Shankur-Tereqo watershed (0.711), though the difference is insignificant. According to a livelihood index, this result showed up in a good range of 0.67–1. Almost 95% of the members of the watershed community were a member of the local finance group (Equb), religious group or spiritual group (Mahiber), mutual support association (Edir), and self-help labor (Debo/Jige). There were also households, but few actively participated in the political arena, being political party members of the ruling government (Cabine) and local peacekeepers (Mlisha).
4.1.4. Status of physical capitals
We assessed the status of physical capital in the quality of housing structure, types of items the household hold, convenience of public transportation, and the distance to the nearest market. The value of financial capital showed a slight increase in the Shankur Tereqo watershed (0.348) compared to the Mende Tufesa watershed (0.328). According to the range of scored index, the control watershed is valued within the 0 to 0.33 range, which is interpreted as poor; In contrast, the scored value of another watershed slightly joined an average livelihood index. Even though the aggregated mean of physical capital calculated ranges under 0.34. We can conclude that both watersheds were under poor physical capital and ranked fourth or the second-lowest index value amongst livelihood assets studied.
They traditionally built houses with low-quality walls (gidegeda), roofs (Natarajan et al.), and floors (wolele). Researchers saw only a few stone buildings during the field research. The absence of financial means to invest, deficiency of credit, and lack of infrastructures, such as roads most times, led them to live in a traditional insecure house. During the focus group discussions and field research, researchers noted that access to the study area was almost only on unsealed dirt roads. Since most villages are in a hilly or mountainous landscape, dirt roads often pass difficult conditions at transforming altitudes and land subject to regular flooding. The lack of transport infrastructure had a significant constraint faced by the households living in the area, particularly with market activities throughout the year (livestock, shopping, going to the hospital, social engagement) and especially during and after the time of harvest (cereals). Though the surveyed watersheds are near urban centers, they isolated the communities as paved roads are missing.
The key informants reported a lack of basic infrastructure as one of the significant constraints in their areas. The electricity supply was none. Some middle-income or wealthy households get electric power and light from solar panels. Unlike radio and TV, mobile communications within the sampled watershed are common; most household heads and youths have occasional access within their household. None of the household understudies owns a vehicle, so reaching the urban areas, where hospitals, secondary schools, markets, and wage labor opportunities lay only by walking or using a donkey or mule in most of the villages in dry seasons. They also reported a lack of primary health care in the village among the significant constraints in rural life. Clinics are challenging to reach because of poor roads. They also reported a lack of water in the houses during FGD as a significant limitation in their everyday life in their watershed districts.
4.1.5. Status of natural capital
We have made elucidations for understanding the factual position of the natural capital status of the households in terms of access to agricultural land, area of farmland belonging to the household, and area of high-quality farmland belonging to the household. The value of natural capital showed a slight increase in the Shankur-Tereqo watershed (0.573) compared to the watershed (0.509). According to the range, the scored index value of both watersheds laid within the 0.34 to 0.66 ranges, which are interpreted as average. Almost all household heads in the watershed run agriculture with average natural capital. During field research, researchers observed large parts of the landscape around the villages as highly degraded by flood erosion, as natural resources such as trees and shrubs were unsustainably collected from the wild; deforestation was a significant issue.
4.1.6. Comparison of livelihood assets within the study area
The Pentagon (Figure ) showed comprehension and comparative livelihood status of each sample’s watershed and described the status of livelihood assets as a realm. A total livelihood index ranged from 0.34–to 0.66, labeled as the watershed understudy were average in livelihood assets. The overall livelihood status of the Shankur-Tereqo watershed (0.497) is slightly higher than the control watershed (0.454), even though it ranged at the same level regarding the livelihood asset index.
The Kruskal-Wallis test calculated the statistical results of 18 variables related to five types of livelihood assets, and the results in Table illustrate that the livelihood situation is the same labeled “Average.” However, the changes in different capital are associated with different results and features. The watershed’s Financial and physical capital value is below 0.33, interpreted as poor compared to the Shankur-Tereqo watershed. Although there is an increase in some variance, human capital and natural capital values still belong to the interval “0.33–0.66”, which shows that the status of human capital and natural capital in livelihood assets are insignificant, representing an “Average” change. Social capital: the value of social capital showed a significant change compared to the other capitals, and the values for both watersheds belong to the “Good” category. The Kruskal-Wallis test resulted as there is no significant difference between the livelihood status of the Mende Tufesa and Shankur Tereqo watershed households.
Table 4. Overall livelihood asset index
4.2. The relationship between WDMP and livelihood assets
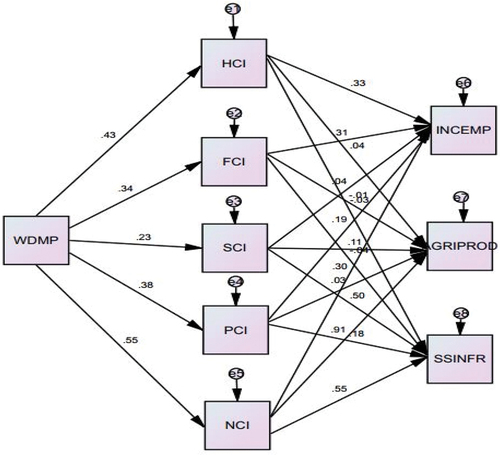
The hypothesized SEM is based on the selected variables, and the hypothesized relationships among latent variables presented in Figure are examined using path analysis using AMOS 23.0. All paths are included in creating just-identified models. Two steps were processed to improve model fit. First, delete the variables whose measurement error variances are negative (Bank et al., Citation1990). In our case, none of them were subjected to deletion since all the result in Figure was positive. Finally, the revised SEM was presented in Figure after deleting the paths with P values higher than 0.1. The data resulted in a model fit presented in Table .
Figure 4. Hypothesized structure equation model (Gemi and Semane).
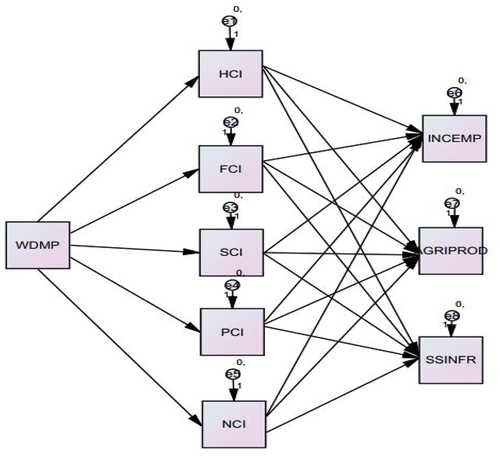
Table 5. Model fit indices for structural model
Figure 5. Second Drafted SEM.
The study tested the reliability of the manifest variables with the latent variable. Cronbach’s α was used to check the reliability of the manifest variable and resulted in a defining part of the latent variable as Cronbach’s α value was more significant than 0.675 in the test. Therefore the manifest variables with the latent variable have high internal consistency. The study also measured the amount of variance. The average variance extracted (AVE) and values were above 0.576 in the test. Therefore the manifest variables with the latent variable had high discriminant validity. The correlation matrix is presented in Table . Values in corresponding rows and columns are the construct correlations. The construct correlations of that latent variable with other latent variables exhibited high validity in the final SEM and supported the final model figured below in Figure .
Table 6. Implied (for all variables) Correlations
Figure 6. Final structural equation model.
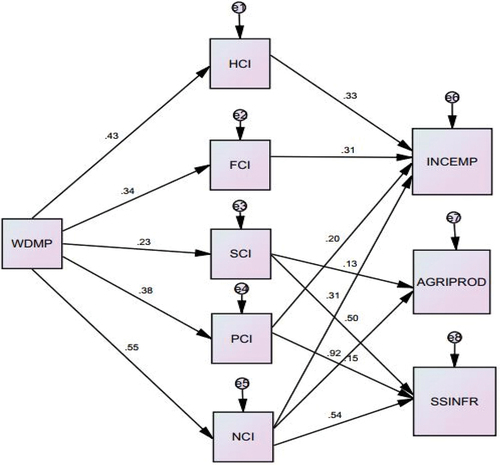
According to the result shown in Table , there is no relationship between HCI and AGRIPROD, HCI and SSINFR, FCI and AGRIPROD, FCI and SSINFR, SCI and INCEMP, and PCI and AGRIPROD respectively, while other relationships had a statistically significant and positive relationship with one another. There were statistically significant negative relationships between HCI and SSINFR, FCI and AGRIPROD, and FCI and SSINFR. Therefore, statistically insignificant relationships were rejected or not included in the final SEM developed.
Table 7. Standardized and unstandardized regression weights
Analysis in Table showed that watershed development and management practices (WDMP) had a statistically significant and positive relationship with human capital (HC) on standard estimation or path coefficient of 0.43. It means that when WDMP goes up by 1 standard deviation, HC goes up by 0.429 standard deviations. WDMP also had a statistically significant and positive relationship with the physical capital (PC) of the watershed community with a path coefficient of 0.378, interpreted as when WDMP goes up by 1 standard deviation, PC goes up by 0.378 standard deviations.
WDMP is positively related to the financial capital with a standard estimation or path coefficient of 0.336, meaning when WDMP goes up by 1 standard deviation; the financial capital of the household goes up by 0.336 standard deviations. According to the path analysis, the natural capital of the watershed had positively correlated with WDMP on the path coefficient of 0.553, meaning as WDMP goes up by 1 standard deviation, and NC of the rural household of the community goes up by 0.553 standard deviations. Watershed development and management practices had a statistically significant positive relationship with the social capital of the households by a path coefficient of 0.232, which means an increase of WDMP by 1 standard deviation; SC goes up by 0.232 standard deviations.
WDMP generally had statistically significant and positive relationships with all livelihood assets. WDMP had the highest correlation or significant positive relationship with natural capital compared to livelihood assets. In contrast, it had the lowest correlation with social capital, yet a statistically significant positive relationship existed.
4.3. The impact of WDMP on livelihood outcomes
Table shows the path coefficients for watershed development and management practices (WDMP) and its standardized direct and indirect effects on the five livelihood assets, income and employment generation, agricultural productivity, and social services and infrastructure.
Table 8. Path coefficients for watershed development and management practices (WDMP)
4.4. The impact of WDMP on income and employment generation
The standardized direct (unmediated) effect of WDMP on INCEMP is 0.000 (Figure ). Nevertheless, the standardized indirect (mediated) effect of WDMP on INCEMP is 0.493. That is, because of the indirect (mediated) effect of WDMP on INCEMP when WDMP goes up by 1 standard deviation, INCEMP goes up by 0.493 standard deviations. This is besides any direct (unmediated) effect WDMP may have on INCEMP.
Figure 7. Standardized effect of WDMP on INCEMP.
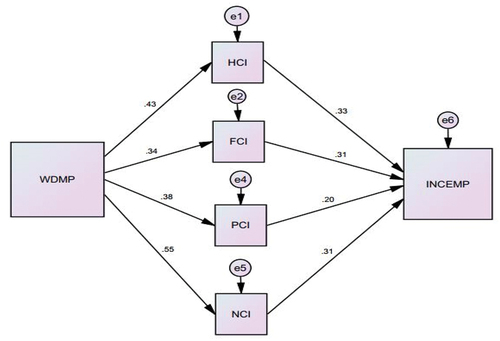
The results of SEM show that the watershed development and management practices as a mediated factor had a significant positive relationship with income and employment generation through livelihood assets of HC, PC, NC, FC, and SC. WDMP has impacted the household’s income-generating and employment-generation potentials by impacting households’ livelihood assets, incredibly human, financial, physical, and natural capital. The standardized direct (unmediated) effect of social capital on INCEMP has been estimated at 0.035; it was not significantly different from zero (p = .483).
The standardized direct (unmediated) effect of HCI on INCEMP is 0.328. Because of the direct (unmediated) effect of HCI on INCEMP, when HCI goes up by 1 standard deviation, INCEMP goes up by 0.328 standard deviations. This is besides any indirect (mediated) effect that HC may have on INCEMP. The standardized direct (unmediated) effect of PCI on INCEMP is 0.191. That is, because of the direct (unmediated) effect of PCI on INCEMP when PCI goes up by 1 standard deviation, INCEMP goes up by 0.191 standard deviations. This is besides any indirect (mediated) effect that PCI may have on INCEMP. The standardized direct (unmediated) effect of NCI and FCI on INCEMP is 0.303 and 0.309, respectively. Because of NCI and FCI’s direct (unmediated) effect on INCEMP, when NCI and FCI go up by 1 standard deviation, INCEMP goes up by 0.303 and 0.309 standard deviations. This is besides any indirect (mediated) effect that NCI and FCI may have on INCEMP.
Watershed development and management practices were a means for the households to generate more income and create employment opportunities in the study area. WDMP can generate employment in the community and play a significant role in household income-generating activities by impacting households’ livelihood assets, incredibly human, financial, physical, and natural capital. According to FGDs, most of the study areas’ communities depend entirely on agriculture for their livelihood and have no other way to create job opportunities. Even if some finger-counted small businesses are in the community, like mini-market and mini-groceries, it is hard to conclude that they are created or established due to the direct impact of watershed development and management practices.
4.4.1. The impact of WDMP on agricultural productivity
The standardized indirect (mediated) effect of WDMP on AGRIPROD is 0.555 (Figure ). Because of the indirect (mediated) effect of WDMP on AGRIPROD, when WDMP goes up by 1 standard deviation, AGRIPROD goes up by 0.555 standard deviations. This is besides any direct (unmediated) effect WDMP may have on AGRIPROD. The results of SEM showed that the watershed development and management practices as a mediated factor had a significant positive relationship with agricultural productivity through the livelihood assets of natural and social capital. WDMP has impacted the households’ agricultural productivity by impacting households’ livelihood assets, incredibly natural and social capital. PC and FC directly impacted agriculture by 0.034 and 0.007 standard deviations; they were not statistically significant, with a p-value of (0.258 and 0.202) respectively. FCI’s standardized direct (unmediated) effect on AGRIPROD was negative (−.007), meaning when FCI goes up by 1 standard deviation, AGRIPROD goes down by 0.007 standard deviations. This is besides any indirect (mediated) effect that FCI may have on AGRIPROD with a p-value of 0.828.
Figure 8. Standardized effect of WDMP on AGRIPROD.
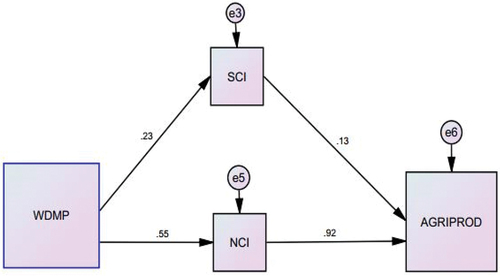
The standardized direct (unmediated) effect of NCI on AGRIPROD was 0.907. That is, because of the direct (unmediated) effect of NCI on AGRIPROD when NCI goes up by 1 standard deviation, AGRIPROD goes up by 0.907 standard deviations. This is besides any indirect (mediated) effect that NCI may have on AGRIPROD. The impact of WDMP on natural capital indirectly impacted the agricultural productivity of the household highly. It has also impacted agriculture productivity through social capital when SCI goes up by 1 standard deviation; AGRIPROD is up by 0.114 standard deviations. This is besides any indirect (mediated) effect that SCI may have on AGRIPROD.
The qualitative data reflected that in the study area, there was an increase in cropping area for double crops, a change in single to double-crop/mixed cropping, and an increase in crop production due to improvement in land and water conservation practices. In the study areas, WDMP has led to an increase in yields and cropping intensity due to various reasons. These reasons include increased residual moisture content from constructing soil and stone bunds, cut-off drains, and applying inter-cropping and compost.
4.4.2. The impact of WDMP on social services and infrastructure
The results of SEM specified that the standardized indirect (mediated) effect of WDMP on SSINFR is 0.461 (Figure ). That is, due to the indirect (mediated) effect of WDMP on SSINFR, when WDMP goes up by 1 standard deviation, SSINFR goes up by 0.461 standard deviations. This is in addition to any direct (unmediated) effect that WDMP may have on SSINFR. As a mediated factor, WDMP had a significant positive relationship with social services and infrastructure through the livelihood assets of natural, social, and physical capital. WDMP has impacted the households’ social services and infrastructure by impacting households’ livelihood assets, especially on natural capital next to social capital.
Figure 9. Standardized effect of WDMP on SSINFR.
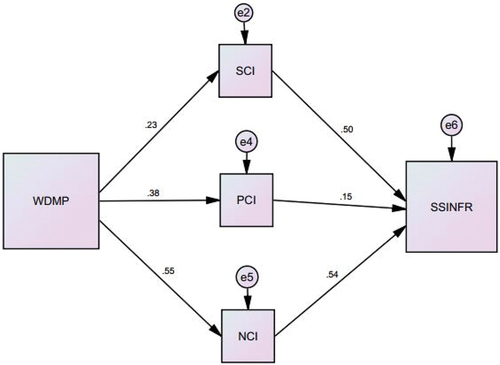
The standardized direct (unmediated) effect of NCI on SSINFR is 0.553. Because of NCI’s direct (unmediated) effect on SSINFR, when NCI goes up by 1 standard deviation, SSINFR goes up by 0.553 standard deviations. This is besides any indirect (mediated) effect that NCI may have on SSINFR. The standardized direct (unmediated) effect of SCI on SSINFR is 0.497. Because of the direct (unmediated) effect of SCI on SSINFR, when SCI goes up by 1 standard deviation, SSINFR goes up by 0.497 standard deviations. This is besides any indirect (mediated) effect that SCI may have on SSINFR. The standardized direct (unmediated) effect of PCI on SSINFR is 0.177. Because of the direct (unmediated) effect of PCI on SSINFR, when PCI increases by 1 standard deviation, SSINFR goes up by 0.177 standard deviations.
HC and FC directly impacted social services and infrastructure negatively by (−.027 and −.044), and they were not statistically significant with the p-value of (0.652 and 0.439), respectively. We can interpret it as when HC and FC go up by 1 standard deviation, SSINFR goes down by −0.027 and −0.044 standard deviations. This is besides any indirect (mediated) effect that HC and FC may have on SSINFR.
5. Conclusion
The study aimed to assess the impacts of WDMP on the livelihoods of the watershed community in the central highlands of Ethiopia using with and without approach.
The study found that the overall livelihood status of the study areas are labeled at an average level, and the watershed, which is developed and managed, showed a slight improvement in livelihood asset. Social capital was the highest among each livelihood asset studied, while financial capital counted the lowest. The watershed development and management practices have significant positive relationships with all livelihood assets; natural capital has the highest while social capital has the lowest correlation, yet a statistically significant positive relationship existed.
The study applied the structural equation model to examine the effect of watershed development and management practices on agricultural productivity, income, employment generation, and social service and infrastructure, resulting in a positive. As the community applied WDMPs, agricultural productivity, income and employment generation, and social service and infrastructure increased by 55%, 49%, and 46%, respectively. This is besides any direct (unmediated) effect that WDMP may have on agricultural productivity, income and employment generation, and social service and infrastructure.
The study finally established that more natural and social capital is vastly needed to enhance agricultural productivity in the watershed where the study was conducted. More natural, social, and physical capital is required to improve the study area’s social service and infrastructure. Finally, according to the analyzed data, more human, financial, physical, and natural capitals are compulsory to increase the study area’s income and employment generation opportunities.
The increasing benefit of WDMP helps households to upturn their human capital, financial capital, physical capital, natural capital, and social capital in the study area. The study recommends that non-practitioners mobilize and actively participate in WDMP in their areas. The practitioners must emphasize and work on natural and social capital improvement for agricultural productivity. Besides, development agents and communities need to invest more in natural, social, and physical capital to improve the social service and infrastructure of the study area. Furthermore, the government must identify and promote human, financial, physical, and natural capital elements that increase income and employment generation opportunities in the rural watershed areas. Policymakers should provide more livelihood-oriented policies in watershed areas to improve their households’ livelihood assets to raise agricultural productivity, income and employment generation, and social service and infrastructure.
Author Contribution
Temesgen Argaw Naji is a consultant at the Culinary Institute of Ethiopia, Addis Ababa, Ethiopia. He is a Ph.D. Candidate at the Center for Food Security, College of Development Studies, Addis Ababa University, Ethiopia. His research focuses on Agricultural Productivity, Income and Employment Generation, Social Service and Infrastructure, Food Security, and Watershed Development and Management Practices.
Disclosure statement
No potential conflict of interest was reported by the author(s).
Additional information
Notes on contributors
Temesgen Argaw
Temesgen Argaw Naji – A Ph.D. Candidate at the Center for Food Security, College of Development Studies, Addis Ababa University.

Meskerem Abi
Meskerem Abi (Ph.D.) - Assistant Professor, Center for Food Security, College of Development Studies, Addis Ababa University.
Esubalew Abate
Esubalew Abate (Ph.D.) - Assistant Professor, Center for Rural Development, College of Development Studies, Addis Ababa University.
References
- Abera, W., Assen, M., & Satyal, P. J. E. (2021). Development & Sustainability 2021. The synergy between farmers’ knowledge of soil quality change and scientifically measured soil quality indicators in Wanka watershed, northwestern highlands of Ethiopia. Environment Development and Sustainability, 23(2), 1316-1334.1387–585X. https://doi.org/10.1007/s10668-020-00622-3
- Adams, C., Noonan, T., Newton, B. J. I. F., Peter, F., Baker, M. B., Jr., Edminster, C. B., & Dillon, M. C. (2000). Watershed management in the 21st century: National perspectives. The Contributions of Watershed Management, 13 (USDA Forest Service, Proceedings, RMRS –P –13), 21–24.
- Agresti, A., & Finlay, B. (2009). Statistical methods for the social sciences.
- Anderson, J. C., & Gerbing, D. W. J. P. B. (1988). Structural equation modeling in practice: A review and recommended two-step approach. Psychological Bulletin, 103(3), 411.1939–1455. https://doi.org/10.1037/0033-2909.103.3.411
- Assan, J. K., & Beyene, F. R. J. J. O. S. D. (2013). Livelihood impacts of environmental conservation programs in the Amhara region of Ethiopia. Journal of Sustainable Development, 6(10), 87.1913–9063. https://doi.org/10.5539/jsd.v6n10p87
- Baffoe, G., & Matsuda, H. J. S. S. (2018). An empirical assessment of rural livelihood assets from gender perspective: Evidence from Ghana. Sustainability Science, 13(3), 815-828.1862–4057. https://doi.org/10.1007/s11625-017-0483-8
- Bank, L., Dishion, T., Skinner, M., Patterson, G. R. J. D., & Interaction, A. I. F. (1990). Method variance in structural equation modeling: Living with “glop.”. 247–279.
- Bantider, A., Gete Zeleke, G. D., Alamirew, T., Alebachew, Z., Providoli, I., & Hurni, H. J. S. S. S.-E. L. I. (2019). From land degradation monitoring to landscape transformation: Four decades of learning, innovation and action in Ethiopia. 19.
- Bebbington, A. J. W. D. Capitals and capabilities: A framework for analyzing peasant viability, rural livelihoods and poverty. (1999). World Development, 27(12), 2021–2044. 0305-750X. https://doi.org/10.1016/S0305-750X(99)00104-7
- Bezemer, D., Balcombe, K., Davis, J., & Fraser, I. J. A. E. (2005). Livelihoods and farm efficiency in rural Georgia. Applied Economics, 37(15), 1737-1745.0003–6846. https://doi.org/10.1080/00036840500215253
- Bezu, S., & Holden, S. T. (2013). Land access and youth livelihood opportunities in Southern Ethiopia.
- Bingen, J., Serrano, A., & Howard, J. J. F. P. (2003). Linking farmers to markets: Different approaches to human capital development. Food Policy, 28(4), 405-419.0306–9192. https://doi.org/10.1016/j.foodpol.2003.08.007
- Brunelli, C., & Gurbuzer, Y. (2021). Methodological guideline for monitoring SDG indicator 5. a. 1: Gender parity in tenure rights over agricultural land: Data collection methods and calculation. Food & Agriculture Org.
- Carladous, S., Tacnet, J.-M., Batton-Hubert, M., Dezert, J., & Marco, O. J. L. U. P. (2019). Managing protection in torrential mountain watersheds: A new conceptual integrated decision-aiding framework. Land Use Policy, 80, 464-479.0264–8377. https://doi.org/10.1016/j.landusepol.2017.10.040
- Carney, D. (1998). Sustainable rural livelihoods: What contribution can we make? Department for International Development London.
- Chambers, R., & Conway, G. (1992). Sustainable rural livelihoods: Practical concepts for the 21st century. Institute of Development Studies (UK).
- Chimdesa, G. (2016). Historical perspectives and present scenarios of watershed management in Ethiopia. Int J Nat Resour Ecol Manag, 1, 115–127.
- Darghouth. (2008). Watershed management approaches, policies, and operations: Lessons for scaling up
- Desta, L., Carucci, V., Wendem-Agenehu, A., & Abebe, Y. 2005. Community-based participatory watershed development. a guideline. annex.
- Dfid, U. J. L. D. (1999). Sustainable livelihoods guidance sheets. 445.
- Dutta, S., & Guchhait-Barddhaman, S. K. J. T. (2018). Measurement of livelihood assets in sustainable forest governance: A study in Burdwan forest division. West Bengal. Transactions, 40(2), 203.
- Ellis, F. (2000). Rural livelihoods and diversity in developing countries. Oxford university press.
- Ellis, F. (2000). The determinants of rural livelihood diversification in developing countries. Journal of Agricultural Economics, 51(2), 289-302.0021–857X. https://doi.org/10.1111/j.1477-9552.2000.tb01229.x
- Esfandeh, S., Danehkar, A., Salmanmahiny, A., Sadeghi, S. M. M., & Marcu, M. V. J. S. (2021). Climate change risk of Urban growth and land use/land cover conversion. An In-Depth Review of the Recent Research in Iran, 14(1), 338.2071–1050. https://doi.org/10.3390/su14010338
- Farrington. (1997). Scaling up participatory watershed development in India: Lessons from the Indo-German watershed development program. 17, 1–17
- Ffolliott, P. F., Baker, M. B., Edminster, C. B., Dillon, M. C., Mora, K. L. (2002). Land stewardship through watershed management: Perspectives for the 21st century. Springer Science & Business Media. https://doi.org/10.1007/978-1-4615-0589-1
- Gebregziabher, G., Abera, D., Gebresamuel, G., Giordano, M., & Langan, S. 2016. An assessment of integrated watershed management in Ethiopia. International Water Management Institute (IWMI). Working Paper 170. https://www.iwmi.cgiar.org/Publication.
- Gemi, Y., & Semane, B. (2020). Assessing the impact of watershed management interventions on livelihood of small-scale farmers and ecosystem services in choke mountains. East Gojjam Zone of Amhara Region.
- Gomez, R., & Stavropoulos, V. J. A. (2021). Confirmatory factor analysis and exploratory structural equation modeling of the structure of Attention-Deficit/Hyperactivity Disorder symptoms in adults. Assessment, 28(6), 1570-1582.1073–1911. https://doi.org/10.1177/1073191120905892
- Haileyesus, D., & Mekuriaw, A. J. H. (2021). The adoption impact of wheat-chickpea double cropping on yield and farm income of smallholder farmers in central highlands of Ethiopia: The case of Becho district. Heliyon, 7(6), e07203.2405–8440. https://doi.org/10.1016/j.heliyon.2021.e07203
- Hox, J. J., & Bechger, T. M. (1998). An introduction to structural equation modeling.
- Hurni, H., Abate, S., Bantider, A., Debele, B., Ludi, E., Portner, B., Yitaferu, B., & Zeleke, G. (2010). Land degradation and sustainable land management in the highlands of Ethiopia.3905835134.
- Hussein, K. J. L. 2002. Department for international development. Livelihoods approaches compared.
- Ibrahim, A. Z., Hassan, K. H., Kamaruddin, R. J. E. J. O. S. D., & Anuar, A. R. (2018). The level of livelihood assets ownership among vulnerability groups on the East Coast of Malaysia. European Journal of Sustainable Development, 7(3), 157-157.2239–6101. https://doi.org/10.14207/ejsd.2018.v7n3p157
- Ibrahim, A. Z., Hassan, K., Kamaruddin, R., & Anuar, A. R. J. I.-P. J. O. A. (2017). & Finance 2017. Examining the livelihood assets and sustainable livelihoods among the vulnerable groups in Malaysia. Indian-Pacific Journal of Accounting and Finance, 1(3), 52-63.2590–406X. https://doi.org/10.52962/ipjaf.2017.1.3.17
- Karki, S. J. I. J. O. S. S. & Management. (2021). Sustainable livelihood framework. Monitoring and Evaluation, 8(1), 266-271.2091–2986. https://doi.org/10.3126/ijssm.v8i1.34399
- Kassegn, A., Endris, E. J. C. F., & Yildiz, F. (2021). & Agriculture 2021. Review on livelihood diversification and food security situations in Ethiopia. Cogent Food & Agriculture, 7(1), 1882135.2331–1932. https://doi.org/10.1080/23311932.2021.1882135
- Katz, E. G. J. L. E. (2000). Social capital and natural capital: A comparative analysis of land tenure and natural resource management in Guatemala. Land Economics, 76(1), 114-132.0023–7639. https://doi.org/10.2307/3147261
- Kerr, J. J. W. D. (2002). Watershed development, environmental services, and poverty alleviation in India. World Development, 30(8), 1387-1400.0305–750X. https://doi.org/10.1016/S0305-750X(02)00042-6
- Kothari, C. R. (2004). Research methodology: Methods and techniques. New Age International.
- Lakew, D., Carucci, V., Asrat, W., Yitayew, A. J. M. O. A., Rural Development, A. A., & January, E. (2005). Community-based participatory watershed development: A guidelines. part 1.
- Le Dang, H., Li, E., Nuberg, I., Bruwer, J. J. E. S., & Policy. (2014). Understanding farmers’ adaptation intention to climate change: A structural equation modeling study in the Mekong Delta. Vietnam, 41, 11–22. 1462-9011. https://doi.org/10.1016/j.envsci.2014.04.002
- Leenaars, J., Eyasu, E., Wösten, H., González, M. R., Kempen, B., Ashenafi, A., & Brouwer, F. (2016). Major soil-landscape resources of the cascade intervention Woredas, Ethiopia: Soil information in support to scaling up of evidence-based best practices in agricultural production (with dataset). Cascape.
- Leta, T. B., Berlin, A. B., Ferede, M. B. J. H., & Communications, S. S. (2021). Effects of the current land tenure on augmenting household farmland access in South East Ethiopia. Humanities and Social Sciences Communications, 8(1), 1-11.2662–9992. https://doi.org/10.1057/s41599-021-00709-w
- Liu, Z., Chen, Q., & Xie, H. J. S. (2018). Influence of the farmer’s livelihood assets on livelihood strategies in the Western Mountainous Area, China. Sustainability, 10(3), 875. https://doi.org/10.3390/su10030875
- Liu, H., Zhang, C., Ji, Y., & Yang, L. J. F. I. H. N. (2018). Biological and psychological perspectives of resilience: Can stress resistance be improved? Frontiers in Human Neuroscience, 12, 326.1662–5161. https://doi.org/10.3389/fnhum.2018.00326
- Marchang, R. J. J. O. L., & Studies, R. 2018. Land, agriculture, and livelihood of scheduled tribes in North-East India. 6, 67–84. 2321-0249
- Mavah, G. A., Funk, S. M., Child, B., Swisher, M. E., Nasi, R., & Fa, J. E. J. B. C. (2018). Food and livelihoods in park-adjacent communities: The case of the Odzala Kokoua National Park. Biological Conservation, 222, 44-51.0006–3207. https://doi.org/10.1016/j.biocon.2018.03.036
- Mekuriaw, A. J. E. S. R. Assessing the effectiveness of land resource management practices on erosion and vegetative cover using GIS and remote sensing techniques in Melaka watershed. (2017). Ethiopia, 6(1), 1–10. 2193-2697. https://doi.org/10.1186/s40068-017-0093-6
- Mengistu, F., & Assefa, E. J. E. Development & Sustainability 2020. Enhancing livelihood assets of households through watershed management intervention program: Case of upper Gibe basin. (2020). Southwest Ethiopia, 22(8), 7515–7546. 1573-2975. https://doi.org/10.1007/s10668-019-00534-x
- Meshesha, Y. B., & Birhanu, B. S. J. J. O. W. R. & Protection. (2015). Assessment of the effectiveness of watershed management intervention in Chena Woreda. Kaffa Zone, Southwestern Ethiopia, 7(15), 1257. https://doi.org/10.4236/jwarp.2015.715102
- Mfunda, I. M., & Røskaft, E. J. I. J. O. B. S., 2011. Ecosystem services & management wildlife or crop production: The dilemma of conservation and human livelihoods in Serengeti, 7, 39–49. 2151-3732
- Natarajan, N., Newsham, A., Rigg, J., & Suhardiman, D. J. W. D. (2022). A sustainable livelihoods framework for the 21st century. World Development, 155, 105898.0305–750X. https://doi.org/10.1016/j.worlddev.2022.105898
- Negasa, D. J. J. I. J. E. P. P. (2020). Major constraints of watershed management practices in Ethiopia and ways forward. International Journal of Environmental Protection and Policy, 8(4), 70–76. https://doi.org/10.11648/j.ijepp.20200804.11
- Ninan, K., & Lakshmikanthamma, S. J. A. (2001). Social cost-benefit analysis of a watershed development project in Karnataka, India. AMBIO: A Journal of the Human Environment, 30(3), 157–161. 0044-7447 https://doi.org/10.1579/0044-7447-30.3.157
- Organization, W. H., & Aquaculture, J. F. N. W. S. G. O. F. S. I. A. W. P. F. 1999. Food safety issues associated with products from aquaculture: Report of a joint FAO/NACA/WHO study group. World Health Organization.
- Pande, C. B. (2020). Watershed management and development. Sustainable Watershed Development. Springer International Publishing. https://doi.org/10.1007/978-3-030-47244-3
- Pelletier, B., Hickey, G. M., Bothi, K. L., & Mude, A. J. F. S. (2016). Linking rural livelihood resilience and food security: An international challenge. Food Security, 8(3), 469–476. 1876-4525 https://doi.org/10.1007/s12571-016-0576-8
- Qasim, M., Qasim, S., Naeem, M., Khan, A. N., & Iqbal, S. J. S. J. O. A. (2019). Impact of destructive fishing practices on fishermen livelihoods in District Charsadda, Khyber Pakhtunkhwa Province of Pakistan. Sarhad Journal of Agriculture, 35(4), 35. 1016–4383 https://doi.org/10.17582/journal.sja/2019/35.4.1155.1165
- Quandt, A., Neufeldt, H., & Mccabe, J. T. J. E. & Society 2017. The role of agroforestry in building livelihood resilience to floods and drought in semiarid Kenya. 22.1708–3087
- Rabiee, F. J. P. O. T. N. S. (2004). Focus-group interview and data analysis. Proceedings of the Nutrition Society, 63(4), 655–660. 1475-2719. https://doi.org/10.1079/PNS2004399
- Rakodi, C. J. D. P. R. A capital assets framework for analyzing household livelihood strategies. (1999). Implications for Policy, 17(3), 315–342. 0950-6764. https://doi.org/10.1111/1467-7679.00090
- Rao, C. H. J. E., & Weekly, P. (2000). Watershed development in India: Recent experience and emerging issues. Economic and Political Weekly, 3943–3947. .
- Reddy, V. R., & Soussan, J. (2004). Assessing the impacts of watershed development programs: A sustainable rural livelihoods framework. Indian Journal of Agricultural Economics, 59(3), 331. .
- Roesner, L. A. (1997). Effects of watershed development and management on aquatic ecosystems. ASCE.
- Samuel Eze, A. J. D., Banwart, S. A., Sallu, S. M., Smith, H. E., Tripathi, H. G., Mgohele, R. N., Senkoro, C. J., & Senkoro, C. J. (2021). Farmers’ indicators of soil health in the African highlands. CATENA, 105336, 105336. 2021 ISSN 0341-8162. https://doi.org/10.1016/j.catena.2021.105336
- Sayer, J. A., & Campbell, B. M. (2004). The science of sustainable development: Local livelihoods and the global environment.
- Schreiber, J. B., Nora, A., Stage, F. K., Barlow, E. A., & King, J. J. T. J. O. E. R. Reporting structural equation modeling and confirmatory factor analysis results a review. (2006). Journal of Educational Research, 99(6), 323–338. 0022-0671. https://doi.org/10.3200/JOER.99.6.323-338
- Scoones, I. (1998). Sustainable rural livelihoods: A framework for analysis.
- Scoones, I. Livelihoods perspectives and rural development. (2009). Livelihoods Perspectives and Rural Development, 36(1), 171–196. 0306-6150. https://doi.org/10.1080/03066150902820503
- Shivakoti, G., & Shrestha, S. J. W. I. (2005). Analysis of livelihood asset pentagon to assess the performance of irrigation systems: Part 2—application of analytical framework. Water International, 30(3), 363–371. 0250-8060. https://doi.org/10.1080/02508060508691877
- Singh, K. (1991). Determinants of people’s participation in watershed development and management: An exploratory case study. Indian Journal of Agricultural Economics, 46, 278–286. .
- Singh, A.K., Eldho, T., Prinz, D. J. W. S., & Technology. Integrated watershed approach for combating drought in a semi-arid region of India: The case of Jhabua watershed. (2002). Water Science & Technology, 46(6–7), 85–92. 0273-1223. https://doi.org/10.2166/wst.2002.0666
- Singh, V.P., & Woolhiser, D. A. J. J. O. H. E. (2002). Mathematical modeling of watershed hydrology. Journal of Hydrologic Engineering, 7(4), 270–292. 1084-0699. https://doi.org/10.1061/(ASCE)1084-0699(2002)7:4(270)
- Siraw, Z., Adnew Degefu, M., & Bewket, W. J. L. E. (2018). The role of community-based watershed development in reducing farmers’ vulnerability to climate change and variability in the northwestern highlands of Ethiopia. Local Environment, 23(12), 1190–1206. 1354-9839. https://doi.org/10.1080/13549839.2018.1541344
- Solesbury, W. (2003). Sustainable livelihoods: A case study of the evolution of DFID policy. Citeseer.
- Suárez, A. E., Gutiérrez-Montes, I., Ortiz-Morea, F. A., Suárez, J. C., DiRienzo, J., & Casanoves, F. J. S. (2022). Contribution of livelihoods to the well-being of coffee-growing households in Southern Colombia. A Structural Equation Modeling Approach, 14(2), 743. https://doi.org/10.3390/su14020743
- Tadese, M. (2020). Analysis of determinants of improved dairy technologies adoption in Woliso District, Ethiopia. J. Agric. Vet. Sci. IOSR JAVS, 13(5), 10–17.
- Tadesse, Z., Kelbessa, E., & Bekele, T. J. T. P. R. (2017). Floristic composition and plant community analysis of vegetation in Ilu Gelan district, West Shewa Zone of Oromia region. Central Ethiopia, 4(2), 335–350. https://doi.org/10.22271/tpr.2017.v4.i2.045
- Villeneuve, B., Piffady, J., Valette, L., Souchon, Y., & Usseglio-Polatera, P. J. S. O. T. T. E. (2018). Direct and indirect effects of multiple stressors on stream invertebrates across the watershed, reach and site scales: A structural equation modeling better informing on hydro morphological impacts. Science of the Total Environment, 612, 660–671. 0048-9697. https://doi.org/10.1016/j.scitotenv.2017.08.197
- Wang, Y., Liu, X., Wang, T., Zhang, X., Feng, Y., Yang, G., & Zhen, W. J. C. (2021). Relating land-use/land-cover patterns to water quality in watersheds based on the structural equation modeling. Catena, 206, 105566. . https://doi.org/10.1016/j.catena.2021.105566
- Wani, S., Singh, H., Sreedevi, T., Pathak, P., Rego, T., Shiferaw, B., & Iyer, S. R. (2003). Farmer-participatory integrated watershed management: Adarsha watershed, Kothapally India-an innovative and upscalable approach. J. SAT Agric. Res, 2(1), 1–27.
- Watson, L. T., Lohani, V. K., Kibler, D. F., Dymond, R. L., Ramakrishnan, N., & Shaffer, C. A. J. J. O. C. I. C. E. Integrated computing environments for watershed management. (2002). Integrated Computing Environments for Watershed Management, 16(4), 259–268. 0887-3801. https://doi.org/10.1061/(ASCE)0887-3801(2002)16:4(259)
- Xiong, F., Zhu, S., Xiao, H., Kang, X., & Xie, F. J. S. (2021). Does social capital benefit the improvement of rural households’ sustainable livelihood ability? Based on the survey data of Jiangxi Province, China. China, 13(19), 10995. https://doi.org/10.3390/su131910995
- Yaebiyo, G. M., Tesfay, Y., Assefa, D. (2015). Socio-economic impact assessment of integrated watershed management in Sheka watershed, Ethiopia. Journal of Economics and Sustainable Development, 6(9), 202–212.