
 ?Mathematical formulae have been encoded as MathML and are displayed in this HTML version using MathJax in order to improve their display. Uncheck the box to turn MathJax off. This feature requires Javascript. Click on a formula to zoom.
Abstract
A field survey was conducted during February–May 2022 in Chhatradev rural municipality and Sitganga municipality with the purpose of analyzing the existing value chain of arabica coffee in Arghakhanchi district of Nepal. A sample size of 110 arabica coffee growers, comprising 55 from each municipality, was selected by using three-stage sampling method for interviews that used a pretested questionnaire. To study the value addition and trading aspects, six collectors and pulper operators and two secondary processors were selected. Descriptive statistics was applied to analyze the data. Input suppliers, producers, collectors, pulper operators, secondary processors, traders, and consumers were identified as key players in the coffee value chain. NTCDB, NARC, CDC, AKC, Coffee Zone, Primary Coffee Cooperatives, Central Coffee Cooperative Union Limited, NCPA, financial institutions, and certification agencies were identified as the enabling environment providers in the value chain. The findings showed that the gross margin of one kg each of fresh cherry production, dry parchment production, green bean production, and coffee powder production was NRs. 26.06, NRs. 92.83, NRs. 107.7, and NRs. 215.06, respectively. Value addition from producers to primary processors was NRs. 109.8 per kg, and the value addition from primary to secondary processors was NRs. 445.6 per kg. Similarly, the value addition from secondary processors to consumers was NRs. 480.58 per kg. The research area’s value chain structure or network was determined to be brief and straightforward. Therefore, it is advised to adopt cutting-edge processing and packaging methods to improve the competitiveness of Nepali coffee in the market.
PUBLIC INTEREST STATEMENT
This study has analyzed how different actors related to value chain analysis interact with each other. Most studies in the past are related to the WSB attack and disease management but this study has assessed the value chain analysis of the coffee subsector by considering functionaries, actors, and enablers associated with the coffee enterprise in Arghakhanchi district of Nepal. Because of the asymmetric market information coupled with no sufficient support, the farmers have little power and trust in the coffee business. This study has explored options for enhancing market access and also analyzed the production system opportunities and problems related to cultivation. This study attempts to analyze profitability at each stage of the value chain in the journey of coffee from cherry to the cup of consumers.
1. Introduction
Coffee, one of the most important and highly traded cash crops, is widely consumed as a beverage around the world. Coffee (Coffea arabica) is a member of the family Rubiaceae popularly known for its pleasant taste, aroma, health benefits, and stimulant effect due to high caffeine content (Aresta et al., Citation2005; Higdon & Frei, Citation2006; Schenker et al., Citation2002). This crop is native to the high humid rainforest of south and southwestern Ethiopia (Mabberley, Citation1997). Coffee is cultivated in about 80 tropical countries, where 125 million people from Latin America, Africa, and Asia depend for their livelihoods on the annual production of nine million tons of coffee beans (Krishnan, Citation2017). In 2020/21, worldwide production of Arabica coffee reached about 102.1 million 60-kilogram bags, with Brazil, Vietnam, Colombia, Indonesia, and Ethiopia being the major producers, which contributed around 75% of global production (Ridder, Citation2022).
Plantation of coffee started in Nepal when Mr Hira Giri, in 1938 A.D., brought coffee seeds from the Sindhu province of Myanmar and planted them in Aapchaur of the Gulmi district of Nepal. Coffee seedlings gradually became popular in the backyards and gardens of most of the neighboring districts of Gulmi, like Palpa, Arghakhanchi, Syangja, and Pyuthan. However, commercial cultivation of coffee started only in the 1990s. Coffee is an export-oriented high-value crop that is mostly cultivated in more than 40 districts in the mid-hills of Nepal. The total area under coffee cultivation is 1887 hectares, and 297 metric tons of green beans were produced with a productivity of 192 kg/ha during 2019–2020 (MoALD. Ministry of Agriculture and Livestock Development, Citation2021). Due to the availability of suitable land topography and climatic conditions, including relative humidity, temperature, and rainfall for arabica coffee, districts like Arghakanchi, Gulmi, Palpa, Syangja, Kaski, Kavre, and Sindhualchowk mark themselves as the top producers of coffee in Nepal (NTCDB. National Tea and Coffee Development Board, Citation2018). Coffee is a high-value commodity with a greater net return per unit that is four times more profitable than maize cultivation and three times more profitable than millet cultivation (Project for Agriculture Commercialization and Trade PACT, Citation2012). Nepal has suitable climatic and soil conditions that facilitate the production of high-quality “specialty coffee” at altitudes ranging from 800 to 1400 m above sea level (Dhakal, Citation2005). So, organic certification of Nepalese coffee can balloon the price in the international market. Nepalese specialty coffee is in high demand around the world due to its organic nature of reduced caffeine content (Tuladhar & Khanal, Citation2020). It can readily compete in the international market and occupy a unique position among the world’s organic coffees.
The previous study conducted by Acharya and Dhakal (Citation2014) in Palpa district, Nepal, focused solely on the production aspect of coffee and reported the total cost of coffee production as NRs 5114.9 per Ropani of land. Similarly, Bhattarai et al. (Citation2020) performed an economic analysis of coffee in Arghakhanchi district, with a primary focus on coffee producers, revealing a gross return of US Dollar 25.28 per Ropani of land. While these studies have provided insights only on coffee production, they have not comprehensively examined the entire value chain, including the various stages and actors involved. Also, pre-field visits and key informant interviews in the study area revealed that farmers have little leverage and trust in the coffee business due to asymmetrical market information and a lack of adequate support. Therefore, a collaborative study was needed to investigate the structure, scale, and operation mechanisms of various chain actors. This paper aims to analyze the gross margin and pricing at each stage in the value chain of coffee, along with the strengths and weaknesses of the existing value chain and the opportunities and threats (SWOT) to its competitiveness. By examining the value chain, the paper intends to identify the different stages involved, from coffee cultivation to the final consumption, and analyze the roles, relationships, and interactions of the various actors within the chain.
2. Research methodology
2.1. Research site
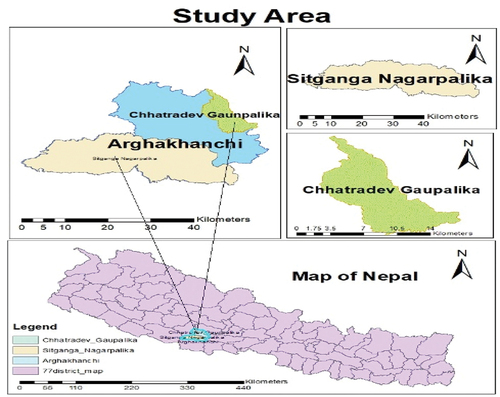
The research will be conducted in the coffee zone of Arghakhanchi. Figure Shows the map of Nepal including the geographical map of Chhatradev rural municipality and Sitganga municipality. The coffee zone of Arghakhanchi is under the jurisdiction of Project Implementation Unit (PIU), Prime Minister Agriculture Modernization Project (PM-AMP), Sandhikharka, and Arghakhanchi. Arghakhanchi district lies in the lower hills of Lumbini province and ranges from 305 to 2515 m above the sea level. Arghakhanchi district is surrounded by Dang and Pyuthan districts in the west, Kapilvastu and Rupandehi in the south, Palpa in the east, and Gulmi in the north. It has an area of 1193 m square, which lies between 27°45’ and 28°6’ north latitudes and 80°45’ and 83°23’ east longitudes (GoN. Government of Nepal, Citation2015). The agroclimate in this region is characterized by a medium type of climate. The average maximum temperature in summer is 40°C, the average minimum temperature in winter is 6.5°C, and the average annual rainfall is 2200 mm. To be specific, the survey was conducted in Sitganga Municipality and Chatradev Rural Municipality.
Figure 1. Map of Arghakhanchi district including study area.
2.2. Sample and sampling techniques
Respondents for the value chain study in coffee include four categories, namely, farmers, collectors, primary processors, and secondary processors. The selection was done as follows:
2.2.1. Selection of farmers
The representative sample was collected by using a three-stage random sampling procedure. In the first stage, Sitganga municipality and Chatttradev rural municipality were purposefully selected as they are the highest coffee-producing local bodies in Arghakhanchi. In the second stage, five coffee-producing villages from each local organization were selected randomly. In the third stage, eleven coffee producers from each village were selected using the snowball method. Due to the lack of an actual list of coffee farmers, snowball sampling is employed, in which research participants assist in recruiting other participants for further study. In this way, one hundred and ten coffee producers were selected using the three-stage sampling method.
2.2.2. Selection of collectors and pulper operators
Collectors buy coffee from the farmer and collect it at the collection center for the purpose of pulping. Pulper operators are the primary processors whose role is to remove the pulp and mucilage from cherries, followed by drying in order to produce dry parchment. Six collectors and pulper operators were purposefully selected for the study.
2.2.3. Selection of secondary processors
The dry parchment formed after pulping is dehulled to make green beans. Green beans formed after dehulling are grounded in order to make coffee powder. In the survey, two secondary processors were selected for interviews. They were selected based on their convenience for the collection of data.
2.3. Data and data types
In this survey, data from both primary and secondary sources were collected.
2.3.1. Primary data
The primary source includes a semi-structure questionnaire to collect primary data from farmers, consumers, pulpers, dehullers and coffee powder producers. Two focus group discussions were carried out in each local body to obtain and validate data and information. Key informant interview was also carried out to get relevant information from different stakeholder in this sub-sector. Information from coffee powder producers is obtained through a telephone interview. Relevant information was collected and findings were arranged systematically to satisfy the goals of the study.
2.3.2. Secondary data
Secondary data were collected from various online open-access journals, reports, books, related websites, articles, and reports related to coffee production. Furthermore, secondary data related to coffee production was obtained from different institutes and organizations like National Tea and Coffee Development Board (NTCDB), Ministry of Agriculture and Livestock Development (MoALD), Food and Agriculture Organization (FAO), Central Bureau of statistics (CBS), Nepal Agriculture Research Council (NARC), etc. Relevant information was collected from available literature and the findings from them were arranged systematically.
2.4. Data analysis techniques
The data collected from the survey schedule from farmers, collectors, dehullers, coffee powder producers, and consumers were coded, assembled, and analyzed with the help of MS excel and Statistical Package for Social Sciences (SPSS). Descriptive statistics such as frequencies and percentages were calculated.
2.4.1. Cost of production
To calculate the cost of production, the variable cost and fixed cost items were taken into account. The total cost of production was calculated by adding all the expenditures on variable inputs and fixed costs.
Total cost = Ʃ Fixed cost + Ʃ Variable cost
2.4.2. Gross margin analysis
Gross margin is also called “gross profit” or “returns over variable costs,” and it is used for the measurement of profitability in coffee production and how efficiently they are using their resources. Gross margin was estimated by subtracting total variable costs from the gross return involved in coffee production.
Mathematical expression for gross margin:
Gross Margin (GM) = Gross Return (GR) − Total Variable Cost (TVC)
where
Gross return (NPR) = Price of coffee (NPR per kg) × Total quantity produced (Kg)
Total variable cost (NPR) = Total cost incurred in all the variable items
2.4.3. Producer’s share
Producer’s share is the price received by the farmer expressed as a percentage of the retail price, i.e., the price paid by the consumers. It can be calculated by the following formula:
where
Ps= Producer’s share
Pf= Producer’s price (Farm gate price)
Pr= Retailer’s price
2.4.4. Marketing margin
Marketing margin can be calculated by subtracting both the net price received by producers and the marketing cost from the retailers’ sale price. Mathematically,
Marketing Margin= Retailers’ sale price − Net price received by Producers − Marketing cost
2.4.5. Indexing
Using an index, production and market-related issues were ranked and prioritized. Based on the severity of the issues, the production and marketing issues in the research regions were recognized and ranked. A five-point scaling technique was used to compare the most serious, serious, moderate, fairly, and least serious problems that the producers and merchants of coffee were experiencing, using scores of 1.00, 0.80, 0.6, 0.4, and 0.2, respectively. The index for the severity of production and marketing issues experienced by producers and dealers, respectively, was determined using the formula provided below.
Mathematical Expression,
where Iimp = Index of importance
∑ = summation
Si = Scale value of ith intensity
fi = Frequency of ith response
N = Total number of respondents
3. Result and discussion
3.1. Coffee cultivation
3.1.1. Area under coffee cultivation
The rural population can be categorized into three groups: Small commercial farmers (19.6–98 Ropani land), Subsistence farmers (9.8–19.6 Ropani land), and Landless or near landless farmers (<4.9 Ropani land) (ADS, Citation2014). Here, large portion of respondents (81%) fall in the category of landless or near landless farmers. Around one-fifth of the respondents in the study area were subsistence coffee farmers with a coffee plantation area of 9.8–19.6 ropani as shown in Table . No farmers in the study area were small commercial farmers due to scattered land, small land holding among farmers, the high initial investment in coffee, and the long gestation period of coffee.
Table 1. Area under coffee cultivation in the study site
3.1.2. Shade tree in coffee orchard
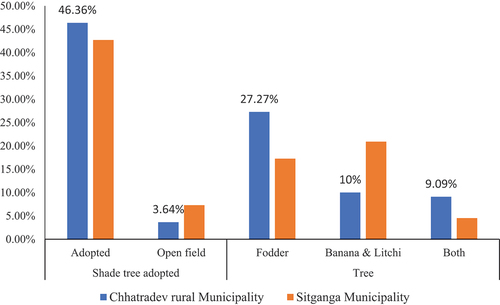
The majority of the respondents (89.06%) had planted shade trees in their coffee orchards in the study area. However, 10.94% of the respondents were found growing coffee an open field without any shade tree. 44.54% of farmer had planted fodder trees (Siris, Badahar, Taki, Faledo, etc.) as shade trees in their coffee orchard, 30.90% or respondents had adopted fruits like bananas and litchi as shade tree in their coffee orchards, and 13.62% of respondents had planted mixed type of shade tree (fruits as well as fodder) in their coffee orchard as shown in Figure . Coffee is a shade-loving plant that is reported to grow well under low canopy level trees, with shade reducing the stress of coffee by reducing the adverse effects of climate and maintaining nutritional balance (Ehrenbergerová et al., Citation2017).
Figure 2. Shade tree in the coffee orchard.
3.1.3. Intercropping in the orchard
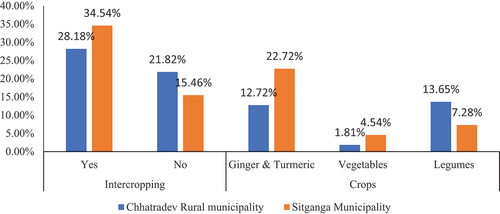
Since the gestation period of coffee is 3–4 years, the farmer can get yield from the coffee orchard during the gestation period by intercropping with vegetables like legumes, ginger, turmeric, etc. This practice diversifies the return, reduces the risk associated with the coffee, and also helps in the management of pests in the coffee crops. More than half of the respondents (56.72%) were found intercropping in the coffee orchard, while 43.28% of the respondents in the study area were found not to be intercropping in the coffee orchard, as shown in Figure . The majority of respondents (35.44%) intercropped coffee with ginger and turmeric in the study area due to their high value in comparison to vegetables (potato, cabbage, and cauliflower) and legumes like peas.
Figure 3. Intercropping in the coffee orchard.
3.1.4. Source of seedling
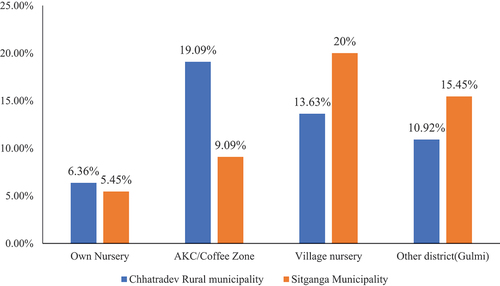
Quality seedlings are needed for the increment in production, uniformity in quality, and uniformity in volume of production, so the source of the seedling is crucial for the establishment of the orchard. Nearly one-third (33.63%) of the respondents in the study area reported that the village nursery was the major source of the coffee seedlings. 28.18% of the respondents established orchards with seedlings from government sources like the AKC or the Coffee Zone, whereas 26.37% of the respondents brought seeds from the Gulmi district, as shown in Figure , and 11.81% of the respondents had their own nurseries for coffee plantations
Figure 4. Source of seedlings for coffee orchard.
3.1.5. Factors encouraging coffee production
The respondents’ ranking of the different types of encouraging factors for coffee production showed that less care or less intensive production was the most encouraging factor, followed by high return, market demand, neighbor influence, and land suitability as shown in Table . A key informant interview with different stakeholders and farmers was also carried out to get relevant information regarding encouraging factors in coffee production in the study area.
Table 2. Factor encouraging coffee production among respondents in the study site
3.1.6. Existing problems in coffee cultivation
Ranking of the different types of the problem faced by the respondents for the production of coffee in the study area revealed that attack of insects (White Stem Borer) is the major problem followed by poor rainfall and irrigation, lack of technical knowledge and extension, lack of quality seedling and lack of organic plant protection means as shown in Table . Existing problems in coffee production in the study area were identified through Key Informant Interview which was carried out with different stakeholders and farmers before carrying out the survey.
Table 3. Problems in coffee production among respondents in the study site
3.2. Post harvest operation
3.2.1. Coffee processing method
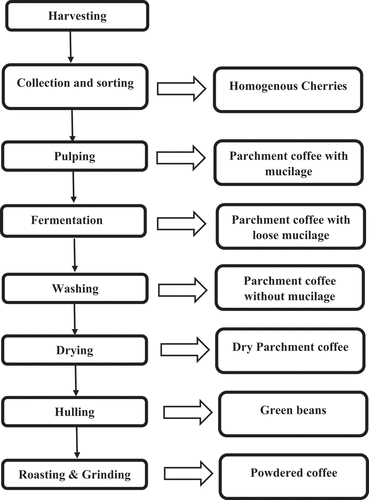
Fresh cherries can be processed by three different methods: the dry method, the semi-wet method, and the wet method. All the pulper operators in the study area were found to pulp coffee cherries by the wet method. Processors prefer the wet method in comparison to others due to its ease and lower labor intensity than other methods. Wet processing is found to be superior to others due to its pleasant aroma and pure flavor (Subedi, Citation2010). Different stages in the wet method of coffee processing are shown in Figure .
Figure 5. Wet processing method of coffee.
3.2.2. Value chain of coffee
The entire process of moving coffee beans from the field to the end customer’s cup is included in the value chain. Value chain analysis requires the mapping of the value chains as well as the identification of the institutions and individuals who create an enabling environment. Along with suggesting potential interventions to move the value chain, it also identifies the opportunities and constraints at each stage.
3.2.3. Value chain map
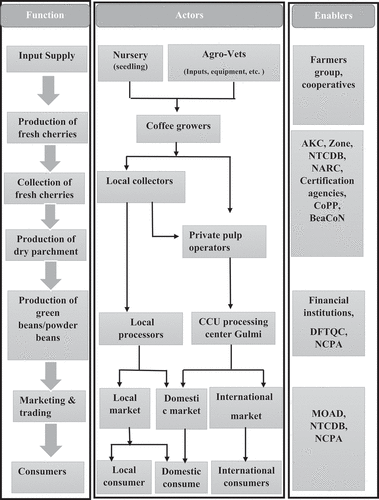
Figure shows the value chain map of arabica coffee in the Arghakhanchi district of Nepal, which shows the relationship among the actors, their functions, and the institutions that create an enabling environment.
Figure 6. Value chain map of arabica coffee in Arghakhanchi district of Nepal
3.2.4. Actors and major function
Input suppliers: Nursery and local agrovet were found major suppliers to the coffee farmers. Seedlings were supplied by the nursery and other biopesticides, manure and other equipment like mask, sprayers etc. Chemical fertilizers are not used by the coffee farmer in their orchard to produce organic specialty coffee.
Producers: Coffee growers were considered as the producers. They were found producing fresh cherry and send fresh cherry to pulper within 24 hours for pulping. Two kinds of producers were identified in the study area namely, subsistence farmers and landless or near landless farmers.
Collectors: They were those individuals which were involved in the collection of fresh cherry from farmers and supplies to pulper operators. They were the linkage between farmers and primary processors.
Pulper operator: They collect fresh cherries either from collectors or from farmers and peel off them. The pulping of the freshly harvested cherries by pulper operator convert to parchment coffee which is then fermented, washed and dried in sunlight to form dry parchment.
Secondary processors: They were found collecting dry parchment from pulper operators. They further process dry parchment by hulling to make green beans. Roasted beans were formed from green beans by roasting it. Fine powdered coffee is prepared from roasted beans by grinding them in the grinder machine.
Traders: Three type of traders were found involving in the trading of coffee, namely, local traders, domestic traders and international traders (exporters). Local traders sell coffee powder in local market, domestic traders sell green beans and coffee powder in domestic market and exporters sell green beans to international market.
3.2.5. Enablers and facilitators
3.2.5.1. Government organization
These organizations are responsible for overseeing Nepal’s coffee value chain including those responsible for creating a supportive climate for the country’s coffee industries, varietal development, procurement and evaluation of genotype, technology transfer, quality control, and conducting research related to shade management and disease management. Some of the government organization working in coffee subsector were identified during the study, which are listed below:
Ministry of Agriculture and Livestock Development (MoALD)
National Tea and Coffee Development Board (NTCDB)
Nepal Agriculture Research Council (NARC)
Department of Food Technology and Quality Control (DFTQC)
Coffee Development Centre (CDC)
Agriculture Knowledge Centre (AKC)
Coffee Zone
3.2.5.2. Non-governmental organization
These organizations are responsible for promoting Nepal’s coffee value chain by providing financial support to establish coffee processing centers, technical support to farmers, collection, processing, and even the export of Nepalese specialty coffee to foreign markets. They advocate for policies and practices that support coffee growers, such as fair prices, access to credit and technology, and protection of land rights. They can also raise awareness among consumers about the challenges faced by coffee growers and the importance of supporting sustainable and ethical coffee production. Some of the non-government organization working in coffee subsector were identified during study, which are listed below:
Primary Coffee Cooperatives (PCC)
Central Coffee Cooperative Union Limited (CCCUL)
National Coffee Producers Association (NCPA)
Coffee Promotion Program (CoPP)
Beautiful Coffee Nepal (BeaCoN)
3.3. Financial analysis
3.3.1. Cost of production
Cost of production was calculated by compiling variable cost and fixed cost. Here, we had calculated cost of production through the personal interview with the farmers, pulpers, primary processors and secondary processors of the study area.
3.3.1.1. Cost of production of fresh cherry
Cost of production of fresh cherry per year was calculated by compiling variable cost and fixed cost. Here, we had calculated cost of production of fresh cherry of one year through the personal interview with the farmers of the study areas shown in the Table . The cost incurred per hectare of coffee production had been analyzed and was found to be around NRs. 190,028 for one year. Similarly, we had also analyzed the cost required to make one kilogram of fresh cherry and was found to be NRs. 72.89 as shown in Table . Through a production cost analysis, it is imperative to find strategies to cut the cost of harvesting of coffee beans so that the farmers can enjoy maximum profit.
Table 4. Cost of production per kg. fresh cherry in the study area, 2022
3.3.1.2. Cost of dry parchment production
Cost of production of dry parchment was calculated by compiling variable cost and fixed cost. Total variable cost and total fixed cost incurred to produce one kilogram dry parchment was NRs. 397.17 and NRs. 10.8 respectively as shown in the Table . Through the personal interview with the pulper operator of the study area, the total cost incurred during dry parchment production was estimated as NRs. 407.97 per kg. Dry parchment producer can reap maximum profit from their produce if they shift their dependence on manual labor for washing and shorting coffee beans to advanced modern machines.
Table 5. Cost of production per kg. dry parchment in the study area, 2022
3.3.1.3. Cost of green bean production
Cost of production of green bean was calculated by compiling variable cost and fixed cost. Total variable cost and total fixed cost incurred to produce one kilogram green beans was NRs. 819.3 and NRs. 17.28 respectively as shown in the Table . Through the personal interview with the secondary processor of the study area, the total cost incurred during green bean production was estimated as NRs. 836.58 per kg. Processors can discover areas where efficiency can be improved by studying the many steps involved in the processing and distribution of coffee. They can save costs and increase profitability, for instance, by streamlining their distribution networks or enhancing the efficiency of their production methods.
Table 6. Cost of production per kg. green beans in the study area, 2022
3.3.1.4. Cost of coffee powder production
Cost of production of coffee powder was calculated by compiling variable cost and fixed cost. Total variable cost and total fixed cost incurred to produce one kilogram coffee powder was NRs. 1,534.94 and NRs. 23.78 respectively as shown in the Table . Through the personal interview with the secondary processor of the study area, the total cost incurred during coffee powder production was estimated as NRs. 1,558.73 per kg.
Table 7. Cost of production per kg. coffee powder in the study area, 2022
3.3.2. Gross margin analysis
The gross margin was calculated by deducting the average variable cost from average gross return in order to evaluate the profitability of coffee producers, pulper operators, green bean producers, and coffee powder producers. The gross margin of one kg fresh cherry production, one kg dry parchment production, one kg green bean production, and one kg of coffee powder production was NRs. 26.06, NRs. 92.83, NRs. 107.7, and NRs. 215.06, respectively, as presented in Table . The gross margin of our study is found consistent with the findings of study by Luitel (Citation2017). An analysis of gross margin reveals important information about the viability and sustainability of the coffee value chain. Stakeholders can ensure that the value chain is profitable and sustainable in the long run by deciding where to focus their resources and investments and by having a clear understanding of the costs and revenues connected with each stage.
Table 8. Gross margin analysis of fresh cherry production, 2022
3.3.3. Value addition in different levels of value chain
Value addition in the different levels of value chain was calculated on the basis of Green Bean Equivalent price at the different levels. At every stage of processing, coffee is transformed into a distinct product. In order to bring uniformity to the various products, Green Bean Equivalent (GBE) was utilized to calculate the cost, return, and value addition at each stage of value chain (FNCCI/AEC, Citation2006; ITC International Trade Centre, Citation2011). These are the conversion factors that were employed. Firstly, average price at each level was converted to Green Bean Equivalent price by multiplying with GBE conversion factor as presented in Table . It was reported that value addition from producers to primary processors was NRs. 109.8 per kg and from primary processors to secondary processors was found to be NRs. 445.6 per kg. Similarly, value addition from secondary processors to consumers was found to be NRs. 480.58 per kg. The findings showed that the value addition of the coffee was highest from green beans to coffee powder (NRs/kg 480.58) and was lowest from fresh cherry to dry parchment (NRs/kg 109.8) as shown in the Table . The value addition at different levels of coffee value chain of our study is found in consistent with the findings of study by Luitel (Citation2017). By scrutinizing value addition at the different stages of value chain, it is possible to identify the potential areas where cost can be reduced and profit can be maximized.
Table 9. Value addition in different levels of value chain, 2022
3.4. Marketing of coffee
The majority of respondents (94.5%) sold their produce in their district, Arghakhanchi; however, very few of them (5.4%) sold their produce to another district for a better price and proximity to Gulmi. All of the respondents sold their produce from their homes. The majority of respondents (59.1%) reported that their produce was collected by the pulper operator, while 40.9% of respondents reported that coffee produced by them was collected by a local collector, as shown in Table .
Table 10. Marketing of coffee in the study site, 2022
All of the respondents made an oral agreement with the trader for the purpose of selling their produce. In the case of payment mechanisms, slightly more than half of the respondents (52.7%) reported that they received payment within a month of the sale of their produce, while no one had received advance payment from a trader for the sale of their produce. 31.8% of farmers reported that they receive payment at the time of sale, and the remaining 15.5% of respondents reported that they get payment after one month of selling their produce, as shown in Table .
3.4.1. Existing problems in the marketing of coffee among growers
Ranking of the different problems faced by the grower related to the marketing of coffee showed that low farmgate price was the major problem followed by poor transportation and connectivity, lack of processing facilities, lack of marketing knowledge and Lack of storage facilities as shown in Table .
Table 11. Problems in the marketing of coffee among growers in the study area, 2022
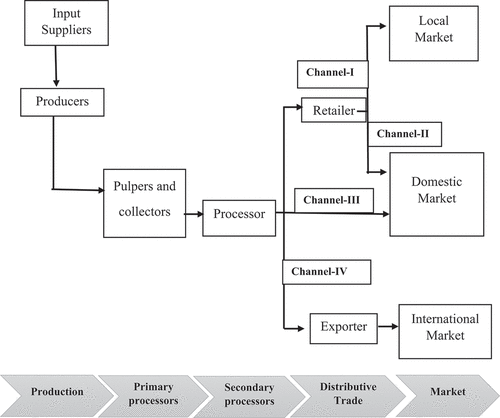
3.4.2. Marketing channels
There are various ways of transaction regarding coffee value addition as well as marketing. From input suppliers to final consumers there are various stakeholders in marketing chain. After assemblage from producers, pulp reaches to processors. After processing, marketing way carve up into two ways, namely;,retailers and exporters. Retailers sell their product in two types of markets, namely, domestic markets (12%) and local markets (3%). About 27% of the product is directly sold in domestic market from processors and 58% of total produce is supplied to the international market by exporters.
Different marketing channels were observed in the study area. The marketing channel identified in the study area is shown in figure below.
Figure 7. Marketing channel of coffee value chain in study area.
3.4.3. Marketing margin and producers’ share of coffee
Estimating the producer’s share is a crucial indicator for assessing the price received by farmers or producers in relation to what consumers pay when purchasing a product. Table indicates the percentage share of the farm gate price that the producer receives. In channel I, the producer’s share is 47.01%. In channel II, it is 26.52%. In channel III, it is also 26.52%. Finally, in channel IV, it is 9.5%. Furthermore, this table also shows the total margin earned at each marketing channel. Channel IV has highest marketing margin NRs 4136.8 per kilogram while channel I has lowest total marketing margin is NRs 490 per kilogram.
Table 12. Estimation of producer share’s in different identified marketing channels in the study area
In Table , Channel I has the highest producer’s share at 47.01%, while the other channels have lower shares ranging from 26.52% to 9.5%. Although Channel IV has the highest total marketing margin, the producer’s share is significantly lower, which means producers earn less from each kilogram sold. Therefore, Channel I appears to be the best option for producers as it offers a higher share of the farm gate price compared to the other channels.
3.5. SWOT analysis
SWOT analysis is a tool to evaluate the competitive position and strategic plan of any enterprise. It is designed to facilitate a realistic and fact based look at the weaknesses and strengths of an organization. Strength refers to internal factors of an organization that makes it more competitive than others. Weakness level refers to the point at which a company can’t perform at optimum level. Opportunities are favourable external factors that provide an organization competitive advantage. Similarly, threats are external factors that have potential to harmper productivity of an organization.
The SWOT analysis of coffee business is presented hereby in table after thorough evaluation among farm owners.
3.5.1. SWOT analysis at input suppliers level
3.5.2. SWOT analysis at producer’s level
3.5.3. SWOT analysis at primary processor’s level
3.5.4. SWOT analysis at secondary processor’s level
3.5.5. SWOT analysis at consumer’s level
4. Conclusion
Input suppliers- supplying seedling and other inputs; producers- producing fresh cherry, collectors- collecting fresh cherry from farmers and suppling to pulper operators; pulper operator- producing dry parchment coffee; secondary processors- producing green beans & fine powdered coffee and traders- delivering to consumers were identified as key players involved in the coffee value chain. Gross margin of one kg each of fresh cherry, dry parchment, green bean and coffee powder production was NRs. 26.06, NRs. 92.83, NRs. 107.7, and NRs. 215.06, respectively. Value addition from producers to primary processors was NRs. 109.8 per kg and from primary processors to secondary processors was NRs. 445.6 per kg. Similarly, value addition from secondary processors to consumers was NRs. 480.58 per kg. The findings showed that the value addition of the coffee was highest from green beans to coffee powder (NRs/kg 480.58) and was lowest from fresh cherry to dry parchment (NRs/kg 109.8). All things considered, a value chain assessment is a crucial for coffee producers and firms to pinpoint areas for improvement and raise their level of competitiveness in the national as well as international market. Processors can find chances for cost reduction, value addition, efficiency improvement, and sustainability enhancement by carefully reviewing each stage of the value chain. This will ultimately result in higher profitability and a more sustainable business model.

Acknowledgments
The authors owe their sincere and deep gratitude to coffee farmers of Arghakhanchi district for their support throughout this research. Special thanks to our parents whose guidance is always with us.
Disclosure statement
No potential conflict of interest was reported by the author(s).
Additional information
Funding
Notes on contributors

Sushil Khatri
Sushil Khatri is an agriculture graduate from Agriculture and Forestry University. He is a young researcher and youth activist. His area of interest includes pest management, sustainable agriculture, applied economics, and statistics. He had worked as the Control Board Head of International Association of Students in Agriculture and Related Sciences (IAAS) Nepal in 2021-2022. He worked as research intern in Prime Minister Agriculture Modernization Project-Project Implementation Unit (PMAMP-PIU), Arghakhanchi, Nepal.
References
- Acharya, B., & Dhakal, S. C. (2014). Profitability and major problems of coffee production in Palpa district, Nepal. International Journal of Applied Sciences and Biotechnology, 2(4), 460–24. https://doi.org/10.3126/ijasbt.v2i4.11252
- ADS. (2014). Agriculture Development Strategy (2015-2035). Ministry of Agriculture Development (MoAD), Government of Nepal.
- Aresta, A., Palmisano, F., & Zambonin, C. G. (2005). Simultaneous determination of caffeine, theobromine, theophylline, paraxanthine and nicotine in human milk by liquid chromatography with diode array UV detection. Food Chemistry, 93(1), 177–181. https://doi.org/10.1016/j.foodchem.2004.11.013
- Bhattarai, C., Bhusal, K., Bhandari, D., Gautam, A., Bhandari, S., & Bhujel, S. (2020). Economic analysis of coffee production in Arghakhanchi and Gulmi districts of Nepal. Food Agribus Manage, 1(1), 39–42. https://doi.org/10.26480/fabm.01.2020.39.42
- Dhakal, B. R. (2005). Coffee Manual. National Tea and Coffee Development Board (NTCDB), New Baneshwor, Kathmandu.
- Ehrenbergerová, L., Šenfeldr, M., & Habrová, H. (2017). Impact of tree shading on the microclimate of a coffee plantation: A case study from the Peruvian Amazon. Bois & Forets Des Tropiques, 334, 13–22. https://doi.org/10.19182/bft2017.334.a31488
- FNCCI/AEC. (2006). The study report on trade competitiveness of Nepalese coffee. Federation of Nepalese Chamber of Commerce and Industries, Agro-Enterprise Center. Available: http://www.aec-fncci.org/wp-content/uploads/2015/01/Trade-competitiveness-study-Report-Coffee-Full.pdf).
- GoN. Government of Nepal. (2015). District profile, Arghakhanchi-2072. Government of Nepal, National Planning Commission, Central Bureau of Statistics, Statistic office. Province-5.
- Higdon, J. V., & Frei, B. (2006). Coffee and health: A review of recent human research. Critical Reviews in Food Science and Nutrition, 46(2), 101–123. https://doi.org/10.1080/10408390500400009
- ITC (International Trade Centre). (2011). The coffee exporter’s guide. 3rd Ed. International Trade Centre, 54-56, rue de Montbrillant, 1202. pp. 4 Available: http://www.thecoffeeguide.org/coffee-guide/world-coffeetrade/conversions-and-statistics/
- Krishnan, S. (2017, June 28). Sustainable coffee production. Oxford Research Encyclopedia of Environmental Science. https://doi.org/10.1093/acrefore/9780199389414.013.224
- Luitel, G. (2017). Value chain analysis of coffee production in Central Nepal. MSc Thesis. Tribhuvan University, Institute of Agriculture and Animal Science postgraduate college, Kirtipur, Kathmandu, Nepal. https://www.researchgate.net/publication/321161193_VALUE_CHAIN_ANALYSIS_OF_COFFEE_PRODUCTION_IN_CENTRAL_NEPAL
- Mabberley, D. J. (1997). The plant-book: A portable dictionary of the vascular plants. Cambridge University Press.
- MoALD. Ministry of Agriculture and Livestock Development. (2021). Statistical information on Nepalese Agriculture 2019/20. Ministry of Agriculture, Land Management and Cooperatives.
- NTCDB. National Tea and Coffee Development Board. (2018). Analysis of habitat suitability of coffee (coffea Arabica) in Nepal. Government of Nepal.
- Project for Agriculture Commercialization and Trade (PACT). (2012). Value chain Development Plan for organic coffee. Government of Nepal, Ministry of Agricultural Development, Project for Agriculture Commercialization and Trade (PACT).
- Ridder, M. (2022, January 13). Statista. Retrieved from world arabica coffee production from 2005/06 to 2021/22(in 1,000 60 kilogram bags): https://www.statista.com/statistics/225400/world-arabica-coffee-production/
- Schenker, S., Heinemann, C., Huber, M., Pompizzi, R., Perren, R., & Escher, R. (2002). Impact of roasting conditions on the formation of aroma compounds in coffee beans. Journal of Food Science, 67(1), 60–66. https://doi.org/10.1111/j.1365-2621.2002.tb11359.x
- Subedi, R. N. (2010). Comparative analysis of Dry and Wet Processing of Coffee With Respect to Quality in Kavre District, Nepal. [ Master’s Thesis], Wageningen University. 43–51.
- Tuladhar, A., & Khanal, D. R. (2020). Coffee production in Nepal – a brief review. Acta Horticulturae, 1274(1274), 161–166. https://doi.org/10.17660/ActaHortic.2020.1274.21