
 ?Mathematical formulae have been encoded as MathML and are displayed in this HTML version using MathJax in order to improve their display. Uncheck the box to turn MathJax off. This feature requires Javascript. Click on a formula to zoom.
Abstract
This study examined the impact of the adoption of Korra tef (Eragrostis tef) on farm households’ welfare in Ethiopia. It was conducted with 479 farmers during the 2020 cropping season. 221 of them were Korra adopters and the remaining were non-adopters who adopted other alternative tef varieties like Boset, Dagim, Dursi, Flagot, Warekiyu, Hiber and Tesfa. Qualitative data were also collected from the pertinent key informants. The amount of tef production per hectare was used to measure household productivity, and a Household Commercialization Index (HCI) was used to determine the level of their commercialization. Welfare was proxied by measuring consumption per adult equivalent. One-way Analysis of Variance (ANOVA) was employed to investigate farmers’ spending at various levels of commercialization. The Propensity Score Matching (PSM) method was used to investigate how the Korra tef impacted adopters’ welfare in comparison to non-adopters. A strong correlation was found between the adopters’ spending and commercialization. The adoption of the Korra tef showed a positive and significant impact on the expenditures of the adopters. Therefore, it is important to strengthen the value chain of tef in addition to promoting access to Korra tef. Governmental and non-governmental organizations should provide farmers with market-focused extension services, to enable them to increase crop productivity and engage in the market, thereby enhancing their welfare.
PUBLIC INTEREST STATEMENT
Tef (Eragrostis tef) is a staple food in Ethiopia, commonly used to prepare `Enjera`, the main public dish. It is one of the newest super-foods of the 21st century, like the ancient Andean grain quinoa. Its global adoption is rapidly increasing, and it is now riding the gluten-free wave as the next super grain on the market. It is expected to become a new super crop, increasing global demand. However, it’s widely acknowledged that the lack of adoption of the high-yielding tef variety is one of the major reasons for the slow progress of its commercialization and welfare. With this, an investment on its improved variety has been underway to improve its productivity, expand its market, and enhance its role on producers’ welfare. As a result, the purpose of this study is to investigate the welfare impact of the new tef variety, Korra, producer smallholder farmers.
1. Introduction
World agriculture will need to go through significant changes in the upcoming decades to fulfill the future food needs of a growing, increasingly wealthy, and urbanized population (Fan & Rue, Citation2020). In light of this, smallholder farmers are expected to play a significant role since they make up a sizeable portion of farmers worldwide, and continue to be a major source of food and income for the world’s rural population in general, and the developing world in particular (Wolfenson, Citation2013). The study conducted by the Food and Agriculture Organization (FAO) of the United Nations indicates that 70–80% of the world’s food is being produced by smallholder farmers who own less than two hectares of farmland and whose farm activities are primarily managed by family labor (FAO, Citation2014). These farmers make up more than 60% of the population in sub-Saharan Africa, and they generate around 23% of the region’s Gross Domestic Product (GDP) (Goedde et al., Citation2019). Likewise, smallholder farming systems make up the majority of Ethiopia’s agricultural sector (Diriba, Citation2020); smallholder farmers produce around 95% of the country’s food crops, including cereals, pulses, oilseeds, vegetables, root crops, fruits, and cash crops (Gelaw, Citation2017). About 77.3% of the working force in the country still relies primarily on the crop subsector for their means of subsistence, and the crop subsector has been the major contributor to the overall growth of the agricultural sector (Wondimagegnhu et al., Citation2019). Considering these, smallholder farmers have been a focus of agricultural development programs by the Ethiopian government, development partners, and those in the private sector, partly due to increased pressure on farmlands and low agricultural productivity (Diriba, Citation2018).
Massive pressure on agricultural land and the resulting low agricultural productivity highlighted the importance of using agricultural technologies (Kamara et al., Citation2019). In line with this, Ethiopia’s rapidly shrinking farm sizes and low agricultural productivity have led to the assumption that encouraging the adoption of agricultural technology is one way to enhance smallholder farmers’ capacity to meet food demand, reduce poverty, and improve the welfare of adopters through higher crop yields that result in higher consumption (Diriba, Citation2020; Feyisa & Yildiz, Citation2020; Zeng et al., Citation2017; Zerssa et al., Citation2021). For instance, the government has prioritized accelerated growth in agricultural production with a gradual shift towards high-value crops to improve people’s well-being and reduce poverty (Mellor & Dorosh, Citation2010). As a result, the government and development partners have been working together to improve the welfare of farm households. The Agricultural Growth Program phase two (AGP II), is one of these collaborative initiatives. AGP II is meant to support agricultural productivity and commercialization thereby contributing to the higher-level goal of food security by utilizing the untapped potential of well-endowed areas (MoA, Citation2015a). The program’s primary development goal is to increase the dietary diversity and consumption of the targeted smallholder farmers at the household level (MoA, Citation2015b). Given that both food consumption and non-food consumption are seen as crucial elements of household welfare, this target is closely tied to welfare (Deaton, Citation2005; Hentschel & Lanjouw, Citation2000). Therefore, it could be argued that improving the welfare of the program’s beneficiary farm households is its very last goal. The program relies on the use of various agricultural technologies in the settings in which it intervenes. For instance, in the Wara-Jarso Footnote1woreda, where there is a significant potential for crop production, it has introduced the genetically modified and high-yielding Footnote2tef variety, Korra.
Despite the introduction of a new variety of tef, its impacts were not thoroughly studied. The majority of impact studies focused on [staple] crops like maize (Zea mays), wheat (Triticum Aestivum), and horticulture crops (Aman et al., Citation2014; Amsalu, Citation2014; Edosa, Citation2018; Endalew et al., Citation2020; Getahun et al., Citation2019; Negussie, Citation2020; Tesfaye et al., Citation2016; Wordofa et al., Citation2021). These studies looked at how the aforementioned crops’ improved cultivation methods affected smallholders’ livelihoods. Besides, these studies revealed that the productivity, income, and commercialization of smallholder farmers were shown to be significantly and positively impacted by improved seeds. Other studies (Asfaw et al., Citation2012; Biru et al., Citation2020; Endalkachew et al., Citation2014; Teka & Lee, Citation2020) have focused on the impacts of agricultural development programs and contemporary agricultural technologies on rural people’s welfare, vulnerability, and poverty. Others focused on the welfare impact of improved food legume technologies (Degefu, Citation2016), the effects of nutrition-sensitive agriculture on the welfare of rural people (Shenggen et al., Citation2019), the effects of linking small-scale farmers to the wheat value chain on production and wellbeing (Biggeri et al., Citation2018), the impacts of cash crop production, and Moringa market participation on household welfare (Beyene, Citation2008; Garbero & Songsermsawas, Citation2018; Mezgebo et al., Citation2014; Natnael, Citation2019; Ruder, Citation2018; Weldemeskel et al., Citation2020). Few studies (Beyene, Citation2008; Gezahegn et al., Citation2019; Natnael, Citation2019; Samuel & Kay, Citation2008) have examined the impacts of improved tef seed varieties on farmers’ production, income, and livelihood. The effectiveness of two improved tef varieties (Tseday and Boset) has also been studied (Kebede et al., Citation2017). Even the previous studies on tef ‘s improved varieties hardly ever examine the Korra variety, and when it comes to varieties other than Korra (such as the Tseday and Boset tef varieties), it hasn’t even gone as far as estimating how those impacts will affect farmers productivity, income, and commercialization. Therefore, the purpose of this study is to investigate how adopting the Korra tef variety has impacted the welfare of adopter farm households in Wara-Jarso woreda, North-Western Ethiopia.
This study is expected to contribute by providing a micro perspective on the impacts of Korra tef [as one form of agricultural technology] on the welfare of smallholder farmers, with a focus on the area that predominately grows tef. It will specifically contribute to the literature in three ways: It will first contribute to the body of empirical research on the impact of Korra tef on farm household welfare. Second, the majority of earlier studies solely examined consumption to determine how improved seed varieties affected welfare. Before estimating the impact through consumption expenditures, this study examined the farm households’ productivity, income, and level of commercialization. It also examined the correlation between these levels of commercialization and consumption expenditures. This makes our analysis more thorough. Third, to the researchers’ knowledge, this study is the first to make use of comprehensive lists of farm households’ consumption. The best welfare measures will be developed as a result of these methods. The study is especially significant for a country like Ethiopia since the crop production accounted about 23.8% of the country’s GDP (Mellor & Dorosh, Citation2010). The study will also contribute to our understanding of the dynamics of smallholder farmers’ welfare. In doing so, it can also help in providing feedback for agricultural development initiatives like AGP II. More generally, given that tef accounts for the largest area cultivated under all cereals, accounting for 29.5% of the total cultivated area and 19.7% of total cereal production (Diriba, Citation2020), the results of this study can help by providing useful information for setting priorities for redesigning existing agricultural development programs as well as for the development of agricultural policies and programs aimed at enhancing household welfare.
1.1. Conceptual framework
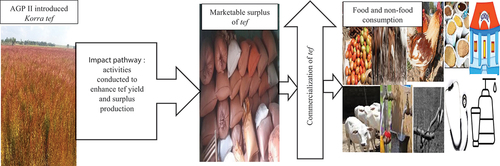
The conceptual framework shown in Figure is based on the relevant literature on the impact of the adoption of improved crop seeds on-farm households’ welfare and the researchers’ understanding of the same in the study area. The characteristics of farm households that are presented on the left side were chosen as the variables that were reasonably common among the comparison groups. The Korra tef was allegedly introduced by AGP II to increase output and commercialization. According to studies (Abate et al., Citation2018; Natnael, Citation2019; Tesfaye et al., Citation2016), the adoption of crop technologies has increased the productivity and income of smallholder farmers. Additionally, there is a positive correlation between crop technology adoption and farm households’ crop commercialization (Afework & Endrias, Citation2016; Assefa, Citation2022). Commercialization of smallholders is believed to increase household members’ food consumption, which may enhance their dietary and health status (Ogutu et al., Citation2020). In general, increasing smallholder production and commercialization is considered to be ways to increase household consumption as measured by numerous factors like household income, food, nutrition status, health, and so forth (Osmani et al., Citation2014). The adoption of agricultural technology, agricultural productivity, and commercialization, on the other hand, are related (Adejobi & Akinola, Citation2013; Asfaw et al., Citation2012; Krause et al., Citation2019).
Figure 1. Conceptual framework on Korra tef adoption and farm households’ welfare.
2. Research methodology
2.1. Description of the study area
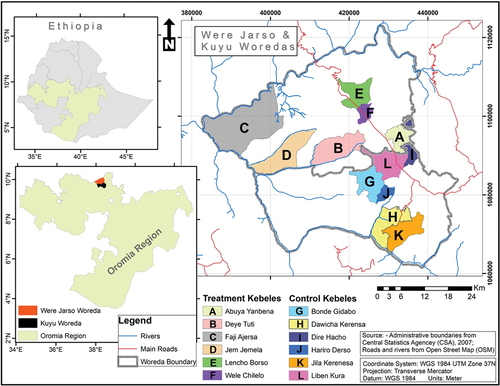
This study is conducted in the North-Western part of Ethiopia specifically in Wara-Jarso woreda located in the North Shewa zone of the Oromia regional state. Geographically, the woreda is located between 38° 14’ 60.00“East longitude and 9° 49’ 59.99” North latitude (Figure ). There are three main agro-ecologies in the region: highland (7.3%), temperate (43.4%), and lowland (49.5%) (National Meteorological Agency of Ethiopia [NMAE], Citation2020). Farmers in the area engaged in mixed farming activities. The main cereal crops farmed in the woreda are tef, wheat, maize, and sorghum (Sorghum bicolor); the study area and the area adjacent are primarily recognized for their tef production. All of the agro-climatic zones in the area are where tef is grown.
Figure 2. Map of the study areas.
2.2. Research design and ethical procedures
The study used a mixed research approach and a cross-sectional survey design. Both the explanatory and descriptive purposes were taken into consideration. The Concurrent Embedded Strategy, one of the mixed methods, was employed, using the quantitative data as a guide and the qualitative data embedded into the latter to support its interpretation (Creswell & Creswell, Citation2017). Quantitative data analysis was done using the STATA version 16 software package. Below is an explanation of the specifications for the descriptive and econometric models used in the analysis. To meet the ethical demands for scientific research, the Center for Rural Development Studies at Addis Ababa University gave ethical approval and clearance. On the basis of this, the general purpose of the study, the freedom to decide whether or not to participate in it without enduring any repercussions or adverse effects, the duration of the study, and the right to discontinue at any time were all carefully laid out for the study participants so that they could feel free to decide whether or not to take part. They were also informed that any information they gave would be kept in the strictest confidence, that data would only be published in aggregate, and that responses would not be associated with particular participants. The study was started after providing the aforementioned explanations and getting the participants’ verbal and written consents for the interviews and survey, respectively.
2.3. Sampling procedures and data sources
The target population for this study was the Wara-Jarso woreda‘s Korra tef growers during the 2020 cropping season. To select a study woreda, Footnote3kebeles, and sample households, a multi-stage sampling technique (i.e. a three-stage sampling procedure) was used. Two woredas, Wara-Jarso and Kuyu, were purposefully chosen for the initial stage. Based on its adoption of the Korra tef variety introduced by AGP II, the Wara-Jarso district was designated as the treatment woreda. Due to the absence of AGP II interventions, the absence of Korra tef variety, and its similarities to the treatment woreda, Kuyu woreda was designated as the control group. Thus, the latter was used to compare the results of farm households in the treated group and estimate the counterfactual from a sample of eligible non-participants. The woredas were divided into major agro-ecological zones for ensuring sample representativeness. Two kebeles were chosen from each major agro-ecological zone by grouping the kebeles located in each agro-ecological zone as high and medium tef producers (i.e. Korra tef in the treatment kebeles whereas non-Korra tef in the control kebeles). Thus, twelve kebeles, six from the treatment group and the other six from the control group were taken into consideration for the study. The sample size was finally determined using (Yamane, Citation1967) sample size calculation formula at the acceptable level of precision of 95% due to the finite size of the population under study.
479 farm households in total were selected. To use an impact assessment model and establish a balance between the two groups, 221 farm households were selected from the treatment group and the other 258 households were selected from the control group. A systematic sampling technique was used to choose samples from the sampling frames of both woredas. As shown in Table , the sample sizes for each kebele were calculated using the Probability Proportional to Size (PPS) technique.
Table 1. Distribution of population and sample households across the study kebeles
The survey data were collected in September and October, 2020 using a structured questionnaire administered by trained enumerators. The questionnaire was initially developed in English, translated into Afan Oromo, and interviewed by the latter. The questionnaire was pre-tested, and a pilot study was carried out, to ensure the validity of the data collection instrument and the dependability of the data gathered. One DA from each agro-ecology zone, six Korra tef producer farmers (two farmers from each agro-ecology labeled as high and medium producers), and the study woreda‘s AGP II coordinator, zonal AGP II facilitator, and regional AGP II monitoring and evaluation officer were on the other hand considered as KIIs for the qualitative data. Using interview guides, the study’s lead investigator conducted the interviews with the Key Informant Interviews (KIIs) over the same time with the quantitative data. In addition, for secondary data, documents from the AGP II coordination office of the study woreda, pertinent journal publications, and websites were reviewed.
2.4. Tools and techniques of data analysis
2.4.1. Measuring household welfare
The potential levels of material living standards are often measured in terms of income and wealth, while actual levels are measured in terms of consumption or spending during a particular time (OECD, Citation2013) (Berik, Citation2018). also considers consumption as a better measure of welfare as it is easier to understand it conceptually, less sensitive, and more accurate measurement. As to these studies since the collection of data on households’ assets and liabilities is difficult for reasons such as greater sensitivity, as well as differences in accounting periods and reporting units, consumption expenditure is relatively more stable over time. This is consistent with the (Grootaert, Citation1986) suggestion that an expenditure dataset of sample households is considered an adequate measure of household welfare [particularly in developing countries] as it is better able to capture a household’s consumption capabilities. More importantly (Dercon et al., Citation2009), argued for the reliability of consumption expenditure since it is less prone to measurement errors and seasonal fluctuations. For (Atkinson, Citation1992), the data for consumption expenditure reflects a household’s decision on nutrition and health. Building on these rationales, this study considers farm households’ consumption as a proxy indicator of their welfare. Thus, the consumption expenditure adjusted by the number of adult equivalents was used as a measure for the same.
However, measuring consumption is a difficult task, because to obtain a good measure of welfare, consumption should be comprehensive including food consumption, non-food items, housing expenditures, and consumer durables (Deaton, Citation2005). Hence, to capture as much consumption as possible and come to know the approximate welfare effects of adopting Korra tef variety, data on consumptions were considered in detail as presented under the two broad categories of food and non-food consumption (see Table ). The consumption expenditure data obtained were for the preceding 12 months upon the data collection. The welfare of farm households in Ethiopia and overseas has previously been measured by prior studies using their consumption expenditures, including (Ahmed & Mesfin, Citation2017; Awotide et al., Citation2016; Gebreselassie & Sharp, Citation2007; Mossie et al., Citation2021; Osmani et al., Citation2014).
Table 2. Consumption expenditures considered for calculating household welfare
Studies have shown that the welfare of smallholder farmers is significantly impacted by commercialization (Amsalu, Citation2014; Camara, Citation2017; Krause et al., Citation2019; Weldemeskel et al., Citation2020). Additionally, it is stated that commercialization is assumed to increase household members’ food consumption through the income-food-consumption linkage (Awotide et al., Citation2016). The Household Commercialization Index (HCI) was used to first determine the degree of commercialization of the farm households under study. The index measures the proportion of the total value of agricultural produce that is attributable to sales. The formula for the Index, which was taken from (Von Braun, Citation1995), is mathematically represented as:
Where HCI is the percentage representing the ratio of the total value of sales to the total value of tef production. Household Commercialization Index has a value that ranges from 0 to 100, inclusive. A value closer to zero and one hundred indicates households that are primarily focused on subsistence and commercialization-based, respectively (Gebremedhin & Jaleta, Citation2010; Govereh et al., Citation1999). Every household’s level of commercialization is provided independently by the index. To determine the level of commercialization, the households were divided into three categories based on market orientation: subsistence, semi-commercial, and commercial. In a system known as subsistence farming, the focus is on the household and maintaining food self-sufficiency, while semi-commercial farmers are more inclined to gain marketable surplus while maintaining the food security of their households and commercial farmers are more motivated by profit maximization than by maintaining food security for their households (Tesso, Citation2016). One-way Analysis of Variance (ANOVA)was used to examine the welfare effects of tef commercialization of farm households in the approach of (Gebreselassie & Sharp, Citation2007; Osmani et al., Citation2014). The categories of food and non-food consumption expenditures of the adopters and non-adopters were compared in line with their levels of commercialization.
The quantitative data analysis was done using the STATA version 16 software package. Below is an explanation of the specifications for the descriptive and econometric models used in the analysis.
2.4.2. Descriptive statistical analysis
Mean, standard deviation, proportions, frequency and percentages were used as descriptive statistical analysis tools, and Chi-square (x2) test, t-test and F-test were used to assess the extent of crop commercialization and determine whether adopter and non-adopter farm households differed in any way that could be statistically verified.
2.4.3. Econometric analysis
The welfare of farm households was examined using the Propensity Score Matching (PSM) technique. The Korra tef variety was adopted through the program placement (i.e. AGP II), hence, it is impossible to randomly assign the subjects to undergo the treatment. Consequently, we focused on estimating the Average Treatment effect on the Treated (ATT). The following is how the Average Treatment Effect (ATE) is determined:
The assumes that the consumption level of non-adopters at the time of data collection E (Y0 |D = 0) may be roughly compared to that of adopters before their adoption E (Y0 |D = 1). However, it is difficult to estimate ATE using the given method because we only observe E (Y1 |D = 1) and E (Y0 |D = 0), not E (Y0 |D = 1). They would also be less likely to be statistically equivalent to the comparison group due to the potential for biased estimation that could result from program placement (self-selection bias). The PSM, which (Rosenbaum & Rubin, Citation1983) defined as the conditional probability of receiving a treatment given pre-treatment characteristics, was used to remove this bias.
Where, d = {0, 1} is the indicator of exposure to treatment and
x is the multidimensional vector of pre-treatment characteristics.
The Conditional Independence Assumption (CIA) and the Common Support Condition (CSC) must both be met for the PSM method’s results to be considered reliable. When matching, the assumptions were considered. Adopters and non-adopters who share a substantial amount of overlap or a common support region, for instance, were taken into account. The major matching algorithms, including nearest neighbor, radius, caliper, and kernel, were used to obtain adequate common support and for an optimal estimation procedure.
As the basic requirement for the PSM, the variables that are unaffected by whether or not people adopt were selected (Heckman et al., Citation1997) (see Table ). The Variance Inflation Factor (VIF) and Contingency Coefficient tests were then used to determine whether multicollinearity among the chosen variables was likely to exist. Additionally, a probit regression model was used to estimate the p-score of the selected variables after checking for multicollinearity issues. Detailed discussions on the PSM procedures were presented in the findings and discussion section.
Table 3. Definition and measurements of the independent variables used in the study
2.5. Definition of variables and working hypothesis
The welfare of farm households was considered the study’s dependent variable, and it was calculated using their consumption level. The adoption of the Korra tef variety was treated as the study’s treatment variable. The variables listed in Table were found to have an effect on the farm households’ consumption or outlays based on the conceptual and empirical literature, making them the study’s independent variables.
3. Results and discussion
3.1. Descriptive results
The analysis covers 479 households in total, of whom 221 (46.14%) were adopters of the Korra tef variety, and 258 (53.86%) were non-adopters of the Korra tef variety who adopted other alternative tef varieties like Boset, Dagim, Dursi, Flagot, Warekiyu, Hiber and Tesfa in 2020. The statistical analysis of the chi square-test distribution for the study’s dummy and categorical variables is shown in the subsequent table. Accordingly, as shown in Table , statistically non-significant differences were observed in the gender of the household heads of the two groups (p = 0.240) and in terms of their access to credit (p = 0.858). However, the two groups were significantly different in their marital status (p = 0.045), access to information (p = 0.030) (as determined by radio ownership), and cooperative membership (p = 0.003). The study by (Biyase & Zwane, Citation2018) indicated that the wellbeing of the household is significantly impacted by the marital status of the household heads. Another study has also shown that access to information has a positive impact on smallholder farmers’ well-being (Haile et al., Citation2019). Additionally, previous studies have shown that smallholder farmers’ wellbeing is positively impacted by joining agricultural cooperatives (Ahmed & Mesfin, Citation2017; Mojo et al., Citation2017).
Table 4. Statistical summary of x2-test distribution for dummy and categorical variables
Table shows the statistical analysis of the study’s t-test for continuous variables. The differences between the groups were statistically significant in all the continuous variables (p < 0.05), except for the incomes they earned from non-farm activities (p = 0.4072). According to earlier studies (Alemu & Adesina, Citation2017; Bacha et al., Citation2011), farm experience, total land, and livestock ownership, remittances, market access, and FTC have all positively impacted the level of household consumption. The same is likely true for the welfare of the farm households under study. However, household welfare is negatively impacted by household size (Alemu, Citation2011; Mekonnen, Citation2017; Teka & Lee, Citation2020). Overall, the simple descriptive statistics revealed that many of the factors listed in Tables were statistically different between the adopter and non-adopter groups.
Table 5. Statistical summary of t-test for continuous variables
The very objective of this study is to measure the welfare status of farm households. However, it is imperative to look at their crop production per hectare, income, and degree of commercialization before measuring their welfare because the literature has shown that these factors are still largely necessary for farmers’ welfare outcomes (Gebreslassie et al., Citation2015; Krause et al., Citation2019; Muriithi & Matz, Citation2015; Osmani et al., Citation2014; Poulton, Citation2017).
3.1.1. Tef yield and income
The average tef yield was 2037.63 quintals for adopters and 1434.26 quintals for non-adopters, respectively. At 1%, it was determined that there was a significant difference between the yield gains. The adopters also reported higher tef income, exactly at the same level of significance (Table ).
Table 6. Average tef production and net income by respondent types
3.1.2. Categories and levels of commercialization of tef producers
Following (Samuel & Kay, Citation2008; Tadele et al., Citation2017) studies, smallholders’ commercialization was classified into three categories: less-commercialized farmers sold up to 25% of their output, semi-commercialized farmers sold between 25% and 50% of their output, and more commercialized farmers sold more than 50% of their produce (commercialized farmers). As per the results indicated in Table , the majority of adopters (84.07%) fall in the category of commercialized farmers, whereas the majority of non-adopters lie in the category of semi-commercialized farmers. In the group of less commercialized farmers, there are much more non-adopters than adopters (exceeding 97.5%). These data from the aforementioned categories may broadly suggest that adopters engage in tef marketing at a higher rate than non-adopters.
Table 7. Categories of commercialization of tef producers in 2020
As can be seen in Table , the sample households’ average HCI was 46.95%, meaning they had sold around 47% of the tef produced during the 2020 cropping season. This result is approximately consistent with earlier studies (Assefa, Citation2022; Degefa et al., Citation2022; Eshetu, Citation2018; Getahun et al., Citation2019). The amounts of tef produce sold differ between the two categories. About 59% of the produce grown by adopters was sold, compared to only 37% by non-adopters. This shows that when comparing the two groups, the adopters had the highest level of tef crop commercialization. Additionally, it was found that the key informants confirmed Korra tef‘s role in their higher commercialization status.
Table 8. HCI of tef producers in 2020
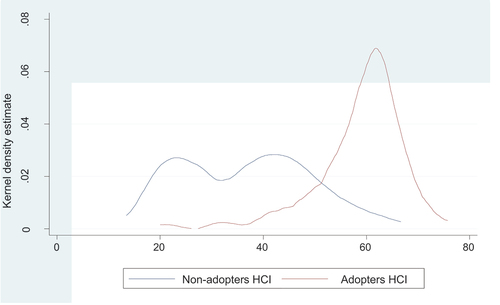
Figure provides more clarification by depicting the degree of engagement in the tef market of the two groups: adopters, represented by the red color, and non-adopters, represented by the blue color.
Figure 3. Kernel density estimate of household commercialization Index (HCI).
Based on the consumption per adult equivalent, the general expenditures noted from the literature are computed. Considering the face values of the farm households’ expenditures, the t-test result showed that there were statistically significant differences between the two groups in the total yearly expenditures at p < 0.01, as is shown in Table . This showed that both in terms of food and non-food consumption, the adopter group’s average annual expenditures far outpaced those of the non-adopters.
Table 9. The average expenditures of farm households
To examine the aggregate consumption outcomes of farm households with the category of their commercialization, the t-test was once more used. In each HCI category, comparisons were made between the two groups. Accordingly, it was found that the consumption levels between adopters and non-adopters were significantly different in the remaining food, non-food, and aggregate consumptions identified for the study, except for the non-food consumption for the households at the medium level of commercialization (Table ). This could mean that adopters consume more than non-adopters, regardless of whether they live in low, medium, or high levels of commercialization, indicating a greater welfare status.
Table 10. The average expenditures of farm households (Etb/person/annum) vis-a-vis the HCI
A one-way ANOVA test is conducted to examine the welfare outcomes of farm households that are categorized under three levels of tef commercialization. The adopter group’s F-test result of (F = 0.60) indicates that the difference in households’ total expenditures on both food and non-food items across the three commercialization categories was statistically insignificant. However, the differences between the mentioned commercialization categories were statistically significant at the 1% significance level (F = 6.22) for the non-adopters, and their consumption showed an unswerving increasing pattern along the commercialization index, from low to high (Table ). The result of the latter group suggests that with the mentioned consumption items, the higher the degree of commercialization, the more they invest in consumption.
Table 11. One-way ANOVA result for a comparison of expenditures of farm households with the levels of their commercialization
The adopter group’s one-way ANOVA test result was found to be inconsistent, while the non-adopter group’s result was consistent with the earlier studies by (Gebreselassie & Sharp, Citation2007; Osmani et al., Citation2014), in which farm households at different levels of commercialization showed statistically significant variation in welfare outcomes (represented by expenditures) in both cases. The adopters’ comparable consumption patterns among the three categories of commercialization could be attributed to the presence of AGP II at the treatment district because nutrition and dietary diversity were among the intervention pillars of the program by which various awareness creation activities were conducted to improve the consumption patterns of the adopter farm households. The key informants’ testimonies support this claim by stating that the AGP II frequently provided awareness-raising activities on consumption in general and nutrition and dietary diversity in particular for all adopters of Korra tef, which led to a notable change in their consumption habits.
Even though no significant differences in total expenditures were observed within the adopter group along their commercialization index (the F-results shown in Table ), the t-test result revealed a statistically significant difference at the 1% significance level (p = 0.0000) between the adopters and non-adopters in their average total expenditures of both food and non-food items (Table ). This entails that the adopters invested more money in the consumption of various items in comparison with the non-adopters. Thus, it could be inferred that keeping other factors unchanged, the adopter farm households’ welfare shows an improvement in comparison with the non-adopters. Overall, these outcomes suggest that if welfare improvement of farm households is envisaged via the adoption of improved tef seed, in addition to the requirement for an effective and efficient tef marketing system, strategies and methods for consumption enhancement should be developed. It is also implied that comprehensive strategies for enhancing consumption should be tailored to reach farm households at various stages of commercialization.
However, these comparisons did not account for the effects of other farm household characteristics. Due to the issue of selection bias and non-compliance, the observed differences cannot be exclusively attributed to the adoption of Korra tef (Heckman et al., Citation2005). Therefore, we used the PSM method to examine how the adoption of Korra tef has impacted the welfare of farm households.
3.2. Impact of the adoption of Korra tef on the adopter farm households’ welfare (Consumption per adult equivalent)
As can be seen from the Table , the continuous variables have a VIF of less than 1.21 and a mean value of 1.09; while the discrete variables’ contingency coefficients were close to zero (Table ). These results demonstrated that the variables are free of multicollinearity issues, enabling us to run further regression.
Table 12. Result of the VIF
Table 13. Contingency coefficients test for discrete variables
3.2.1. Estimation of propensity Score
The results shown in Table that adopters and non-adopters differed statistically in all variables—apart from gender, marital status, access to credit, and income from non-farm activities—indicates that confounders needed to be corrected before ATT estimates could be made.
Table 14. Probit regression of adoption
3.2.2. Testing the balance of propensity score and covariates
After matching was completed, a statistically insignificant correlation was found between the control and treatment groups. Then, by lowering the percentage of bias from ranges of 1.6 and 45.6 before matching to ranges of 0.2 and 6.8, the imbalance between them was minimized. As a result, the proportion of bias has decreased below the acceptable cutoff value of 20% (Rosenbaum & Rubin, Citation1983). Table shows a comparison of the variables before and after matching. Selecting a matching algorithm comes next, once the covariates have been balanced.
Table 15. Propensity score and covariate matching for the variables used
3.2.3. Choice of matching algorithm
All matching estimators that satisfy the PSM assumptions that the mean bias and β values should be less than 5% and 25%, respectively (Rubin, Citation2001) were performed to test the results’ robustness and to find a better estimation algorithm (Table ). The algorithm we chose, Kernel estimation with Bandwidth (0.1), has the lowest Ps R2, mean bias, and B and R values. A lower Ps R2 shows the absence of the adopters’ distinctive characteristics (Caliendo & Kopeinig, Citation2008). The results we found from other matching algorithms were also comparable with the result from the Kernel estimation algorithm with Bandwidth (0.1).
Table 16. Comparison of the matching estimators for both productivity and income
The calculated propensity score for the entire sample has a range of 0.0007765 to 0.9636034 and a mean of 0.4580324. The p-scores for adopters range from 0.0653953 to 0.9636034, while those for non-adopters range from 0.0007765 to 0.8932305 (Table ). Observations whose propensity scores are beyond the range of 0.065 and 0.893 are excluded from the sample using the Minima and Maxima criterion of the common support region, where the values of both groups can be obtained (Heinrich et al., Citation2010). Fortunately, only six observations in all matching estimators reported in Table are beyond the common region support.
Table 17. Distribution of estimated propensity scores
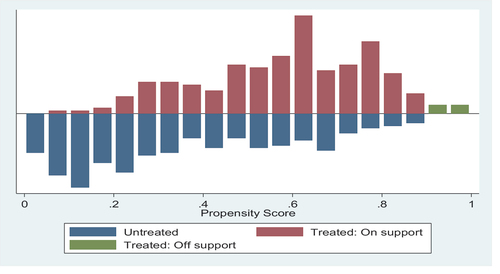
Figure ‘s indication of the wide common region support and the relatively reasonable distribution of p-scores between the treatment and control groups suggest that there is a fair balance between the groups. This led to an estimation of the treatment’s impact on the group under treatment.
Figure 4. Distribution of propensity score generated from Kernel matching (0.1).
3.2.4. Estimating treatment effect on the treated (impact of adoption on the adopters)
Table shows the estimation outcome for the ATT of the outcome variable using the Kernel estimation algorithm with Bandwidth (0.1). The impact estimate demonstrates that the adoption of the Korra tef variety has a positive and significant impact (P < 0.01) on adopter farm households’ welfare as measured by annual consumption expenditure per adult equivalent (9562.23 ETB). According to the findings, adults who are members of the adopter group consume 9562 ETB more on average than those who are members of the non-adopter group. This result is consistent with those of (Mulugeta & Hundie, Citation2012) who examined the impact of the adoption of improved wheat technologies on households’ food consumption in Southeastern Ethiopia (Asfaw et al., Citation2012); who looked at the welfare (consumption) effects of improved crop varieties (Degefu, Citation2016); who investigated the welfare impact of improved food legume technologies; and (Awotide et al., Citation2016) who examined the impact of adopting improved rice varieties on total household expenditure (a proxy for welfare).
Table 18. Total expenditures per adult result of average treatment effect on the treated (ATT)
3.2.5. Sensitivity analysis
Sensitivity analysis is used in observational studies to overcome the problem of uncontrolled confounding and assess how robust the PSM results are (Li et al., Citation2011; Liu et al., Citation2013). Based on this, the PSM result is subjected to a Rosenbaum bounds sensitivity analysis. Therefore, the lowest critical value (Г) that includes zero for the outcome variable of total expenditures per adult is 20.9 (95% confidence interval), as shown in Table . This indicated that for the PSM result to be sensitive to unobserved influences, the two groups should have been dissimilar up to 1990% (e = 20.9) in terms of unobserved covariates, which is unlikely to occur in the studied settings. This hidden bias magnitude result shows that the significant result in total expenditures between adopters and non-adopters is insensitive to unobserved selection bias, suggesting that the adoption of the Korra tef variety is solely responsible for the positive impact revealed.
Table 19. Rosenbaum bounds sensitivity analysis (Kernel matching algorithm, bandwidth = 0.1)
4. Conclusion and recommendations
This study sought to shed light on the argument that adopting improved crop seed varieties may improve the welfare of the adopters by examining the welfare impact of adopting the Korra tef variety. The tef yield and corresponding income of the adopter farm households were first examined, and their tef commercialization level was investigated using HCI. The amount spent on consumption by the adopters at various levels of commercialization was then examined. Finally, the PSM model was used to investigate the welfare impact of adopting Korra tef. The result showed that the adoption of Korra tef has a positive impact on tef productivity (yield per hectare), and income (net income). The mean commercialization percentage for the studied farm households was found to be 46.95% indicating a moderate level of commercialization. However, the degree of commercialization varies between adopters and non-adopters, with the former falling into the commercialized (58.92%) and the latter into the semi-commercialized (36.7%) categories. With a relatively high level of commercialization, adopters had a markedly high annual expenditure per adult equivalent than non-adopter implying a better welfare status from the adoption of Korra tef.
Hence, to improve the welfare of farm households, development policies and strategies aimed at the adoption of Korra tef should promote its productivity and commercialization, and other supportive consumption enhancement activities. Detailed consumption enhancement strategies should also be customized in a way it touches farm households that potentially lie in different degrees of commercialization. In its broader sense, activities that encourage smallholder farmers’ tef market access and participation like marketing extension services and market linkages should be in focus while building and designing agriculture-based institutional support programs. Access to credit and rural savings should also be encouraged to promote smallholders’ participation in commercial crops. Since the adopter farmers were found at different levels of commercialization, scaling up the best practices of the adopters to other farmers can also be taken into consideration for area-specific recommendation while introducing new tef varieties.
Lastly, since the ATT values may exhibit a significant variation based on farm households’ demographic, socio-economic, and institutional factors, further research is needed on the heterogeneous welfare effects of the adoption of Korra tef. This, in turn, would aid in a thorough understanding of the differential impacts of adopting Korra. Furthermore, the determinants of Korra tef adoption in tandem with consumption should be investigated, as this may help in identifying key characteristics or behaviors of farm households associated with more dynamic welfare paths.
Authors contribution
The idea and study design were proposed by the corresponding author, who also gathered the data, carried out the data analysis, and wrote the report. On the study’s title and design, the co-authors have made helpful ideas. Additionally, they help with statistics and read and edit the content. The manuscript’s published form was approved by all authors after they had read it.
Geolocation information
The study area, Wara-Jarso woreda, is located in the Oromia region, Northwest Ethiopia. It is found 185 km far from Addis Ababa, the capital city of the country. It is situated at 38° 14’ 60.00“East longitude and 9° 49’ 59.99” North latitude.
Acknowledgments
The study’s authors would like to thank all of the farm household heads, study participants, and interview subjects for volunteering their time. We also like to thank the study area’s Development Agents, who took part in the study as supervisors and enumerators.
Disclosure statement
No potential conflict of interest was reported by the author(s).
Data availability statement
The data used to support the findings of this study are available from the corresponding author upon request.
Additional information
Funding
Notes on contributors

Solomon Zewdu Leul
Solomon Zewdu Leul is a Doctoral candidate in Development Studies at Addis Ababa University, Ethiopia. His research interests include agriculture and rural development, welfare, food security, development economics, poverty, environment, labor and social protection, social policy, and project management.
Alemu Azmeraw Bekele
Alemu Azmerawu Bekele (Ph.D.) is an assistant professor of Development Studies at Addis Ababa University. His research interests include rural development, crop productivity and commercialization, social dimensions of development, gender, conflict resolution, displacement management, land tenure, project management, environment, and natural resources management.
Alemseged Gerezgiher Hailu
Alemseged Gerezgiher Hailu (Ph.D.) is an assistant professor of Development Studies at Addis Ababa University. His research interests include food security, welfare, local economic development, entrepreneurship, small and medium enterprises, and rural poverty.
Solomon Tsehay Feleke
Solomon Tsehay Feleke (Ph.D.) is an assistant professor of Agricultural Economics at Addis Ababa University. His research interests dwell on macroeconomic and CGE, linear and nonlinear modeling, impact assessment, poverty, food security and income inequality.
Notes
1. Woreda refers to the second smallest administrative level above the kebele and below the zone in Ethiopia, except the capital city, Addis Ababa.
2. Tef is a staple food crop for millions of people in Ethiopia. It is the most important crop by area planted and value of production, and the second-most important crop in generating income.
3. Kebele refers to the smallest administrative unit in Ethiopia, except the capital, Addis Ababa.
4. FTCs (Farmers’ Training Centers) are structures established in rural Ethiopia to support smallholder farmers. They were established throughout the country to train the farmers on the use of technological packages and to facilitate agricultural extension services.
References
- Abate, G. T., Bernard, T., de Brauw, A., & Minot, N. (2018). The impact of the use of new technologies on farmers’ wheat yield in Ethiopia: Evidence from a randomized control trial. Agricultural Economics, 49(4), 409–29. https://doi.org/10.1111/agec.12425
- Adejobi, A. O., & Akinola, C. A. (Eds). (2013). An analysis of the effects of agricultural output commercialization on household welfare in Osun state of Nigeria. https://doi.org/10.22004/ag.econ.160136
- Afework, H., & Endrias, G. (2016). Review on small holders agriculture commercialization in Ethiopia: What are the driving factors to focused on? Journal of Development and Agricultural Economics, 8(4), 65–76. Academic Journals. https://doi.org/10.5897/JDAE2016.0718
- Ahmed, M. H., & Mesfin, H. M. (2017). The impact of agricultural cooperatives membership on the wellbeing of smallholder farmers: Empirical evidence from eastern Ethiopia. Agricultural and Food Economics, 5(1), 6. https://doi.org/10.1186/s40100-017-0075-z
- Alemu. (2011). Farmer-based seed multiplication in the Ethiopian seed System: Approaches, priorities and performance: 14. Future Agricultures, Working paper 036. https://core.ac.uk/reader/19917980.
- Alemu, A. E., & Adesina, J. O. (2017). In search of rural entrepreneurship: Non-farm household enterprises (NFEs) as instruments of rural transformation in Ethiopia. African Development Review, 29(2), 259–271. https://doi.org/10.1111/1467-8268.12255
- Aman, T., Adam, B., & Lemma, Z. (2014). Determinants of smallholder commercialization of horticultural crops in Gemechis district, West Hararghe zone, Ethiopia. African Journal of Agricultural Research, 9(3), 310–319. Academic Journals. https://doi.org/10.5897/AJAR2013.6935
- Amsalu, M. (2014). Impact of smallholder farmers agricultural commercialization on rural households’ poverty. International Journal of Applied Economics and Finance, 8(2), 51–61. https://doi.org/10.3923/ijaef.2014.51.61
- Asfaw, S., Shiferaw, B., Simtowe, F., & Lipper, L. (2012). Impact of modern agricultural technologies on smallholder welfare: Evidence from Tanzania and Ethiopia. Food Policy, 37(3), 283–295. https://doi.org/10.1016/j.foodpol.2012.02.013
- Assefa. (2022) Smallholder farmers Tef commercialization and its impact on food security: The case of Andabet District, Amhara Region, Ethiopia [ PhD thesis].
- Atkinson, A. B. (1992). Measuring poverty and differences in family composition. Economica, 59(233), 1–16. https://doi.org/10.2307/2555062
- Awotide, B. A., Awoyemi, T. T., Omonona, B. T. (2016). Agricultural technology adoption, commercialization and smallholder rice farmers’ welfare in rural Nigeria. Agricultural and Food Economics, 4(1), 216–237. https://doi.org/10.1186/s40100-016-0047-8
- Bacha, D., Namara, R., Bogale, A., & Tesfaye, A. (2011). Impact of small-scale irrigation on household poverty: Empirical evidence from the Ambo district in Ethiopia. Irrigation and Drainage, 60(1), 1–10. https://doi.org/10.1002/ird.550
- Berik, G. (2018) Toward more inclusive measures of economic well-being: Debates and practices. Research Paper. ILO future of work research paper series. https://www.ilo.org/wcmsp5/groups/public/—dgreports/—cabinet/documents/publication/wcms_630602.pdf.
- Beyene, H. (2008) Adoption of improved tef and wheat production technologies in crop-livestock mixed systems in northern and western Shewa zones of Ethiopia [ PhD thesis]. University of Pretoria.
- Biggeri, M., Burchi, F., Ciani, F., & Herrmann, R. (2018). Linking small-scale farmers to the durum wheat value chain in Ethiopia: Assessing the effects on production and wellbeing. Food Policy, 79, 77–91. https://doi.org/10.1016/j.foodpol.2018.06.001
- Biru, W. D., Zeller, M., & Loos, T. K. (2020). The impact of agricultural technologies on poverty and vulnerability of smallholders in Ethiopia: A panel data analysis. Social Indicators Research, 147(2), 517–544. https://doi.org/10.1007/s11205-019-02166-0
- Biyase, M., & Zwane, T. (2018). An empirical analysis of the determinants of poverty and household welfare in South Africa. Journal of Developing Areas, 52(1), 115–130. https://doi.org/10.1353/jda.2018.0008
- Caliendo, M., & Kopeinig, S. (2008). Some practical guidance for the implementation of propensity score matching. Journal of Economic Surveys, 22(1), 31–72. https://doi.org/10.1111/j.1467-6419.2007.00527.x
- Camara, A. (2017). An analysis of welfare effect of market participation of smallholder farm households in Guinea. Economic Research Guardian, 7(1), 2. http://www.ecrg.ro/files/p2017.7(1)4y1.pdf
- Creswell, J. W., & Creswell, J. D. (2017). Research design: Qualitative, quantitative, and mixed methods approaches. Sage publications.
- Deaton, A. (2005). Measuring poverty in a growing world (or measuring growth in a poor world). The Review of Economics and Statistics, 87(2), 395–395. Main St., Suite 500, Cambridge, MA 02142-1046, USA journals 1–19. https://doi.org/10.1162/0034653053970384
- Degefa, K., Abebe, G., & Biru, G. (2022). Determinants of market participation decision and intensity of market participation in western Ethiopia: Evidence from smallholder tef producers. International Journal of Agricultural Science and Food Technology, 8(2), 125–133. https://doi.org/10.17352/2455-815X.000153
- Degefu, Z. (2016) Adoption and welfare impact of improved food legume technologies in Bale Highlands of Ethiopia: Intra and inter-household empirical analysis [ Thesis]. Haramaya University. https://cgspace.cgiar.org/handle/10568/78134
- Dercon, S., Gilligan, D. O., Hoddinott, J., & Woldehanna, T. (2009). The impact of agricultural extension and roads on poverty and consumption growth in fifteen Ethiopian villages. American Journal of Agricultural Economics, 91(4), 1007–1021. https://doi.org/10.1111/j.1467-8276.2009.01325.x
- Diriba, G. (2018). Overcoming agricultural and food crises in Ethiopia: Institutional evolution and the path to agricultural transformation. Independently published.
- Diriba, G. (2020) Agricultural and rural transformation in Ethiopia: Obstacles, triggers and reform considerations policy working paper.
- Edosa, T. L. (2018). Determinants of commercialization of teff crop in Abay Chomen district, Horo Guduru wallaga zone, Oromia regional state, Ethiopia. Journal of Agricultural Extension & Rural Development, 10(12), 251–259. https://doi.org/10.5897/JAERD2018.0970
- Endalew, B., Aynalem, M., Assefa, F., & Ayalew, Z. (2020). Determinants of wheat commercialization among smallholder farmers in Debre Elias Woreda, Ethiopia. Advances in Agriculture, 2020, 1–12. https://doi.org/10.1155/2020/2195823
- Endalkachew, T., Sebsibie, S., & Asmare, W. (2014). Agricultural technology adoption and rural poverty: A study on smallholders in Amhara regional state, Ethiopia. Ethiopian Economics Association (EEA).
- Eshetu, G. (2018) Commercialization of smallholder tef producers in Jamma District, South Wollo Zone, Ethiopia [ PhD thesis]. Haramaya university.
- Fan, S., & Rue, C. (2020). The role of smallholder farms in a changing world. In S. Gomez y Paloma, L. Riesgo, & K. Louhichi (Eds.), The role of smallholder farms in food and nutrition security (pp. 13–28). Springer International Publishing. https://doi.org/10.1007/978-3-030-42148-9_2
- FAO. (2014) Economic and social development department. The state of food and agriculture (SOFA) 2014. HLPE: High level panel of experts on food security and nutrition. Retrieved July 7, 2022, from https://policycommons.net/artifacts/2071892/the-state-of-food-and-agriculture-sofa-2014/2827191/
- Feyisa, B. W., & Yildiz, F. (2020). Determinants of agricultural technology adoption in Ethiopia: A meta-analysis. Cogent Food & Agriculture, 6(1), 1855817. Yildiz F (ed.). https://doi.org/10.1080/23311932.2020.1855817
- Garbero, A., & Songsermsawas, T. (2018). Impact of modern irrigation on household production and welfare outcomes: Evidence from the participatory small-scale irrigation development programme (PASIDP) project in Ethiopia. IFAD Research Series, 31, 1–47. (International Fund for Agricultural Development (IFAD)). https://go.gale.com/ps/i.do?p=AONE&sw=w&issn=&v=2.1&it=r&id=GALE%7CA573559011&sid=googleScholar&linkaccess=abs
- Gebremedhin, B., & Jaleta, M. (2010) Commercialization of smallholders: Is market participation enough?
- Gebreselassie, S., & Sharp, K. (2007). Commercialisation of smallholder agriculture in selected tef-growing areas of Ethiopia. Ethiopian Journal of Economics, 16(1), 55–86. https://doi.org/10.4314/eje.v16i1.39824
- Gebreslassie, H., Kebede, M., & Kiros-Meles, A. (2015). Crop commercialization and smallholder farmers livelihood in Tigray region, Ethiopia. Journal of Development and Agricultural Economics, 7(9), 314–322. https://doi.org/10.5897/JDAE2015.0649
- Gelaw, A. (2017, January 1) Climate smart agriculture in Ethiopia. Climate smart agriculture country profiles for Africa series.
- Getahun, A., Goshu, D., & Bekele, A. (2019). Determinants of commercialization of tef: The case of smallholder farmers in Dendi district of Oromia. International Journal of African and Asian Studies, 56, 1–14. https://doi.org/10.7176/JAAS
- Gezahegn, A. M., Desta, B. T., Takele, A., & Eshetu, S. (2019). Productivity of tef [Eragrostis tef] under conservation tillage practices in central Ethiopia. Cogent Food & Agriculture, 5(1), 1707038. https://doi.org/10.1080/23311932.2019.1707038
- Goedde, L., Ooko-Ombaka, A., & Pais, G. (2019). Winning in Africa’s agricultural market. McKinsey & Company.
- Govereh, J., Nyoro, J., & Jayne, T. S. (1999). Smallholder commercialization, interlinked markets and food crop productivity: Cross-country evidence in Eastern and Southern Africa. Citeseer.
- Grootaert, C. (1986). The use of multiple diaries in a household expenditure survey in Hong Kong. Journal of the American Statistical Association, 81(396), 938–944. https://doi.org/10.1080/01621459.1986.10478353
- Haile, M. G., Wossen, T., & Kalkuhl, M. (2019). Access to information, price expectations and welfare: The role of mobile phone adoption in Ethiopia. Technological Forecasting and Social Change, 145, 82–92. https://doi.org/10.1016/j.techfore.2019.04.017
- Heckman, J., Ichimura, H., & Todd, P. (1997). Matching as an econometric evaluation estimator: Evidence from evaluating a job training programme. Review of Economic Studies, 64(4), 605–654. https://doi.org/10.2307/2971733
- Heckman, Vytlacil, E., & Heckman, J. J. (2005). Structural equations, treatment effects, and econometric policy evaluation 1. Econometrica, 73(3), 669–738. https://doi.org/10.1111/j.1468-0262.2005.00594.x
- Heinrich, C., Maffioli, A., & Vázquez, G. (2010). A Primer for Applying Propensity-Score Matching, Office of Strategic Planning and Development Effectiveness, Inter-American Development Bank Impact-Evaluation Guidelines Technical Notes. (No. IDB-TN-161). Washington DC, USA.http://www.iadb.org/document.cfm?id=35320229
- Hentschel, J., & Lanjouw, P. (2000). Household welfare measurement and the pricing of basic services. Journal of International Development, 12(1), 13–27. https://doi.org/10.1002/(SICI)1099-1328(200001)12:1<13:AID-JID568>3.0.CO;2-3
- Kamara, A., Conteh, A., Rhodes, E. R., & Cooke, R. A. (2019). The relevance of smallholder farming to African agricultural growth and development. African Journal of Food Agriculture Nutrition & Development, 19(1), 14043–14065. https://doi.org/10.18697/ajfand.84.BLFB1010
- Kebede, Korji, D., & Kebede, B. (2017). Demonstration of improved teff varieties at selected midland districts of Guji zone, Oromia regional state, Ethiopia. Asian Journal of Agriculture and Rural Development, 7(7), 131–135. https://doi.org/10.18488/journal.1005/2017.7.7/1005.7.131.135
- Krause, H., Faße, A., Grote, U., & Yildiz, F. (2019). Welfare and food security effects of commercializing African indigenous vegetables in Kenya. Cogent Food & Agriculture, 5(1), 1700031. https://doi.org/10.1080/23311932.2019.1700031
- Li, L., Shen, C., Wu, A. C., & Li, X. (2011). Propensity score-based sensitivity analysis method for uncontrolled confounding. American Journal of Epidemiology, 174(3), 345–353. https://doi.org/10.1093/aje/kwr096
- Liu, W., Kuramoto, S. J., & Stuart, E. A. (2013). An introduction to sensitivity analysis for unobserved confounding in non-experimental Prevention Research. Prevention Science: The Official Journal of the Society for Prevention Research, 14(6), 570. https://doi.org/10.1007/s11121-012-0339-5
- Mekonnen, T. (2017) Productivity and household welfare impact of technology adoption: Micro-level evidence from rural Ethiopia. UNU-MERIT Working Paper Series (2017–007).
- Mellor, J. W., & Dorosh, P. (2010). Agriculture and the economic transformation of Ethiopia. International Food Policy Research Institute (IFPRI).
- Mezgebo, T., Tesfay, M. G., & Ghrmay, D. T. (2014) Commercialization of small scale agriculture: Cash crop production effect on household welfare, technical efficiency and power relation of the family in the case of were Baye Tabia of Raya Azebo district in Southern Tigray 2437303, SSRN Scholarly Paper. https://doi.org/10.2139/ssrn.2437303.
- MoA. (2015a) FDRE ministry of agriculture. Agricultural Growth Program II (AGP-II) Program Implementation Manual.
- MoA. (2015b) FDRE ministry of agriculture. Agricultural growth program II (AGP-II) program design Document. Retrieved March 31, 2022, from https://eeas.europa.eu/archives/delegations/ethiopia/documents/financing_agreement/1._agp_ii_design_doc.docx
- Mojo, D., Fischer, C., & Degefa, T. (2017). The determinants and economic impacts of membership in coffee farmer cooperatives: Recent evidence from rural Ethiopia. Journal of Rural Studies, 50, 84–94. https://doi.org/10.1016/j.jrurstud.2016.12.010
- Mossie, M., Gerezgiher, A., Ayalew, Z., & Nigussie, Z. (2021). Welfare effects of small-scale farmers’ participation in apple and mango value chains in Ethiopia. Agrekon, 60(2), 192–208. https://doi.org/10.1080/03031853.2021.1926298
- Mulugeta, T., & Hundie, B. (2012) Impacts of adoption of improved wheat technologies on households’ food consumption in southeastern Ethiopia.
- Muriithi, B. W., & Matz, J. A. (2015). Welfare effects of vegetable commercialization: Evidence from smallholder producers in Kenya. Food Policy, 50, 80–91. https://doi.org/10.1016/j.foodpol.2014.11.001
- National Meteorological Agency of Ethiopia [NMAE]. (2020) Meteorological Grid data. Retrieved June 21, 2022, from https://scholar.google.com/scholar?hl=en&as_sdt=0%2C5&q=National+Meteorological+Agency+of+Ethiopia.+Meteorological+Grid+Data&btnG=
- Natnael, A. B. (2019). Impact of technology adoption on agricultural productivity and income: A case study of improved teff variety adoption in north eastern Ethiopia. Agricultural Research & Technology: Open Access Journal, 20(4), 556139. https://doi.org/10.19080/ARTOAJ.2019.20.556139
- Negussie, F. A. (2020). Impact of row planting teff technology adoption on the income of smallholder farmers: The case of Hidabu Abote district, North Shoa zone of Oromia region, Ethiopia. International Journal of Agricultural Science and Food Technology, 6(2), 195–203. https://doi.org/10.17352/2455-815X.000074
- OECD. (2013). OECD guidelines on measuring subjective well-being. https://doi.org/10.1787/9789264191655-en
- Ogutu, S. O., Gödecke, T., & Qaim, M. (2020). Agricultural commercialisation and nutrition in smallholder farm households. Journal of Agricultural Economics, 71(2), 534–555. https://doi.org/10.1111/1477-9552.12359
- Osmani, M. A. G., Islam, K., & Ghosh, B. C. (2014). Commercialization of smallholder farmers and its welfare outcomes: Evidence from Durgapur Upazila of Rajshahi District, Bangladesh. Journal of World Economic Research, 3(6), 119–126. https://doi.org/10.11648/j.jwer.20140306.16
- Poulton, C. (2017). What is agricultural commercialisation, Why is it important, and how do we measure it?. SOAS University of London.
- Rosenbaum, P. R., & Rubin, D. B. (1983). The central role of the propensity score in observational studies for causal effects. Biometrika, 70(1), 41–55. https://doi.org/10.1093/biomet/70.1.41
- Rubin, D. B. (2001). Using propensity scores to help design observational studies: Application to the tobacco litigation. Health Services & Outcomes Research Methodology, 2(3), 169–188. https://doi.org/10.1023/A:1020363010465
- Ruder, H. L. (2018) Impact of khat production on household welfare in Amhara region of Ethiopia [ PhD thesis].
- Samuel, G., & Kay, S. (2008). Commercialization of smallholder agriculture in selected tef-growth area of Ethiopia. Ethiopian Journal of Economics, 16(683–2016–46875), 55–86. https://doi.org/10.4314/eje.v16i1.39824
- Shenggen, F., Sivan, Y., & Rajul, P.-L. (2019). Agriculture for improved nutrition: Seizing the momentum. Intl Food Policy Res Inst.
- Tadele, M., Wudineh, G., Agajie, T., Ali, C., Tesfaye, S., Aden, A.-H., Tolessa, D., & Solomon, A. (2017). Analysis of wheat commercialization in Ethiopia: The case of SARD-SC wheat project innovation platform sites. African Journal of Agricultural Research, 12(10), 841–849. Academic Journals. https://doi.org/10.5897/AJAR2016.11889
- Teka, A., & Lee, S.-K. (2020). Do agricultural package programs improve the welfare of rural people? Evidence from smallholder farmers in Ethiopia. Agriculture, 10(5), 190. Multidisciplinary Digital Publishing Institute:. https://doi.org/10.3390/agriculture10050190.
- Tesfaye, S., Bedada, B., & Mesay, Y. (2016). Impact of improved wheat technology adoption on productivity and income in Ethiopia. African Crop Science Journal, 24(s1), 127–135. https://doi.org/10.4314/acsj.v24i1.14S
- Tesso, G. (2016). Commercialization of smallholder farmers in light of climate change and logistic challenges: Evidence from central Ethiopia. Global Journal of Economics and Business Administration, 1, https://doi.org/10.28933/tesso-gjeba-09-2016
- Von Braun, J. (1995). Agricultural commercialization: Impacts on income and nutrition and implications for policy. Food Policy, 20(3), 187–202. https://doi.org/10.1016/0306-9192(95)00013-5
- Weldemeskel, T., Ketema, M., Haji, J., & Zemedu, L. (2020). Welfare impact of moringa market participation in Southern Ethiopia. Sustainable Agriculture Research, 9(3), 98. (eds). https://doi.org/10.22004/ag.econ.309786
- Wolfenson, K. D. M. (2013) Coping with the food and agriculture challenge: Smallholders’ agenda. Retrieved July 7, 2022, from https://www.semanticscholar.org/paper/Coping-with-the-food-and-agriculture-challenge%3A-Wolfenson/61b749b9c53e7771611b69504bec804c7abb0d2a
- Wondimagegnhu, B. A., Huluka, A. T., Nischalke, S. M., & Read, R. (2019). Determinants of farm livelihoods of smallholder farmers in Yayu biosphere reserve, SW Ethiopia: A gender disaggregated analysis. Cogent Economics & Finance, 7(1), 1645583. Read R (ed.). https://doi.org/10.1080/23322039.2019.1645583
- Wordofa, M. G., Hassen, J. Y., Endris, G. S., Aweke, C. S., Moges, D. K., & Rorisa, D. T. (2021). Adoption of improved agricultural technology and its impact on household income: A propensity score matching estimation in eastern Ethiopia. Agriculture & Food Security, 10(1), 1–12. https://doi.org/10.1186/s40066-020-00278-2
- Yamane, T. (1967) Statistics: An introductory analysis.
- Zeng, D., Alwang, J., Norton, G. W., Shiferaw, B., Jaleta, M., & Yirga, C. (2017). Agricultural technology adoption and child nutrition enhancement: Improved maize varieties in rural Ethiopia. Agricultural Economics, 48(5), 573–586. https://doi.org/10.1111/agec.12358
- Zerssa, G., Feyssa, D., Kim, D.-G., & Eichler-Löbermann, B. (2021). Challenges of smallholder farming in Ethiopia and opportunities by adopting climate-smart agriculture. Agriculture, 11(3), 192. https://doi.org/10.3390/agriculture11030192