
 ?Mathematical formulae have been encoded as MathML and are displayed in this HTML version using MathJax in order to improve their display. Uncheck the box to turn MathJax off. This feature requires Javascript. Click on a formula to zoom.
Abstract
This study explored the average price series of two meat products (beef and mutton) sold at retail markets in five countries worldwide using monthly data from 2016 to 2020. The study applied the standard TAR and its extensions (CTAR and CMTAR) models to assess the speed of price movement and nature of market integration of foreign and domestic beef and mutton markets in Ghana. Due to evidence of asymmetries in the cointegration analysis among these beef and mutton market pairs, the asymmetric error correction framework was used to analyse the short-run price adjustment process. All the markets are exhibiting asymmetry processes to indicate that price movements in the foreign markets are quickly transferred to the domestic markets at different levels. The beef market pair of South Africa and Ghana exhibited threshold and asymmetric adjustment, and therefore, price change in the reference market (South Africa) must exceed the threshold price before an adjustment could occur in the Ghanaian beef market. However, there is no evidence to conclude that instability or volatility of the exogenous variables such as oil prices and exchange rates has any significant impact on the price transmission process, especially beef and mutton prices in the country. For symmetric price transmission across these markets, which indicates market efficiency, a properly functioning agricultural market information system is recommended, especially for foreign markets and domestic markets, to promote price information flow to market agents across these markets.
PUBLIC INTEREST STATEMENT
Ghana has, in recent times, resorted to the importation of live animals and other meat products to supplement the inadequate domestic supply of animal-based protein. The high demand for these products is attributed to the growing population and increasing middle class. The meat importation indicates trade flow, and this is likely to create market integration and price transmission relationship between domestic and foreign reference markets. This study, therefore, used a price series of selected foreign markets for beef and mutton and incorporated crude oil prices and exchange rates to study how the domestic and foreign markets for these products are interrelated. The study found some level of interdependence among foreign and domestic meat market pairs with some unequal adjustment processes. The study, therefore, recommends effective market information to market agents while strengthening domestic production to prevent the price hikes of importers who form cartels to control the market.
1. Introduction
The issue of cross-border trade, especially in meat and livestock products markets, has continuously soared due to an imbalance in the demand–supply of the market for these products. In recent years, Ghana has resorted to the importation of live animals and meat products to supplement the lag in the supply of animal-source protein in the country. Ghana currently produces less than 30% of the animal protein requirements, which cannot meet the growing demand of the rapidly growing population and increasing middle class of the country (Ministry of Food and Agriculture [MoFA], Citation2019). The country, therefore, imports beef and edible offal from Belgium and the Netherlands, while other meat products like cold cuts, frozen products, and convenience products, which are mainly available in supermarkets, are brought in from the European Union and the USA (MoFA, Citation2019). This development has created a trade flow between these countries and Ghana in terms of the meat trade.
In the presence of trade flow, price transmission becomes exigent in the measure of the efficiency of these spatially separated markets. This is vital because the decision of resource allocation and output mix taken by economic agents is greatly guided by price adjustment behaviour along and across the marketing and distribution channels (Acquah et al.,). The nature of market integration depends on the degree of price transmission (Oyewumi & Sarker, Citation2010). Effective international trade integration (dynamics) and efficient allocation of productive resources, especially in the livestock and meat markets of these countries and Ghana, require smooth and symmetric information among the countries involved in the trade.
Internation trade in meat is probably supported by the liberal Ghanaian economy and the fact that the word is considered as a global village as well as the removal of trade barriers by the WTO to enhance trade flow across countries and regions of the world. The adoption of liberal trade policies by most developing countries, especially Africa and Ghana, is to offer producers and importers price incentives while ensuring market integration through the forces and interactions of supply and demand (Amikuzuno, Citation2010).
The wide study of price transmission and spatial market integration is because it is mostly used to measure the performance of markets in most developed and developing nations (Ankamah-Yeboah, Citation2012). This is especially true given that spatial market integration attempts to measure the extent to which markets at geographically distant locations (such as between regions) share common long-run price or trade information on a homogenous product. This long-run relationship shared may be influenced by the fluctuation of other macroeconomic variables such as crude oil price and exchange rate in an importing country of these meat products. When studying market response, stakeholders may also have special interest about the nature of adjustment to equilibrium, such as whether the adjustment follows symmetric or asymmetric process. The presence of symmetric adjustment is an indication of market efficiency, whereas asymmetric processes are attributed to imperfect market conditions (Ben Kaabia et al., Citation2002). These imperfections may compel rational market participants to deviate from their desired risk due mainly to market power and the oligopolistic behaviour of a few market participants such as importers, adjustment/menu cost, policy intervention, and transaction cost, among others (Ben Kaabia et al., Citation2002). The resulting asymmetric price transmission may lead to welfare losses among market participants due to differential distributional effects under asymmetric conditions (Wlazlowski et al., Citation2009).
Given the importance of market integration and price transmission analysis in market performance and policy implications, information about them in any market is paramount to market participants, in particular, and governments, in general. Meanwhile, despite the rising importation of meat into the country in recent times (Adzitey, Citation2013), studies regarding the transmission and market integration of these products are still limited. Studies in animal and meat products in Ghana are mostly focused on production trends (Adzitey, Citation2013), determinants of meat consumption, and other areas without any focus on prices and price movements. Meanwhile, in other countries, price transmission and market integration analysis are common in meat products (see, e.g. Garcia et al., Citation2017; Huang et al., Citation2019; Amador et al., Citation2018; Tione & Mtimet, Citation2016, etc.), but price transmission information in the Ghanaian meat market is limited, thereby creating an information gap, especially at a time when Ghana’s meat import bill is rising. Ghana currently imports about 90% of livestock and livestock products consumption requirements due to insufficient livestock production, a growing population, expansion in the middle class, and, the growth and development of fast-food and hospitality sectors (Taylor, Citation2023). The influx of imports, including meat, is boosted by trade policies in Ghana, including the reduction of import tariffs, regional integration initiatives, and the promotion of Foreign Direct Investment (FDI), which has a significant role in promoting the importation of meat products into the country. These policies have not only met the growing demand for meat products but have also contributed to the development and expansion of the domestic meat markets. The policies have encouraged increased imports of meat products, meeting the growing demand for diverse protein sources in the country (Smith, Citation2020; World Bank, Citation2019). This development provides an indication of growing meat import markets in Ghana with trade flow between domestic and foreign markets for meat, including beef and mutton.
However, relative to crop markets, the area of meat market integration and price transmission, especially involving domestic and foreign markets, is understudied. Most price transmission analyses in the agriculture and/or food sectors of Ghana(e.g. Ihle & Amikuzuno, Citation2010; Amikuzuno & Donkoh, Citation2012; Blay, Citation2015; Minot, Citation2014; Acquah et al., etc.) focus on crop markets rather than meat markets and prices. Once more, there are limited studies that provide information on both foreign and domestic market prices (Amikuzuno & Donkoh, Citation2012; Minot, Citation2014), which leaves a dearth of information regarding how foreign prices (meat) influence domestic prices and how these markets are integrated. In fact, market integration and price transmission analysis of foreign and Ghanaian beef and mutton markets in light of the effect of crude oil price and exchange rate fluctuations remains an important yet understudied area of research. This study is, therefore, designed to examine the price transmission and market integration dynamics of the meat products (beef and mutton) markets across Ghana and its importing countries. The study seeks to answer questions such as:
What is the nature of market integration in the foreign (reference markets) and domestic beef and mutton markets?
Is there any spatial price transmission across the foreign (reference markets) and domestic beef and mutton markets?
What is the effect of fluctuations in crude oil prices and exchange rates on the transmission process?
In answering these questions, the study will test the following hypotheses:
H0:
Foreign and domestic beef and mutton markets are not cointegrated.
H1:
Foreign and domestic beef and mutton markets are cointegrated.
H0:
There is no spatial price transmission across domestic and foreign beef and mutton markets.
H1:
There is spatial price transmission across domestic and foreign beef and mutton markets.
H0:
The fluctuation of crude oil prices and the movement of exchange rate do not influence the price transmission process.
H1:
The fluctuation of crude oil prices and the movement of exchange rate influence the price transmission process.
The results of price transmission and market integration are of policy value in the sense that implementing stabilization policies in agricultural and food markets requires knowledge of the fact that price policy transmission across domestic and international markets may take considerable time, and therefore, adjustment periods may need to be relatively reasonable to make the policy very successful. Besides that, analysis of the performance of domestic and international markets over a time period may enhance possible government agricultural policy directions, e.g. promotion of the domestic meat industry to create employment, reduce poverty, and promote food security. Finally, the study will provide information to researchers who may find it relevant to their work and contribute to the growing body of literature on market integration and price transmission modelling.
In conclusion, the combination of a comparative analysis of foreign and Ghanaian beef and mutton markets, an examination of the impact of crude oil price and exchange rate fluctuations, and the consideration of a specific Ghanaian context enable this study to offer a novel contribution to the existing literature on market integration and price transmission in the meat sector.
2. Review of related literature
2.1. Trade policies in Ghana
Ghana’s foreign trade policies have evolved significantly since gaining independence in 1957. These policies have reflected shifts from import substitution to export-led growth, trade liberalization, regional integration, and economic diversification (Laryea & Akuoni, Citation2012). This section of the article, therefore, seeks to examine these trade policies and how they have affected the import–export interaction over the years.
After independence,the government of President Kwame Nkrumah adopted an import substitution industrialization (ISI) to ensure the reduction of dependency on foreign imports by encouraging domestic production of goods, particularly in the manufacturing sector. This resulted into the imposition of import tariffs and restrictions in order to protect the local industries (World Bank, Citation1962).
This policy, however, was short-lived after the overthrow of Nkrumah’s government in 1966, which subsequently led to a myriad of economic challenges, including inflation and balance of payments issues. The country experienced fluctuations in its import policies, including import controls and liberalization attempts (Aryeetey & Harrigan, Citation2000).
This economic downturn led to the initiation of structural adjustment programs (SAPs) in the 1980s, which was supported by international financial institutions. The aim of this program was to ensure stabilization of the economy and promotion of trade liberalization. During this era, import tariffs were reduced, non-tariff barriers were dismantled, and the exchange rate was devalued to attract foreign investment and improve the competitiveness of the Ghanaian economy (ayaraman, Citation1997; Laryea & Akuoni, Citation2012; Whitfield, Citation2011).
During the early 2000s, the country intensified its focus on regional integration and trade agreements, resulting in its subscription to the Economic Community of West African States (ECOWAS) and signatory to various regional trade agreements in order to facilitate cross-border trade. Efforts to harmonize trade policies within the West African region were given priority (Appiah-Kubi, Citation2012). Ghana also drafted a Trade Policy Instrument to provide guidelines for the implementation of the Government’s trade agenda. Under this policy, there was a declaration to the effect that the private sector should be seen as the engine for growth with the government bearing the responsibility for providing the enabling environment to ensure this growth. This will result in the achievement of the objectives of creating a fair and transparent import–export regime, facilitating trade, enhancing production capacity for domestic and export markets, consumer protection and fair trade, protection of intellectual property rights, and multilateral trade, among several others (Ghana Ministry of Trade and Industry [MoTI], Citation2020).
At the moment, Ghana’s import policies have been shaped by efforts to diversify the economy. The government has promoted sectors such as agriculture, manufacturing, and services while imposing import regulations on some commodities to protect domestic industries. These policies have been influenced by shifts from import substitution to trade liberalization, regional integration, and diversification efforts (Ghana Ministry of Trade and Industry [MoTI], Citation2020). This has resulted in liberal bilateral and multilateral trade engagements with foreign countries through importation of products that include animals and high-value animal products such as meat (beef and mutton) into the country to supplement domestic supply.
2.2. Meat importation trend in Ghana
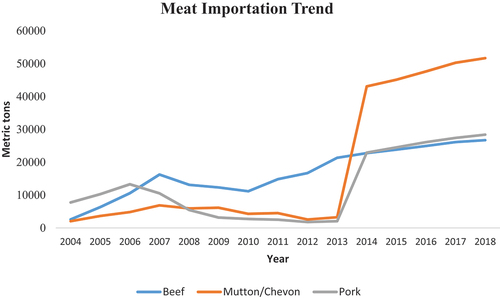
The graphs in Figure indicate a fluctuating trend in imports of beef, mutton, and pork where there was a sharp rise in the three categories from 2013 with a somewhat steady rise through to 2018 (MoFA, Citation2019). This continuous rise in volumes of imports suggests that the country has a low level of self-sufficiency in animal-derived protein that risks its ability to meet the SDG goal of eliminating malnutrition by 2030 if imports do not supplement domestic supply (MoFA, Citation2019; Vasileska & Rechkoska, Citation2012). This level of meat self-insufficiency may either be attributed to Ghana’s traditional animal production systems and its characteristic low production levels or the underlining change in demand for these products in urban areas, which cannot be met by current national production (MoFA, Citation2019). Figure presents the import volumes of meat of the major three meat types imported into the country after chicken.
Figure 1. Trend of meat importation in Ghana (source: ceicdata.com/MoFA).
2.3. The importance of exchange rate and crude oil prices in the price transmission process
Meat products and other agricultural products from foreign origin are imported in foreign currencies, especially in dollars, and rising exchange rates indicate increased prices of these meat and agricultural imports (Adom, Citation2014). Because of this, studies such as Liefert and Persaud (Citation2009) testified to the importance of exchange rate in agricultural markets, where it was regarded as a determinant of the quantity and quality of agricultural production and importation. In the case of the importation of agricultural products such as meat, spillover is greater for the importing country where the domestic currency is pegged to the currency of the source country. The exchange rate dynamics can directly influence price transmission because domestic currency has to be converted to international currency to purchase imports, or indirectly by affecting fiscal shock transmission (Díaz-Bonilla, Citation2019). A study by Mutuc et al. (Citation2011) re-echoed the significance of the instability of the exchange rate on food commodity prices in the US when they reported in their study that the depreciation of the US dollar against the Chinese RMB influenced higher exports of agricultural commodities to China.
The effect of crude oil prices on price movement cannot also be underestimated. Apart from transportation cost, the nature of crude oil instability has a bearing on production cost, especially with regard to shipment from imported sources. As a result, any fluctuation in crude oil prices is likely to influence price movement and inform escalating volatility in agriculture, food, and meat prices. This is confirmed in the study of Huchet-Bourdon and Korinek (Citation2011) (), who indicated that there is a strong correlation between crude oil prices and price movement of agricultural products.
2.4. Empirical evidence of market integration and price transmission
Several researchers have applied econometric time series models to study market integration and price transmission to understand the behaviour of agriculture and/or food markets. This section provides a review of some of these empirical analyses in Ghana and other parts of the world.
Market integration studies in Ghana span from the adoption of the most basic market integration models such as the Ravallion model (e.g. Alderman, Citation1992; Quaye & Ameleke, Citation2009). In the study of Alderman (Citation1992), where the Ravallion model was applied to study cereal markets in Ghana, there was evidence of price transmission between the major cereal that is mostly consumed in Ghana (maize) and other grains, as well as between other regions where the markets were integrated. He concluded that the results of the dynamic model reveal a functional if not perfect efficiency, in the coarse grain markets of Ghana.
Quaye & Ameleke (Citation2009) applied a modified version of Ravallion and the error correction models to study the integration of sorghum markets in Ghana. Their results reveal a lack of integration in about 75% of sorghum market pairs they studied in the short-run. Adjustment process was slow between the reference and local markets even though there was integration in the long-run.
Similarly, Abdulai (Citation2000) studied maize markets in Ghana with the threshold cointegration approach to examine the asymmetries in price adjustment towards equilibrium among maize markets in Ghana. His findings concluded that there is an integration in the major maize markets in Ghana. It was revealed in that study that there is both threshold cointegration and an asymmetric error correction process between the wholesale prices of the Accra–Bolgatanga market pair.
There was also evidence of market integration in five markets when Ihle and Amikuzuno (Citation2010) employed a regime-dependent vector error correction model to study the Ghanaian fresh tomato markets. The findings from their research indicate that there is a swift adjustment mechanism out of balance between regions with net tomato production (such as Navrongo) and Techiman, compared to most consumption areas, where there is no substantial error correction observed during periods of imbalance.
In a border-related study, Amikuzuno and Donkoh (Citation2012) adopted a regime-switching vector error correction model to study the spatial price transmission dynamics of fresh tomato markets in Ghana and Burkina Faso. The outcome of their study establishes evidence of border and distance effects in the transmission dynamics of prices of fresh tomato between Ghana and Burkina Faso. They attributed this to high transfer costs emanating from cross-border tariffs, as well as perishability of tomato, which makes it risky and hence imposing additional cost to the arbitrageurs.
Acquah et al. () utilized the Johansen cointegration, Granger Causality test, and autoregressive distributed lag model to examine the price transmission dynamics of selected agricultural markets in Ghana using cassava as a case. The results of their study revealed that despite that the price series of cassava from the selected markets were integrated at 1(I), there was no evidence of any cointegration and Granger causality between cassava prices of the selected markets.
Blay (Citation2015) adopted the Johansen’s cointegration approach and the momentum threshold autoregressive models and their extensions, as well as the threshold vector error correction models, to study spatial price transmission in yam, sorghum, and millet markets in Ghana. The result indicates evidence of cointegration and asymmetric adjustment process between most of the market pairs. He concluded that yam markets exhibit the presence of discrete thresholds that lead to non-linear adjustment process.
Elsewhere, Minot (Citation2014) studied the nature of the influence of changes in world food markets on staple foodstuffs in Sub-Saharan African countries using 11 selected Sub-Saharan African countries including Ghana. He adopted the error correction model for the estimation of the nature and extent of foreign food price transmission to domestic food markets of the selected countries. His results showed that very few price series (13 out of 62) demonstrated a long-term relationship with the world food prices.
In meat-related studies, Zoltán Bakucs and Fertő (Citation2006) analysed price asymmetry and structural changes of the Hungarian beef market chain using the Gregory and Hansen procedure and reported that homogeneity was rejected, indicating a mark-up price strategy in the Hungarian beef marketing chain with the markets exhibiting both short-run and long-run symmetric price adjustment processes.
Vavra and Goodwin (Citation2005) also applied the asymmetric price transmission mechanism to study the price transmission process of the retail, wholesale, and farm-level prices of the US beef, chicken, and egg markets with the threshold error correction model. They reported that most of the markets responded significantly and asymmetrically to both positive and negative shocks.
Ogundeji and Maré (Citation2020) applied the threshold autoregressive (TAR), momentum threshold autoregressive (MTAR), and momentum consistent TAR models to assess the price transmission mechanisms of the beef market in South Africa. They reported that price transmission between the producer and retail markets followed an asymmetric process where retailers gave quicker response to deviations that squeezed market margins than to those that tended to stretch the margins.
3. Study area and methodology
3.1. Study areas
This study explored the average price series of two meat products (beef and mutton) sold at retail markets in five different countries across the world. Ghana imported larger shares of meat products from South Africa, Argentina, Belgium, and New Zealand in 2019. For instance, in 2019, Belgium and New Zealand were among the top importing countries of meat of ovine (sheep meat) to Ghana, with a share of about 22% and 11.9%, respectively. Aside from the higher volumes of imported meat products from these countries, the availability of price data was also a strong consideration for their inclusion in the analysis of market integration and price transmission dynamics across foreign and domestic meat markets of Ghana. The economic and meat production trend of these countries are outlined below.
Ghana’s total meat production increased substantially from 79,589 tonnes in 1970 to about 298,559 tonnes in 2019 with a maximum rate of growth of 11.7% in 1977 to a record low of 2.5% in 2019 (https://knoema.com). This made the country meat self-insufficient and forced it to resort to importation to meet domestic demand. Unlike Ghana, South Africa is a net exporter of livestock products such as beef since 2016, and currently, the gross turnover of the cattle industry at the producer level is estimated at R44,000,000,000 per annum (Overview of the South African; How Are South African, Citation2019). In Argentina, about 60% of exports comprise agriculture and food products, and it engages about 7% of the labour force directly (Shik et al., Citation2019). Beef production in the country was estimated at 3 million metric tonnes carcass weight with exports projected to reach a record high of 575,000 tons carcass weight equivalent due to competitive pricing in the beef market (Joseph, Citation2018).
Beef production in New Zealand in 2019 was estimated at 672,000 MT with total exports estimated to reach 604,000 MT, representing 2.4% higher than an initial forecast value (Lee-Jones, Citation2019). The economy of Belgium experienced slow GDP growth in 2018, where there was a drop of the rate of GDP growth from 2% in 2017 to about 1.5% in 2018 due to the negative contribution of net exports (OECD Economic Surveys, 2020). However, the meat industry of the country continues to thrive in the midst of low economic growth. For the past decade, Belgium has continued to export pork and beef to meet the pork and beef needs of people in more than 60 countries worldwide (Facts & figures, Citation2018).
3.2. Data source, collection, and processing
Secondary data were used for this study. Average monthly data on retail prices of meat (beef and mutton) of five countries were used for the study.
In Ghana, prices of beef and mutton were obtained as national average figures from the Statistics, Research and Information Directorate (SRID) of the Ministry of Food and Agriculture (MoFA). The data were provided in Ghana cedi per kilogram and converted to dollar/kg. Average monthly beef price data of Argentina and South Africa were obtained from the website of the FPMA tool of the Food and Agricultural Organization (FAO, Citation2011). The prices were obtained as average dollar value of a kilogram of beef in the retail markets of these countries. Monthly average price of meat of sheep in Belgium was obtained from the EU market prices for representative products. Prices of mutton in New Zealand were downloaded from the website of the FPMA tool of the Food and Agricultural Organization (FAO, Citation2011). Data on exchange rate and crude oil prices of Ghana were obtained from Bank of Ghana Data/Statista and FAOSTATS.
The data analysis process followed a systematic order as conventional with time series analysis. The univariate properties of the series were assessed using four popular approaches (ADF, PP, KPSS, and ZA). Due to the possibility of structural breaks in agricultural data, the structural unit roots in the data were examined for any possible breaks. Performing all these tests together was to provide robustness towards the determination of unit roots in the series.
3.3. Theoretical framework
3.3.1. Cointegration analysis of price series
This study used the Johansen’s cointegration approach to conduct cointegration analysis of the meat price series across the selected countries. This was done to ascertain whether there exists a common long-run stochastic dynamic process among price of the beef and mutton markets of these countries under study.
In the approach of Johansen, two different likelihood ratio tests have been proposed for testing to determine the number of cointegrating vectors. This includes the trace test and maximum eigenvalue test. The two types of tests are specified in Equationequations (1)(1)
(1) and (Equation2
(2)
(2) ) following Johansen and Juselius (Citation1990).
In the above equation, N denotes the sample size, is the maximum eigen value. The trace test investigates the null hypothesis of r cointegrating vectors contrary to the alternative hypothesis of n cointegrating vectors. On the other hand, a null hypothesis of r cointegrating vectors against an alternative hypothesis of r + 1 cointegrating vectors is tested under the maximum eigenvalue test (Hjalmarsson & Osterholm, Citation2007; Johansen & Juselius, Citation1990).
Due to the low power of Engle–Granger testing criteria, Enders and Siklos (Citation2001) proposed an extension of this approach to permit asymmetry in the adjustment towards equilibrium. This study, therefore, employed this approach following vast literature of the wide application of threshold models in the study of adjustment of time series variables. The adoption of the Enders and Siklos (Citation2001) test is to determine whether the data-generating process follows a non-linear function of the lagged prices of meat across the selected markets rather than the cointegration approaches that assume symmetric or linear process of the series (Harvey & Leybourne, Citation2007). This is especially true where taking differentials cannot restore the data to stationarity to enable us to analyse it as a linear, stationary combination of the price series (Listorti & Esposti, Citation2012). The model of Enders and Siklos (Citation2001) allows for the speed of adjustment to differ based on the value of the error correction term (ECT).
The general specification of the Threshold Autoregressive (TAR) model and its extension, the ‘’momentum’’ TAR (M-TAR) with an asymmetric adjustment process, is given below following the proposal of Enders and Siklos (Citation2001):
where represents the Heaviside indicator function defined as follows:
From above, denotes the value of the threshold which has constant variance, identically and independently distributed (
at zero mean such that
is independent of
,
. If the speed of adjustment coefficients,
, then the adjustment process is symmetric which becomes a special case of the Engle and Granger (Citation1987) equation,
. The inclusion of the lagged dependent variable was to ensure that residuals were white noise and the AIC and BIC criteria were used to select the lag lengths for estimation (Blay, Citation2015). With a convergence of the system,
becomes the value of the long-run equilibrium of the sequence.
In this case, adjustment is if
is more than its long-run equilibrium value and
if the value of
is less than its long-run equilibrium value (Blay, Citation2015). For example, the negative phase of the price series will tend to be more persistent than the positive phase if
. Besides, if the Heaviside indicator is dependent on the value of
in Equationequation (4)
(4)
(4) , then the equation becomes a Threshold autoregressive (TAR) model. However, equation (4) is referred to as Momentum-threshold autoregressive (M-TAR) model if the Heaviside indicator is dependent on the change
in previous period of
, i.e. Momentum Heaviside Indicator (Uysal, Citation2012). It is called ‘’momentum TAR’’ because the series shows high ‘’momentum’’ in one direction than the other. The M-TAR model will show little adjustment for positive but a considerable decay for negative in an M-TAR of
where increases tend to persist and decreases tend to swiftly revert to the attractor despite where disequilibrium is located relative to the attractor (Deb et al., Citation2020). The TAR model is designed to capture deep movements that are asymmetric and sequential in the series, whereas the MTAR representation is for the capture of sharp or steep movements asymmetrically (Enders & Granger, Citation1998). The alternative selection between TAR and M-TAR models is by using popular model selection criteria such as AIC and BIC where the model with the least AIC and BIC is chosen.
The threshold models test the null hypothesis that , implying no threshold cointegration. This hypothesis is tested by using the t-statistic as proposed by Enders and Siklos (Citation2001). If the null hypothesis of lack of threshold cointegration is rejected, then a standard F-test of symmetric adjustment can be tested with the hypothesis
. However, if both null hypotheses are rejected, the implication is that threshold cointegration and asymmetric adjustment process is present which means the pairs of price series follow a nonlinear adjustment pattern (Deb et al., Citation2020).
In both cases of the threshold models, the optimal threshold value , which minimises the residuals sums of squares, was estimated with the approach of Chan (Citation1993). This method adopts a grid search over potential thresholds to minimize the sum of square residuals from the fitted regression model to yield consistent threshold estimates. Therefore, the residuals that were estimated were ranked in ascending order,
for the TAR model and
for the M-TAR model, where T represents the total number of observations used in the estimation. In this study, the first and last 15% of the values were truncated, and the remaining 70% of the series considered as potential thresholds for estimation (Uysal, Citation2012; Blay, Citation2015; Deb et al., Citation2020).
3.3.2. Transmission dynamics of price linkages
Economic data will normally follow linear or nonlinear pattern due to the random behaviour of human. This, therefore, prompts the need to test for whether co-movement of time series variables is linear or non-linear before attempting to model the transmission dynamics of these variables. Following the data generating process (DGP) from a momentum cointegration test, evidence of the presence of significant threshold is further obtained through Hansen and Seo (Citation2002) (HS) testing framework.
From the theorem of Engle and Granger (1987), an error correction specification is the most efficient representation of the transmission process if the two series are cointegrated. Therefore, the long-run or equilibrium properties of the system, the short-run disequilibrium properties, and the nature of adjustment to equilibrium after a shock are best represented by the error correction model (ECM) specification (Vavra & Goodwin, Citation2005). Hence, in this study, based on the outcome of the results of linearity in the Hansen and Seo (Citation2002) test, the null hypothesis of linear threshold effect was rejected in only one market pair, and a two-regime threshold vector error correction models (TVECM) was estimated (Blay, Citation2015).
To specify the empirical (VEC) model of this study, consider a long-term relationship of two variables given as (5).
If the variable Z1t is at the equilibrium point of Z2t, then an equilibrium point of Z1t and Z2t is satisfactorily established in Equationequation (5)(5)
(5) . However, due to the highly stochastic nature of economic variables, it is rare for equilibrium to be met. In the absence of equilibrium in Z1t, the left and right sides of equation (5) becomes
where ECT is referred to as disequilibrium error or the error correction term. Based on evidence of significant thresholds, the threshold error correction model (TVEM) is specified in equation (7) as follows:
Where and
are matrix coefficients in both regime 1 and regime 2, respectively, and
represents the threshold parameter. If the matrix coefficient is
=
, then there is no significant threshold in the series (Putra & Sohibien, Citation2017). The specification in equation (7) can then be rewritten as follows:
where and
such that I is an indicator function.
The two regimes allow for the characterization of trading environment in which trade between the spatially separated markets occurs when relative price differences exceed some level of transaction costs (Blay, Citation2015).
The decision rule is when deviations are below the threshold value (
), the price transmission process is defined by regime 1, and when deviations surpass the threshold value, the price transmission process is defined by regime 2 (Amikuzuno & Donkoh, Citation2012; Blay, Citation2015; Vavra & Goodwin, Citation2005).
However, if the null hypothesis is not rejected, then transmission follows the standard linear VEC Model, and with the incorporation of the exogenous variables, the model is specified as follows:
where and
added in the linear VEC are a measure of mean spillover effects of the exogenous shocks
(the exchange rates and Crude oil prices) in the transmission process of meat prices of each market pair. However, since beef and mutton trade flow are unidirectional and for that matter, the exogenous variables are macroeconomic variables of Ghana, the focus is on their impact on price transmission dynamics in Ghana for each of the meat markets under study.
The representation of the error correction (VEC) model provides an indication of market efficiency through price arbitrage by throwing more light on the adjustment process of short-run and long-run dynamics during price change (Abunyuwah, Citation2007). The VEC model, however, disregard the regime difference during the estimation process of price dynamics (Amikuzuno & Donkoh, Citation2012).
The application of cointegration and error correction models make it possible to further examine notions of completeness, speed and asymmetry of price relationships, and direction of causality between two markets (Blay, Citation2015). The Akaike Information Criterion (AIC) or Bayesian Information Criterion (BIC) is used to determine the number of lags to be included into estimating error correction model (ECM).
4. Results
4.1. Descriptive statistics of beef and mutton prices as well as macroeconomic variables
A critical examination of the time series plots reveals that they are non-stationary at levels. With reference to the graphs in Figure , the beef price of South Africa fluctuates more than beef prices of Argentina and Ghana. Beef price fluctuations in Argentina is higher relative to Ghana between 2016 and 2018 but lower than Ghana from 2019 to 2020. Figure also reveals a similar trend of mutton price fluctuation among the three countries trading in mutton. Figure provides the trend of the crude oil prices and the exchange rate included in the study. This graphical inspection of the meat price series and exogenous variables implied that formal statistical test needs to be applied to further examine the nature of stationarity of the series. The popular ADF, PP, and KPSS tests were used for testing the nature of stationarity of the series.
Figure 2. Trend plot of monthly prices of beef in Ghana, Argentina, and South Africa.
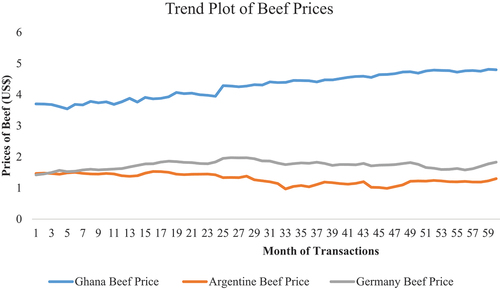
Figure 3. Trend plot of monthly prices of mutton in Ghana, Belgium, and New Zealand.
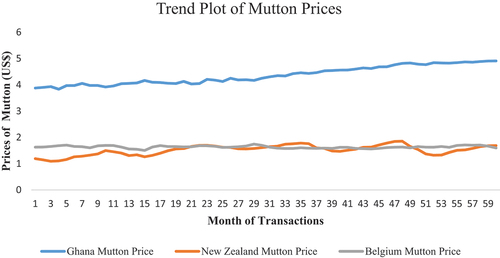
Figure 4. Trend of crude oil prices and exchange rate in Ghana.
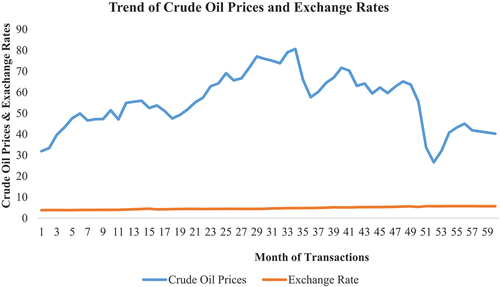
Table presents the average nominal prices of the two categories of meat (beef and mutton) across the selected countries. From Table 4.1, the average price of beef in dollar—equivalent in Ghana, from 2016 to 2020 is $5.510/kg, whereas in Argentina and South Africa, the average prices of the same meat product are $3.67/kg and $5.69/kg, respectively. In terms of the mutton prices, the three markets recorded $5.494/kg, $5.13/kg, and $4.60/kg for Ghana, Belgium, and New Zealand, respectively. The values of the Jarque Bera statistics indicate that beef price of Argentina and exchange rate of Ghana are all not normally distributed. This has also been evident in the values of skewness and kurtosis of these series.
Table 1. Descriptive statistics of data series
4.2. Test for unit root and structural breaks
Before the cointegration analysis was conducted, there was a need to test for the presence of unit root in the data. The augmented Dickey–Fuller (ADF), Phillip–Peron (PP), and Kwiatkowski–Phillips–Schmidt–Shin (KPSS) tests were used for testing the presence of unit roots in the data set. In the case of structural break, the Zivot–Andrew test was employed. The null hypothesis of the augmented Dickey–Fuller (ADF) and Phillip–Peron (PP) tests assume non-stationary or absence of unit root in the series, whereas the Kwiatkowski–Phillips–Schmidt–Shin (KPSS) test has stationarity assumption in the null hypothesis. The results of the unit root test presented in Table suggest that at level, the null hypothesis (Ho: ρ = 0) could not be rejected at 1% level of significance in both ADF and PP tests for all the price series of the data. However, at first difference, the null hypothesis of the presence of unit root (ρ = 0) could be rejected at the same level (0.01) of probability. This means that after taking first difference of the level data, the series became stationary [I(1)]. The results of the KPSS test further confirm non-stationarity when the null hypothesis of stationarity was rejected with 95% confidence level in all series of the data. It was, however, not possible to reject the null hypothesis of stationarity after taking first difference of the data. The results of the unit root test of the series are presented in Table .
Table 2. ADF, PP, and KPSS unit root test results
The results of the Zivot–Andrew test of structural breaks are also presented in Table . This test has a null hypothesis of the presence of unit roots with drift without exogenous structural change against the alternative hypothesis of trend stationarity process in the data that allow for a one-time break in the level, the trend, or both of them. In this research, I propose the presents of a single breakpoint in the intercept, trend, or both, denoted as 't-Min,' representing the minimum ADF test statistic, along with the corresponding potential break date enclosed in parentheses. The results in Table reveal a rejection of the null hypothesis at the intercept, trend, and both in beef price series of Ghana with the potential break dates in parenthesis (Table ). Similarly, there was significant breaks in intercept, trend, and both in all price series of mutton from the three markets under study at various break dates as seen in Table . However, the null hypothesis could not be rejected at any conventional significant levels for beef prices in Argentina and South Africa and the exogenous variables (exchange rate and crude oil price). The results are presented in Table .
Table 3. Zivot–Andrews unit root test under single break point
5. Cointegration analysis
5.1. Johansen cointegration test
The Johansen cointegration test, which has higher power of testing for long-run equilibrium among pairs of series, was used to analyse cointegration of meat markets in this study. When two non-stationary variables deviate from equilibrium conditions, the linear combination of these variables are expected to be stationarity, and this forms the bases for the test of integration of spatially separated markets (Blay, Citation2015). This gives an indication that prices may fluctuate extensively, but their pair is not expected to diverge from one another in the long run (Abdulai, Citation2007). The cointegration test framework of the Johansen uses both eigen value and trace statistic for testing the spatial integration of two series based on their maximum cointegrating ranks (r). The tests that have been specified in equations (1) and (2) were estimated to determine market pairs that are cointegrated. Table presents the results of the Johansen test conducted in this study. A bivariate cointegration was adopted with each of the foreign markets used as the reference market (RM). So, the price of meat in each country was taken as an independent variable and the domestic market as a dependent variable. The same approach was adopted to analyse the effect of the exogenous variables (crude oil price and exchange rate) in the cointegration process.
Table 4. Johansen cointegration analysis
From Table , it is evident that the null hypothesis of no cointegration (r = 0) between these market pairs could be rejected in both Trace and Max-Eigen statistics at 10%, 5%, and 1% levels of significance. However, there was no enough statistical evidence in the test statistics to reject the null hypothesis of one or fewer cointegrating vectors between foreign meat markets and domestic market pairs at r > 1. The results, therefore, reveal that a stationary series results from the linear combination of foreign and domestic meat markets, thereby leading to cointegration of prices in the selected markets.
Similarly, the results also reveal that the exogenous variables (Crude Oil prices and Exchange rates) show evidence that the study could reject the null hypothesis of no cointegration (r = 0) between the meat prices and these variables at conventional levels of probability, although the study lacked enough power to reject the null hypothesis of no cointegration between the pair of series in both Trace and Max-Eigen statistics at r > 1.
As a form of model validation, the normality test of Shapiro–Wilk and the Autoregressive Conditional Heteroskedasticity (ARCH) test for heteroskedasticity were performed on the residuals of the cointegration models of the meat products for the various market pairs. To perform these tests, the cointegration models were estimated with the ca. jo function in Rstudio, transformed into a vector autoregressive (VAR) model, and residuals were extracted for the tests to be conducted. The results are summarized in Table .
Based on the Shapiro–Wilk normality test (Shapiro & Wilk, Citation1965), the residuals of the cointegration test are generally normally distributed for almost all meat markets except Exchange Rate-Ghana with Beef as the meat product where there is evidence of departures from normality in the market pair. However, the p-value of the Exchange Rate-Ghana—Beef pair was not highly significant hence it was deemed not to have any serious effect on the model.
Again, based on the ARCH values of the cointegration residuals presented in Table , all the market pairs showed evidence of homoskedasticity with p-values higher than the conventional threshold values of 0.05 or 0.1 needed to reject the hypothesis of homoskedasticity. This observation provided an indication that the variances of the cointegration residuals are relatively constant, hence the other models could be estimated. The Johansen cointegration test results are presented in Table .
5.2.1. Results of threshold cointegration models
To analyse the possibility of the presence of threshold effects in the cointegrating vectors, the TAR model and its extensions (MTAR, CTAR, and CMTAR) were fitted, and model selection criteria (AIC and SBIC) were used to select the most appropriate model for threshold cointegration analysis.
The results of the CTAR and CMTAR models are presented in Table . The results of the consistent TAR and M-TAR specifications provide evidence of rejection of the null hypotheses of no cointegration (ρ1 = ρ2 = 0) and no asymmetric adjustment effects (ρ1 = ρ2) in most of the beef and mutton market pairs. I discuss the hypotheses in the two consistent TAR and M-TAR models before looking at the coefficients. The results of these models in Table inform us that the null hypothesis of no cointegration (ρ1 = ρ2 = 0) and the null hypothesis of no asymmetric effects (ρ1 = ρ2) of beef market pair of Argentina (reference market or independent market) and Ghana (destination or dependent market) in the CTAR model was rejected at 5% and 10% significant levels, respectively. Similarly, both of these hypotheses (ρ1 = ρ2 = 0 and ρ1 = ρ2) of the same market pair was rejected at 1% level of significance, respectively, in the CMTAR model, indicating evidence of cointegration and asymmetry effects. In the same beef product market pair of South Africa (reference market or independent market) and Ghana (destination or dependent market), only the null hypothesis (ρ1 = ρ2 = 0), in each of CTAR and CMTAR, was rejected at 5% level of significance, respectively, although none of the models was able to reject the null hypothesis of no asymmetric effects (ρ1 = ρ2).
Table 5. Results of consistent TAR and M-TAR model specification ()
The results also reveal that the null hypothesis of linear cointegration (ρ1 = ρ2 = 0) of the mutton market pair of Belgium (reference market or independent market) and Ghana (destination or dependent market) in the CTAR model was rejected at 1% level of significance, but the null hypothesis of no asymmetry (ρ1 = ρ2) could not be rejected. In the same mutton pair, the application of the CMTAR model reveals a rejection of both hypotheses, (ρ1 = ρ2 = 0) and (ρ1 = ρ2) at 0.01 probability level. Again, a similar trend was observed in mutton market pair of New Zealand (reference market or independent market) and Ghana (destination or dependent market). The results of the CTAR model rejected the hypothesis of no cointegration (ρ1 = ρ2 = 0) at 5% level of significance but failed to reject the null hypothesis of linear cointegration among the mutton market pair. In contrast, the results of the CMTAR model rejected both hypotheses, (ρ1 = ρ2 = 0) and (ρ1 = ρ2) at 1% level of significance.
After fitting the different variants of the TAR models, the question now is which model best fit the data in this study? Following the suggestions of Enders & Granger (Citation1998) and Enders and Siklos (Citation2001), the Akaike information criterion (AIC) and Schwarz Bayesian criterion (SBC) tests were used to select the best fit model for any meat market pair in this study. Using these criteria, the model with smaller values of AIC and SBC becomes the appropriate model for the data. The consistent M-TAR models in most of the market pairs proved appropriate as they have smaller values of AIC and SBC. This is consistent with other studies in threshold cointegration analysis of agriculture and food markets (Abdulai, Citation2000; Blay, Citation2015; Ogundeji & Maré, Citation2020).
Based on this, the rest of the discussion on the threshold models will be centred on consistent M-TAR model specification. From the results of the Consistent M-TAR (Table ), there was evidence of cointegration in all market pairs. The beef market pair of Argentina (reference market or independent market) and Ghana (destination or dependent market) exhibited long-run asymmetric adjustment process with the estimated coefficients of ρ1 = 0.204 and ρ2 = −0.293, and this implies that prices are adjusting towards long-run equilibrium. The positive value of ρ1 (0.204) indicates that there is no long-run convergence in the beef market pair of Argentina and Ghana.
The Consistent M-TAR model results in Table also reveal that the estimated coefficients of ρ1 and ρ2 in the mutton market pair of Belgium (reference market or independent market) and Ghana (destination or dependent market) are statistically significant at 1% probability level. The point estimates of ρ1 = −0.283 and ρ2 = −0.913 have correct and expected signs which go to suggest that there is long-run convergence in the mutton market of this pair. The estimates (– 0.283 and −0.913) mean that about 28.3% of positive deviations and 91.3% of negative deviations from the disequilibrium are removed from this market pair within 1 month. Since the value of ρ2 is greater than ρ1, the adjustment process follows higher speed of adjustment towards equilibrium when the price difference (spread) deviates above equilibrium. This means that increases are persistent and return back to the attractor more rapidly but decreases return slowly to the long-run equilibrium. This is obvious because if the reference market (Belgium) increases its price, it takes shorter time for the destination market (Ghana) to increase its prices, but when there are decreases, it takes longer time for the market to reduce its prices. The restoration of equilibrium of two asymmetrically cointegrated spatial markets largely depends on the nature of shocks in the transmission process. The rate of elimination of deviation in order for the two markets to be in new equilibrium will depend on whether the shocks follow positive or negative direction. For instance, if shock was a positive one, then about 28.3% of the positive deviations and 91.3% of negative deviations will be removed from the mutton market pair of Belgium (reference market or independent market) and Ghana (dependent market) in order to restore equilibrium. This means that about 71.7% of positive and 8.7% of negative deviations from the equilibrium will continue to persist in the mutton market of this pair for the following month, all things being equal.
The findings in this study follow similar trend of transmission process that has been reported in studies of Abdulai (Citation2000), Ihle and Amikuzuno (Citation2010), Amikuzuno and Donkoh (Citation2012), Blay (Citation2015), Zoltán Bakucs and Fertő (Citation2006) and Ogundeji and Maré (Citation2020) who all reported evidence of asymmetric price transmission processes in their respective studies of agricultural-related products markets.
The Consistent M-TAR results in Table again reveal that the point estimate of ρ1 = −0.160 was significant at 1% level of significance, whereas ρ2 = −0.062 was not statistically significant in the mutton market pair of New Zealand (reference market or independent market) and Ghana (destination or dependent market). With reference to the statistical significance of ρ1 and ρ2 in the mutton market pair of Belgium–Ghana, there is evidence to suggest that this market respond quickly to shocks that squeeze profit margins than shocks that stretch these profit margins. This implies that prices of mutton in Ghana respond faster to deviations from the long-run equilibrium that comes from negative foreign price shocks. This may be due to the fact that most of the average prices of mutton is likely obtained from large supermarkets in city centres of Ghana. It also suffices to say that meat importers may form associations or groups, which might give them more market power to control price and volume of meat traded at a particular period. The results imply that the mutton markets of the exporting market or reference market (New Zealand) and the destination market (Ghana) have long-run relationship with threshold effects that lead to price differences that may be above the transaction cost. These results corroborate with similar findings of studies such as Ogundeji and Maré (Citation2020) and Vavra and Goodwin (Citation2005) who all reported that price transmission between the producer and retail meat markets followed asymmetric process in their studies. The results of the consistent TAR and M-TAR models are presented in Table .
5.3. Price transmission analysis
5.3.1. Asymmetric Vector Error Correction Model (VCEM) of mutton markets
The error correction term for each pair of export and import market for mutton (ECT-1) is defined to be the difference between the respective prices of the pair (Enders & Granger, Citation1998). From the results of the VECM model of mutton market pairs, the estimated coefficients of the error correction term for mutton price of Belgium (reference market) include 0.0185 and −0.0336 for positive and negative deviations, respectively. Although the positive deviation () is not significant and does not have a correct sign, the negative deviation (
have the correct sign and is statistically significant at 10% probability level. Because Belgium is an exporting country to Ghana (destination or dependent Market), mutton prices of Ghana may not have an effect on the price of Belgium. However, the Belgium mutton market responds significantly (1%) to a lag effect at lag one of its own prices. In fact, a 1% change in the lagged price of mutton in Belgium leads to about 41% price increase in the current price of mutton ceteris paribus. However, it did not respond significantly to the second lag of own price. In fact, this result implies that current mutton price of Belgium depends on its previous price.
The estimated coefficients of the positive and negative deviations of mutton market in Ghana were 0.0796 and −0.1208, respectively. The positive deviation is not significant, whereas the negative deviation is statistically significant at 5% level of significance. This implies that the mutton market in Ghana (the dependent or response market) adjusts so as to eliminate about 12.08% of negative change in deviations created by the Belgian mutton market (reference or independent market). Contrary to aprior expectation, all lagged values of mutton price of Belgium and Ghana, as well as the exogenous variables, did not have any significant impact on the mutton price transmission process in Ghana. This observation probably indicates that the current price of mutton does not depend on previous prices of the exporting country, Belgium which serves as the reference market, and previous values of its own price, as well as the exchange rate and crude oil prices.
In the mutton market pair of New Zealand and Ghana, the estimated coefficients of positive and negative deviations for New Zealand mutton price are 0.04370 and 0.01292, respectively, without the correct signs and also statistically insignificant. The point estimates for these parameters () are 0.08632 and −0.12773 with only the negative deviation having the correct sign, but none of them is statistically significant at any conventional level for the Ghanaian mutton market. This provides an indication that there may be some different speed of response of the mutton market in Ghana to positive and negative deviations but not substantial enough to changes in the mutton market of New Zealand (reference market). However, the lagged prices of mutton in New Zealand (lags one and two) significantly (10%) affected the current mutton prices of Ghana. A percentage (1%) increased in these lagged prices culminated into about 48% and 53% increase in mutton prices, respectively, ceteris paribus. This likely decreases market margins by about 52% and 47%, respectively, holding other factors constant. The reason for the lag effect of foreign reference prices affecting the domestic prices is probably as a result of the large transaction cost that comes with importation especially through previous clearing expenditure at the ports. This may lead to price increase that may not be as a result of the prices of the current stock but from previous periods.
Again, the inclusion of the exogenous variables did not significantly affect the price transmission dynamics of mutton prices in Ghana. This means that these variables do not play any significant role in price movement in Ghana within the period of this study. This is rather contrary to other studies that have reported significant influence of exchange rate and crude oil prices (e.g. Díaz-Bonilla, Citation2019; Huchet-Bourdon, Citation2011; Liefert & Persaud, Citation2009; Mutuc et al., Citation2011).
With reference to the test hypothesis in Table , the null hypothesis of cumulative symmetry effects of negative deviation was rejected at 10% significant level for mutton market in New Zealand. The results of mutton price transmission are presented in Table .
Table 6. Results of asymmetric vector error correction model (VCEM) of mutton markets
5.3.2. Asymmetric Vector Error Correction Models (VCEM) of beef markets
From the results of the HS test of significant asymmetric effects in the threshold error correction model of the beef market pair, it was revealed that the beef market pair of South Africa and Ghana exhibits significant threshold (asymmetric) effect and hence has to be analysed with a two-regime TVECM. Table , therefore, presents results of VECM model of Argentina and Ghana beef market pair, while the TVECM is used to model the transmission dynamics of the South Africa–Ghana beef market pair.
Reference to Table , the point estimates of positive deviation () and negative deviation (
are 0.0389 and − 0.0898, respectively, in the Argentine beef market. The estimate of the negative deviation (
is significant at 10% level of significance with a correct sign. Similarly, the point estimate of positive deviation (0.00560) of the Ghana beef market has incorrect sign and is statistically insignificant. However, the negative deviation (
has a point estimate of −0.15642, with a correct sign and statistically significant at 10% level of significance. The implication is that the Ghanaian beef market (dependent or destination market) adjusts to eliminate about 15.64% of changes in negative deviations caused by the Argentine beef market (reference or independent market).
The Ghanaian beef market was affected by lag one and lag two of its own price. This means that a percentage change in the first lag value of own price significantly (5%) increases current price of beef in Ghana by 32.9% ceteris paribus. In the same way, a 1% increase in the second lag value of beef own price leads to a significant (0.01) adjustment of the current price of beef by about 41.9%, all things being equal. This means that the current price of beef depends on the previous prices, and this implies a long-run relationship in the price movement of this market pair.
5.3.3. Threshold Vector Error Correction (TVCEM) model of meat prices in Ghana and South Africa
The results of the HS test provided that there is significant threshold and asymmetric effect of price movement of beef in the market pair of South Africa—Ghana. This resulted in the separation of this market from the other markets so that the price transmission dynamics of this market pair could be studied using a two-regime TVEC model. This model enables us to describe the marketing environment in which two markets that are spatially separated can engage in trading if the relative price difference is more than a certain level of transaction cost (Keho & Camara, Citation2012). This can be regarded as a-typical regime where market integration and price movement can be enhanced and facilitated by this markets (Blay, Citation2015). This can lead into cointegration of markets in this typical regime. This regime happens when transaction cost exceeds the relative price difference between the two markets. Table presents the results of the TVECM employed to study this market pair.
Table 7. Results of threshold vector error correction model
The TVECM produces a threshold parameter, γ = −0.1943055 from the search process and this value can be referred to as the short-term price elasticity. This value divides the model into two regimes. The first regime (regime one) indicates the rate at which monthly beef price in each market will adjust when the absolute deviations from long-term equilibrium is lower than the threshold value. Calculating these prices with the average meat price of each market gives us $1.071/kg and $1.11/kg in the Ghana beef market and South African beef market, respectively. Therefore, there will not be any adjustment if deviations from long-term equilibrium are below these prices in the respective beef markets.
From the results, the regime of adjustment (regime 1), which represents the band of non-adjustment, has 51.7% of the total observations, whereas 48.3% of the observations are captured under regime 2. With regard to the estimated coefficients of the model, there was no response to short-term reaction of lagged price changes in any of the markets. This implies that no significant adjustment of deviations did occur in the long-term equilibrium, when these deviations are below the critical threshold value (regime 1) for the two markets. This may be due to transaction cost hypothesis, which limits a perfect price adjustment.
From regime 2 of the results presented, there is evidence of adjustment in the two markets. The speed of adjustment parameter (0.1298) for the Ghanaian beef market price means that there is adjustment of beef price to long-term equilibrium. The adjustment speed (12.98%) has a half-lifeFootnote1 of about 5.68 months needed to correct 50% of the disequilibrium in the market. Similarly, in regime 2, there is an adjustment in the South African beef price to deviations from equilibrium in the long run with the speed of adjustment parameter of 0.0647 representing a speed of adjustment of 6.47% with a half-life necessary to correct half (50%) of these deviation as 11.06 months ceteris paribus. Again, the results also reveal that current price of beef in Ghana is significantly (5%) influenced by lag one of previous price of beef (-1). A percentage increase in the lagged price of beef increases the current price of beef by about 60.6% holding other factors constant. This makes current price of beef in Ghana a function of the past year’s price, thereby indicating a long-run relationship between current prices and past prices.
Other diagnoses and model-checking analysis was conducted to complement the TVECM results after the model was estimated. Of particular interest was to determine the nature of the response of this price pair to positive and negative perturbations. The results can also be found in Table . As seen in the table, both markets did not respond to positive deviations from price equilibrium in the long run. However, both markets respond significantly to negative discrepancies in the long run. Negative deviations that emanate from the reference market (South Africa) significantly (1%) elicit a response from the beef market of Ghana (destination or dependent market). This implies that the adjustment process follows a negative asymmetric path. This adjustment parameter has a point estimate of −0.299, which indicates that the beef market of Ghana will adjust to remove about 29.9% of changes in price above (negative deviations) the threshold price of $1.071/kg ceteris paribus.
The Granger causality test indicates that changes in beef prices in South Africa do indeed have a Granger-causal relationship with beef prices in the Ghanaian market. This causality is expected to be unidirectional since Ghanaian beef does not enter the South African Market. Ghana imports beef from this market but does not export same. The hypothesis test for symmetric adjustment path in the model was rejected at 5% significance level in lag two of the own price of beef of South Africa. There was an effect of distributed lag asymmetry for own price of South Africa as influenced by lag two of its own beef price but rather have symmetric effect on beef price in Ghana in the same lag length. The results are presented in Table .
6. Discussion
This section of the study provides a summarized discussion on the results obtained from this study.
First of all, the data analysed in this study showed evidence of cointegration between the foreign meat markets that served as reference markets and the domestic meat markets as the destination markets. This means that there is long-run relationship or error correction term in the local and foreign market pairs. This long-run relationship implies that price shocks or disturbances in foreign meat markets (reference markets) will have a lasting impact on the Ghanaian domestic meat markets, thereby indicating a degree of price transmission and interdependence. This is likely to provide opportunities for arbitrageurs such as meat importers, who have profit-seeking behaviours to act in bring deviations back to equilibrium, thereby restoring equilibrium and ensuring market efficiency. This study is in consonance with numerous studies in agricultural and food-related studies such as Blay (Citation2015), Abdulai (Citation2007), and Acquah et al. () who all reported cointegration relationships in their studies, especially in Ghanaian context.
Besides, the analysis also reveals a long-run relationship between the exogenous variables (crude oil prices and exchange rate) implying that meat market prices in Ghana are correlated with the crude oil prices and exchange rates. This is probably due to the fact that imports are bought by converting the local currency to dollars. Crude oil prices are also related to the prices of meat due import charges that are placed on imported meat to take care freight and distributional cost. This justifies their inclusion as exogenous variables to analyse the price transmission dynamics of domestic meat prices that depend on the foreign markets. The observation of cointegration between the meat markets and these variables has been confirmed in similar studies that have included them into analysing market integration, e.g. Liefert and Persaud (Citation2009); Díaz-Bonilla (Citation2019); Mutuc et al. (Citation2011); Huchet-Bourdon and Korinek ()
When the linear cointegration was further extended to analyse the market integration dynamics in these meat markets, the results show evidence of asymmetric adjustment processes between reference foreign meat markets and the domestic meat markets of the country. The results of the Asymmetric VCEM and the Asymmetric TVCEM all provided evidence of price transmission from these foreign beef and mutton markets to Ghanaian domestic markets destination markets) for these meat products. This current study reveals that price transmission between Ghana and these markets appears to be asymmetrical rather than linear. Asymmetry implies that increases in meat prices of the reference foreign markets are passed on to the domestic meat markets in Ghana at different levels. This implies that adjustment process towards the long-term equilibrium relationship between the foreign and domestic meat prices is not uniform across all price levels.
For instance, in the two-regime TVEC model for the South Africa beef market (reference market) and Ghana (destination or dependent market), when the price of beef deviates above a certain threshold price of $1.071 per kilogram, the adjustment mechanism will work to bring the price back down towards the threshold level. The adjustment parameter, with a point estimate of −0.299, provides an indication of the extent to which the beef market in Ghana will correct or remove changes in price above the threshold, specifically negative deviations from the threshold price. In this case, the estimate of −0.299 suggests that, on average, the market will adjust to eliminate approximately 29.9% of any increase in price above the threshold, assuming other factors remain constant (ceteris paribus). In essence, this negative asymmetric adjustment process implies that the beef market in Ghana exhibits a stronger response to price increases above the threshold compared to price decreases below the threshold. It suggests that the market is more likely to correct or adjust prices downwards to counteract any upward deviations from the threshold, thereby promoting price stability and convergence towards the long-term equilibrium.
The reported presence of asymmetry in the meat markets in Ghana corroborates with similar studies in other agricultural products markets such as studies of Amikuzuno and Donkoh (Citation2012) and Blay (Citation2015) who reported asymmetric price adjustment processes and posited cross-border tariffs and transaction cost as the likely causes. In meat-related market studies, Vavra and Goodwin (Citation2005) and Ogundeji and Maré (Citation2020) also reported that price adjustment processes were asymmetrical in their studies. The observation in the current study contrasts the study of Zoltán Bakucs and Fertő (Citation2006) who reported symmetric price adjustment in beef markets of the Hungarian beef value chain.
In a nutshell, the asymmetry transmission processes probably highlight the presence of market frictions or barriers that impede the immediate adjustment of reference foreign meat prices to domestic meat markets. This could be created by importers who likely used market power to create asymmetry in the prices of these meat products. Delay in clearing couple with other formal and informal costs along the chain could cause price spikes through asymmetries. Market intervention programmes in the trading countries especially in export countries may affect smooth co-movement of prices and create asymmetric transmission dynamics in the importing country (Ghana).
However, contrary to prior expectations, the inclusion of the exchange rate and crude oil price did not influence the price transmission dynamics of beef and mutton prices in Ghana. This probably imply that these macroeconomic variables do not have influence on the transmission process of imported beef and mutton in Ghana based on the current data.
Despite the fact that, this study provides insightful findings of beef and mutton market integration and price transmission, care should be taken in the interpretation of the results, since the study didn’t include all meat products and all countries that export livestock and meat products to Ghana. The results could have been different if these issues were all considered in this study.
7. Conclusion and policy recommendations
The study can conclude that, the meat market pairs (reference foreign markets and the dependent domestic market) showed higher level of integration. There was mixed pattern of the estimates of the error correction where some of the markets highly adjusted to negative deviations from equilibrium than positive deviations. All the markets are exhibiting asymmetry processes to indicate that price movements in the foreign markets (independent market) are quickly transferred to the domestic markets which serve as dependent markets to foreign meat imports at different levels. Other markets such as the beef market pair of South Africa and Ghana exhibited threshold and asymmetric adjustment and we can conclude that price change in the reference market (South Africa) must exceed the threshold price before adjustment can occur in the Ghanaian beef market (dependent market). This price, however, does not actually reflect the suspected transaction cost of meat products especially with reference to imported products in Ghana.
Although this study did find some evidence to conclude that there was cointegration relationship between the exogenous variables (crude oil prices and exchange rate) and meat markets in Ghana, their fluctuation or volatility did not have any significant impact on the price transmission process, especially of beef and mutton meat prices in the Ghana.
Based on the findings of this study the following policy recommendations are given as follows;
To ensure symmetric price transmission across these markets, there is a need to establish a proper functioning agricultural market information system, especially foreign markets and domestic markets in order to promote price information flow to market agents.
To resolve the asymmetric price transmission process which may lead to high price hikes, import tariffs may be imposed on these imported products while promoting domestic production in order to meet demand and avoid price hikes by few powerful market agents (meat importers).
Disclosure statement
No potential conflict of interest was reported by the author(s).
Additional information
Funding
Notes on contributors

Nanii Yenibehit
Nanii Yenibehit holds 4 years of teaching experience as a tutor at the Animal Health and Production College under Ghana’s Ministry of Food and Agriculture (MoFA). He formerly worked as a Teaching and Research Assistant at the University of Education, Winneba, Mampong campus. He holds an MPhil in Agricultural Economics from the University for Development Studies, Tamale, Ghana. His research interest is in the areas of Agriculture, Food, Value, and Supply Chains Analysis; Agriculture, Food, and Commodity Markets and Prices; Agricultural Production and efficiency analysis; including issues of climate change and Land Use Land Cover (LULC) changes. During the 2017 graduation, he won the principal best-graduating student at the Faculty of Agriculture, University of Education, Winneba, Mampong campus. He also won a data collection grant under the Access and Authority Nexus (AAN project) of the Farmer-Herder conflicts project in Ghana in 2021
Notes
1. The half-life (time) for adjustment was calculated following the formula;, where
is the speed of adjustment parameter.
References
- Abdulai, A. (2000). Spatial price transmission and asymmetry in the Ghanaian maize market. Journal of Development Economics, 63(2), 327–28. https://doi.org/10.1016/S0304-3878(00)00115-2
- Abdulai, A. (2007). Spatial and vertical price transmission in food staples market chains in Eastern and Southern Africa: What is the evidence? In Paper presented at the FAO Trade and Markets Division Workshop on Staple Food Trade and Market Policy Options for Promoting Development in Eastern and Southern Africa (pp. 4–34).
- Abunyuwah, I. (2007). Market Integration Analysis And Time Series Econometrics- Conceptual Insights From Markov-Switching Models. [ Doctoral Dissertation], Submitted: Georg-August-University of Göttingen (Germany).
- Adom, K. (2014). Beyond the marginalization thesis: An examination of the motivations of informal entrepreneurs in sub-saharan Africa. The International Journal of Entrepreneurship and Innovation, 15(2), 113–125. https://doi.org/10.5367/ijei.2014.0144
- Adzitey, F. (2013). Animal and meat production in Ghana-an overview.
- Alderman H(1992). Intercommodity Transmittal analysis of Food markets in Ghana. World Bank Working Paper. https://books.google.com.gh/
- Amador, L. C., Machado, J. A., & Miranda, S. H. G. (2018). Market integration and price transmission in the Brazilian poultry sector. Revista de Economia e Sociologia Rural, 56(4), 667–680.
- Amikuzuno, J. (2010). Spatial price transmission analysis in agricultural markets: Does the data frequency improve our estimation? No. 308-2016-4994. 1–19.
- Amikuzuno, J., & Donkoh, S. A. (2012). Border effects on spatial price transmission between fresh tomato markets in Ghana and Burkina-Faso: Any case for promoting trans-border trade in West Africa? In International Association of Agricultural Economists (IAAE) Triennial Conference, Foz (pp. 1–18). Foz do Iguaçu, Brazil.
- Ankamah-Yeboah, I. (2012). Price transmission in the regional maize markets in Ghana (no. 49720). Munich Personal RePec Archive. Retrieved from https://mpra.ub.uni-muenchen.de/49720/
- Appiah-Kubi, K. (2012). Trade policy reform and regional integration in Ghana. African Development Review, 24(2), 166–178.
- Aryeetey, E., & Harrigan, J. (2000). Macroeconomic and sectoral developments since 1970. In E. Aryeetey, J. Harrigan, M. Nissanke, & J. Currey (Eds.), Economic reforms in Ghana, the miracle and the mirage (pp. 5–31). Woeli Publishers.
- Ben Kaabia, M., Gil, J. M., & Boshnjaku, L. (2002). Price transmission asymmetries in the Spanish lamb sector. No. 723-2016-48967.
- Blay, J. K. (2015). Spatial Market Integration And Price Transmission Of Important Crop Markets In Ghana. [ Masters thesis Submitted], Professor Jayashankar Telangana State Agricultural University (India).
- Chan, K. S. (1993). Consistency and limiting distribution of the least squares estimator of a threshold autoregressive model: The annals of Statistics. 21(1), (Mar ., 1993), pp. 520-533 Published by : Institute of Mathematical Statistics, 21(1), 520–533. https://doi.org/10.1214/aos/1176349040
- Deb, L., Lee, Y., & Lee, S. H. (2020). Market integration and price transmission in the vertical supply chain of rice: An evidence from Bangladesh. Agriculture, 10(7), 271. https://doi.org/10.3390/agriculture10070271
- Díaz-Bonilla, E. 2019. Volatile volatility: Conceptual and measurement issues related to price trends and volatility. In M. T. J. von Braun & M. Kalkuhl Eds. Food price volatility and its implications for food security and policypp. xvi–xvii Internatio https://doi.org/10.1007/978-3-319-28201-5
- Enders, W., & Granger, C. W. J. (1998). Unit-root tests and asymmetric adjustment with an example using the term structure of interest rates. Journal of Business & Economic Statistics, 16(3), 304. https://doi.org/10.2307/1392506
- Enders, W., & Siklos, P. L. (2001). Cointegration and threshold adjustment. Journal of Business and Economic Statistics, 19(2), 166–176. https://doi.org/10.1198/073500101316970395
- Engle, R. F., & Grangeri, C. W. J. (1987). Co-integration and error correction: Representation, estimation, and testing. Econometrica, 55(2), 251–276. https://www.jstor.org/stable/1913236
- Facts & figures. (2018), 1–24.
- FAO - Food and Agriculture Organization. (2011). World livestock 2011 livestock in food security. In Livestock in food security (pp. 2–130).
- Garcia, M., Lluberas, R., & Otero, J. (2017). Market integration and price transmission in the Argentine beef sector. Agribusiness, 33(1), 22–36.
- Ghana Ministry of Trade and Industry [MoTI]. (2020). National export Development strategy: 2020-2024.
- Hansen, B. E., & Seo, B. (2002). Testing for two-regime threshold cointegration in vector error-correction models. Journal of Econometrics, 110(2), 293–318. https://doi.org/10.1016/S0304-4076(02)00097-0
- Harvey, D. I., & Leybourne, S. J. (2007). Testing for time series linearity. The Econometrics Journal, 10(1), 149–165. https://doi.org/10.1111/j.1368-423X.2007.00203.x
- Hjalmarsson, E., & Österholm, P. (2007). Testing for cointegration using the Johansen methodology when variables are near-integrated: Size distortions and partial remedies. Empirical economics, 39(1). https://doi.org/10.1007/s00181-009-0294-6
- Huang, J., Yang, J., Zhu, X., & Yang, Y. (2019). Market integration and price transmission in China’s pork markets. Journal of Agribusiness in Developing and Emerging Economies, 9(3), 316–335.
- Huchet-Bourdon, M. (2011). Agricultural Commodity Price Volatility: An Overview. In OECD Food, Agriculture and Fisheries Papers (p. 52). OECD Publishing. https://doi.org/10.1787/5kg0t00nrthc-en
- Huchet-Bourdon, M., & Korinek, J. (2011). To What Extent Do Exchange Rates and their Volatility Affect Trade?. In OECD Trade Policy Papers, No. 119. OECD Publishing. https://doi.org/10.1787/5kg3slm7b8hg-en
- Ihle, R., & Amikuzuno, J. (2010). Markets integration with and without direct trade flows: The tomato in Ghana. In The International Association of Agricultural Economists Conference (Vol. 24, pp. 21–46). Beijing, Beijing. https://doi.org/10.3917/edd.241.0021
- Jayaraman, T. K. (1997). The impact of trade liberalization in Ghana. World Development, 25(3), 367–376.
- Johansen, S., & Juselius, K. (1990). Maximum likelihood estimation and inference on cointegration — with applications to the demand for money. Oxford Bulletin of Economics and Statistics, 52(2), 169–210. https://doi.org/10.1111/j.1468-0084.1990.mp52002003.x
- Joseph, K. (2018). Argentina livestock and products annual. Global Agricultural Information Network (GAIN) Report, March 2010Retrieved from %0A%0Again.fas.usda.gov.
- Keho, Y., & Camara, A. S. (2012). Vertical price transmission in local rice markets in Côte d’Ivoire: Are consumers really right?. Asian Journal of Agriculture and Rural Development, 2(393–2016–23877), 552–564.
- Laryea, A., & Akuoni, S. (2012). An Overview of Trade Policies and Developments in Ghana. In C. Ackah & E. Aryeetey (Eds.), Globalization Trade and Poverty in Ghana (pp. 10–32). SUB-SAHARAN Publisher.
- Lee-Jones, D. (2019). New Zealand livestock and products annual New Zealand beef production steady, but exports shift to China. https://do.org/NZ1910
- Liefert, W., & Persaud, S. (2009). The transmission of exchange rate changes to agricultural prices (economic Research report no. 76). United States Department of Agriculture. https://doi.org/10.1787/5kg0t00nrthc-en
- Listorti, G., & Esposti, R. (2012). Horizontal price transmission in agricultural markets: Fundamental concepts and Open empirical issues. Bio-Based and Applied Economics, 1(1), 81–108.
- Ministry of Food and Agriculture [MoFA]. (2019). Country analysis Ghana.
- Minot, N. W. (2014). Transmission of World Food price changes to markets in sub-Saharan Africa ( IFPRI Discussion Paper 01059 January 2011 Transmission No. 01059).
- Mutuc, M., Pan, S., & Hudson, D. (2011). Sino-U.S. Price transmission in agricultural commodities: How important are exchange rate movements? (no. Q11; Q17). Agricultural & Applied Economics Association’s 2011 AAEA & NAREA Joint Annual Meeting, 64. Pittsburgh, Pennsylvania, USA.
- Ogundeji, A., & Maré, F. (2020). Analysis of price transmission in the beef value chain using a calculated retail carcass price. Agrekon, 59(2), 144–155. https://doi.org/10.1080/03031853.2019.1700808
- Overview of the South African; How Are South African. (2019). Retrieved February 20, 2021, from www.rpo.co.za
- Oyewumi, O. A., & Sarker, R. (2010). Volatility spill-over in a Customs Union: The case of South Africa sheep import from Namibia (Joint 3rd African Association of agricultural Economists (AAAE) and 48th agricultural Economists Association of South Africa (AEASA) Conference no. 3rd and 48th).
- Putra, G., & Sohibien, D. (2017). Application of threshold vector error correction model (TVECM) in describing adjustment of interest rate of working capital credit to BI rate movement. Journal of Science & Science Education, 1(2), 31–43. https://doi.org/10.24246/josse.v1i2p31-43
- Quaye, W., & Ameleke, G. (2009). Sorghum market integration study in Ghana. Ghana Journal of Agricultural Science, 41(1), 35–47. https://doi.org/10.4314/gjas.v41i1.46143
- Shapiro, S. S., & Wilk, M. B. (1965). An analysis of variance test for normality (complete samples). Biometrika, 52(3/4), 591–611. https://doi.org/10.1093/biomet/52.3-4.591
- Shik, O., Boyce, R., & De Salvo, C. P. (2019). Analysis of agricultural policies in Barbados. Analysis of Agricultural Policies in Barbados. https://doi.org/10.18235/0001751
- Smith, J. (2020). Ghana’s meat industry growth: More imports needed. Retrieved from https://www.businessghana.com/site/news/business/223888/Ghana-s-meat-industry-growth-More-imports-needed
- Taylor J. (2023). Livestock and Products, Agricultural Situation, Agriculture in the Economy: Ghana Livestock Voluntary Report (GH2023-0003). United States Department of Agriculture (USDP) & the Global Agricultural Information Network (GAIN).
- Tione, S. E., & Mtimet, N. (2016). Market integration and price transmission in the beef markets of Malawi. Agrekon, 55(3), 260–276.
- Uysal, E. (2012). Application of nonlinear unit root tests and threshold autoregressive models. [Master's thesis] Middle East Technical University.
- Vasileska, A., & Rechkoska, G. (2012). Global and regional Food consumption patterns and trends. Procedia - Social & Behavioral Sciences, 44, 363–369. https://doi.org/10.1016/j.sbspro.2012.05.040
- Vavra, P., & Goodwin, B. K. (2005). Analysis of price transmission along the Food chain (OECD Food, Agriculture and fisheries papers no. 3). https://doi.org/10.1787/752335872456OECD
- Whitfield, L. (2011). Political challenges to developing non-traditional exports in Ghana: The case of horticulture exports. ( DIIS Working Paper 2011: 29; DIIS Working Paper Sub-Series on Elites, Production and Poverty). www.diis.dk
- Wlazlowski, S., Giulietti, M., Binner, J., & Milas, C. (2009). Price dynamics in European petroleum markets. Energy Economics, 31(1), 99–108. https://doi.org/10.1016/j.eneco.2008.08.009
- World Bank. (1962). Economic development in Ghana: The role of indigenous entrepreneurship.
- World Bank. (2019). Ghana economic outlook. Retrieved from https://www.worldbank.org/en/country/ghana/publication/ghana-economic-outlook-october-2019
- Zoltán Bakucs, L., & Fertő, I. (2006). Marketing margins and price transmission on the Hungarian beef market. Food Economics - Acta Agriculturae Scandinavica, Section C, 3(3–4), 151–160. https://doi.org/10.1080/16507540601176075