
Abstract
The present study aimed to explore fluctuations in fatty acids and phenolic profiles of olive oil extracted from fruits of Olea ferruginea Royle harvested at green raw and purple ripe stages from the district Zhob, Balochistan, Pakistan. First, fruit sampling was conducted on 26th June when green olives appeared on trees; second, purple ripe olives were picked on 26th August. Due to very small size and large pit size, oil is extracted without de-pitting the fruit. High-performance liquid chromatography–mass spectrometry (HPLC-MS) system was used for fatty acid and phenolic profiling of both oil samples. Results showed that fatty acid composition of oil extracted from raw green and ripe purple olives falls in the normal range set for purity criteria for olive oils and olive pomace oils by International Olive Council 2019 except for behenic, caprylic, capric and lauric in both oils and oleic acid and linoleic acid of oil extracted from raw green olives which do fall in standard ranges. Fatty acid composition of the olive oil showed that the oil is rich in monounsaturated fatty acids (range 50.71% in oil of green olives and 58.77% in oil of ripe purple olives), polyunsaturated fatty acids (range 30.45% in oil of raw green olives and 19.32% in oil of ripe purple olives) and saturated fatty acids (range 15.27–18.58% in olive oil obtained from raw green and ripe purple olives). SFAs showed least variation with ripening stages. There was high concentration of total phenolics in oil obtained from green raw olives (33.41 mg kg−1) as compared to oil of ripe purple olives (18.49 mg kg−1). The present study revealed that alpha, beta, gamma and delta tocopherols showed a uniform trend along with ripening of olive fruit, i.e. there is a clear decline in total tocopherol content of olive oil obtained from ripe purple olives. Green raw olives showed high values of α-tocopherol (192.47 mg kg−1), β + γ-tocopherols (233.65 mg kg−1) and δ-tocopherol (1087.48 mg kg−1). The present work concludes that ripening of olive fruit affects chemical composition of olive oil.
1. Introduction
The olive ripening stage is one of the most important factors associated with the quality evaluation of olive oil fatty acids (Criado et al., Citation2007; Youssef et al., Citation2007). During ripening of olive fruit, many changes in metabolic procedures take place that causes structural variations of chemical compounds and varying concentrations of these compounds. These changes affect the quality and physicochemical status of oil and changes taste, smell, shelf life and nutritive characteristics. Compositions of polyphenols, fatty acid and various pigments (chlorophyll and carotenoid) are examples (Youssef et al., Citation2010). Olive oil is mainly composed of triacylglycerols, free fatty acids, mono and diacylglycerols and a variety of lipids like aliphatic alcohols, hydrocarbons, pigments, sterols and tocopherols. There are also a plenty of volatile and phenolic compounds. Some of these constituents contribute to the unique characteristic of oil (Boskou et al., Citation2006). Fatty acids are the most important components of olive oil. These are made up of numerous carbon chains and have simple structures. The nutritional and typical values of olive oil primarily depend on the concentration of fatty acids. The main fatty acids contained in oil are saturated fatty acids like palmitic acid and stearic acid, monosaturated fatty acids like oleic and palmitoleic acid, and polyunsaturated fatty acids like linoleic and linolenic acid. Olive oil contains different concentrations of all these components, while low concentrations of some other fatty acids like heptadecanoic, arachidic, behenic, myristic, margaric and lignoceric acid may also be detected. Oleic acid alone accounts 55–75% of oil (García‐González et al., Citation2008; Ramirez-Tortosa et al., Citation2006).
2. Materials and methods
2.1. Plant identification
Plant samples of test species were brought to laboratory and mounted well on herbarium sheet. Field photography was also performed. Herbarium sheet and photographs were used as supporting documents for identification. Plant was identified as Olea ferruginea through Flora of Pakistan and was confirmed by Dr. Rasool Bakhsh Tareen. (Plant Taxonomist, University of Balochistan Quetta).
2.2. Oil extraction
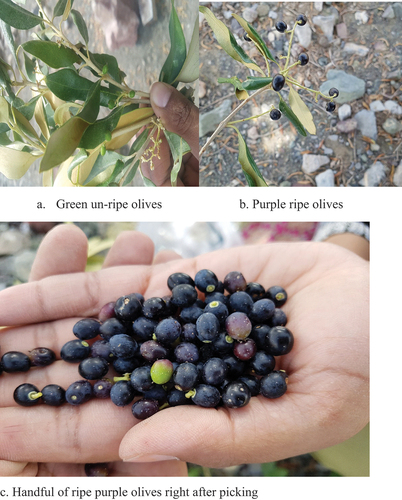
Olive fruits (green, unripe and purple ripe) were brought to laboratory after sampling from the Zhob district of Balochistan, Pakistan Figure . Olives sampled were washed thoroughly with water and then placed in dark aerated room until further use. Oil extraction was performed manually on nut-processing stone grinder. After careful cleaning of machine, samples were processed to obtain oil and fruit paste. Here an important thing to mention is that due to small-sized fruit and large percentage of seed size its oil is extracted locally without deseeding the fruit. Both oils were collected in dark glass bottles, brought to laboratory and kept in refrigerator until further analysis.
Figure 1. Olive sampling, a. green unripe olives, b. Purple ripe olives, c. handful of ripe purple olives right after picking.
2.3. Fatty acid analysis
Fatty acid methyl esters (FAME) were prepared to evaluate fatty acid composition in samples by following the official method of European Union Commission Regulation 2568/91. Fatty acid methylation was done by the following method of with slight modifications. 0.2 g of oil samples was saponified in 1.5 ml hexane and 0.5 ml (1N) KOH methanolic solution, after vigorous shaking during 5 minutes. Then 0.5 ml supernatant was isolated and mixed well in 2 ml hexane. The analysis was performed on gas chromatography (GC) (Agilent 6890N) consisting of a capillary column SP-2340 (60 m × 0.25 mm i.d, 0.2 µm f.t, Supelco), FID (flame ionization detector) and nitrogen as a carrier gas. Programmed temperature (110°C for 5 min, then reached up to 150°C for 16 min by increasing temp 3°C/min, then maintained at 230°C for 27 min by rising 4°C/min) was maintained for separation in column, and 260°C was programmed for FID. The identification of fatty acids was performed by comparing retention time with standard compounds. The results were expressed as relative percentages of each fatty acid.
2.4. Tocopherol analysis
The IUPAC 1987 protocols were followed with few modifications to calculate alpha, beta, gamma and delta tocopherols in olive oil samples. Olive oil was mixed with hexane to makeup volume to 10 ml. Then mixture was filtered through polytetrafluoroethylene (PTFE) filter (0.22 µm, 25 mm, Whatman). 20 microlitre of oil sample was injected in HPLC unit (HPLC (Agilent 1100) consisting of a Zorbax NH2 column (25 cm × 4.6 mm, i.e., 55 µm particle size) and fluorescence detector (295 nm and 325 nm wavelength)) with isocratic mobile phase (C6H14 and C4H8O2) in 80:20 at a flow rate of 2 ml/min. Results were obtained as milligram of tocopherols per kg of olive oil by comparing with given standards.
2.5. Total phenol content determination
Total phenolic contents in oil samples extracted from raw green and ripe purple olives of O. ferruginea were quantified on spectrophotometer at 765 nm by Folin–Ciocalteu method (Montedoro et al., Citation1992), and the results were expressed as mg of gallic acid per kilogram of oil. Each olive oil sample was mixed with 15 mL of 80:20 (v/v) methanol/water solution; then 2 to 3 drops of Tween-20 was added, while sample was kept on vortex. The sample mixture was then centrifuged at a speed of 5000 rpm for 15 minutes. Supernatant was collected in glass tube. Same process was repeated three times by adding 15 mL 80:20 (v/v) methanol/water solution to collect methanolic extract that was poured in same tube. Then 2 ml of 80% methanol was mixed with supernatant, and further dilution was done with deionized water to make up volume to 10 ml. 1 ml Folin–Ciocalteu reagent followed by 15% (w/v) 4 ml Na2CO3 solution was added. Then 3 ml deionized water was added and kept in dark for 3 hours. The absorbance was measured at 765 nm against reagent blank. Gallic acid stock solution (0.5 mg/ml) was used to prepare different dilutions, and their absorbance was also measured at 765 nm to make calibration curve. TPC was then calculated from absorbance and calibration curve as mg of gallic acid/kg of oil.
2.6. Quantitative determination of phenolic compounds by HPLC
Phenolic compounds were quantified in olive oil samples by following International Olive Council. 2.5 grams olive oil sample was mixed in 7.5 mL methanol (80%) and stirred until homogenized well. Sample was then kept in ultrasonic for 17 minutes. The mixture was centrifuged for 30 minutes at a speed of 5000 rpm maintaining temperature at 4°C; then supernatant was collected. High-performance liquid chromatography–mass spectroscopy (Agilent Technologies 1200 series liquid chromatography system) equipped with Eclipse XDB-C8-A HPLC column of 5 μm particle size, 150 mm length and 4.6 mm (Agilent Technologies, Santa Clara, California) at 1 mL/min flow rate was used for analysis. For analysis a gradient elusion of 95%A and 5%B for 2 minutes, 75%A and 225%B for 8 minutes, 60%A and 40%B for 10 minutes, 50%A and 50%B for 16 minutes and 0% and 100%B for 14 minutes was carried out to get to the initial condition with a total time of 60 minutes. Finally, each individual phenolic compound is measured at 280–339 nm, while commercially available standards were used.
2.7. Mineral analysis
Elements in fruit samples C (carbon), H (hydrogen), N (nitrogen), Cu (copper), Br (bromine), Co (cobalt), Cr (chromium), Fe (iron), K (potassium), Mn (manganese), Na (sodium), Sm (samarium), Th (thorium) and Zn (zinc) were quantified using the standard technique.
Br, Cr, Fe, K, Mn, Na, Sm, Th and Zn were quantified by Instrumental Neutron Activation Analysis (INAA). C, H and N were quantified by CHNS-O (Flash 2000 Thermo Scientific). Cu was quantified on flame atomic absorption spectrophotometer (FAAS).
2.8. Analysis by organic elemental analyzer (CHNS-O)
CHNS-O (Flash 2000 Thermo Scientific) involves combustion for splitting the desired substances into simple compounds that are quantified. Entire procedure occurs in four zones organized in specific manner, i.e., combustion zone → gas control zone → separation zone → detection zone. 10 milligram dried sample is closed in capsules of tin in first zone and kept in combustion chamber where high temperature (950°C) and excess oxygen oxidize the samples into carbon dioxide, nitrogen and oxides of sulfur. Products of the first zone further entered and homogenized thoroughly in the second, i.e., gas control zone. Then the sample enters the third zone where GC (gas chromatography) equipped separation zone. Lastly, in the fourth zone known as detection zone the obtained gases are transported to sensitive thermal conductivity detector. Finally, in detection zone the eluted gases were conveyed to thermal conductivity detector. Here specific signals are generated that are further processed on Eager 300 thermo electron software® that calculates nitrogen, hydrogen, carbon and sulfur percentage in sample. This entire process involves use of 99.99% oxygen for oxidative steps, whereas the same percentage of helium is used as carrier gas.
2.9. Statistical analysis
Olive oil samples were analyzed in replicate, and data were statistically analyzed. Mean and standard deviations were calculated on Microsoft excel, whereas two software, STATISTIX 9.1 and MINITAB® 17, were used to find out least significant difference between test values.
3. Results and discussions
A previous study about change in total oil and fatty acid composition of olive fruit with fruit ripening (Nergiz & Engez, Citation2000) reported that oil accumulation increases during ripening phase of olives, whereas sugar accumulation shows a decline with fruit ripening. The olive ripening stage is one of the most important factors associated with the quality evaluation of olive oil (Criado et al., Citation2007) (Youssef et al., Citation2007).; During ripening of olive fruit, many changes in metabolic procedures take place that causes structural variations of chemical compounds and varying concentrations of these compounds. These changes affect the quality and physicochemical status of oil and change taste, smell, shelf life and nutritive characteristics. Compositions of polyphenols, fatty acid and various pigments (chlorophyll and carotenoid) are examples (Youssef et al., Citation2010).
3.1. Fatty acids
Fatty acid composition of the olive oil showed that oil is rich in monounsaturated fatty acids (50.71% in oil of green olives and 58.77% in oil of ripe purple olives). Polyunsaturated fatty acids (PUFAs) showed 30.45% in oil of raw green olives and 19.32% in oil of ripe purple olives. Saturated fatty acids (SFAs) ranged between 15.27 and 18.58% in olive oil obtained from raw green and ripe purple olives. SFAs showed least variation with ripening stages (Difonzo et al., Citation2019).
The results described above showed that fatty acid composition between oil extracted from raw green and ripe purple olives falls in the normal range set for purity/quality criteria for olive oils and olive pomace oils by International Olive Council (2019) except for behenic, myristic, oleic and linoleic acid of oil extracted from raw green olives which do not fall in standard ranges, whereas behenic acid values match the pomace oil standard in both oil samples (Table ). Our data show the change in palmitic acids, palmitoleic acid, oleic acid, linoleic acid during ripening, whereas heptadecanoic acid, linolenic acid and eicosenoic acid do not vary significantly during maturation process.
Table 1. Fatty acids concentration in olive oil obtained from raw green and ripe purple olives
Thus, the palmitic acid content increases during the fruit ripening process, from 10.11 mg kg−1 at green raw fruits to 16.98 mg kg−1 at ripe purple fruit. These were in denial with findings of (Youssef et al., Citation2007) who reported a decrease in palmitic acid content with fruit ripening.
3.2. Phenols
In our findings high concentration of total phenolics in oil from green raw olives (33.41 mg kg−1) as compared to 18.49 mg kg−1 in oil of ripe purple olives (Table ) agrees with Pellegrini 2001 who reported that antioxidant activity of commercial oils is basically due to their phenols and α-tocopherol concentration. He also suggested that phenols of olive oil work as stabilizers of α-tocopherol during heating process and thus it helps to maintain nutritional status of cooked food There are numerous factors that can affect the phenolics in olives (Cicerale et al., Citation2008) including the cultivar, degree of ripening, and, importantly, the methods used for curing and processing table olives. Charoenprasert & Mitchell (Citation2012) stated that processing of olives affects the quality of oil and a decline in oleuropein concentration can be noted with parallel increases in the hydroxytyrosol and tyrosol level. Hydroxytyrosol is said to be responsible for health benefits of olive oil. A review study (Parkinson & Cicerale, Citation2016) concludes that residents of Mediterranean region showed low percentage of chronic inflammatory diseases as they consume virgin olive oil on daily basis. They confidently stated that oleuropein and hydroxytyrosol have been proven to contain in vivo and in vitro pharmacological activity.
Table 2. Individual and total phenols (mg kg−1) in olive oil extracted from raw and ripe (purple) fruit of O. ferruginea Royle
With progressing fruit ripening, various physical and biochemical changes occur in the fruit. Biochemical changes include fluctuations in fatty acids and phenolic profiling and changes in pigments. These changes affect shelf life, taste, odour and overall quality of olive oil, especially from commercial point of view. It has been reported by Youssef et al. (Citation2010) that the olive oil samples with the highest stability values had also the highest levels of major phenolic compounds such as hydroxytyrosol, oleuropein, a high oil yield and excellent characteristics concerning quality parameters. Our oil samples have unique and high catechin levels that can be counted as an addition to the factors increasing stability and shelf life of olive oil.
3.3. Tocopherol
The present study revealed that alpha, beta, gamma and delta tocopherols showed a uniform trend along with ripening of olive fruit, i.e., there is clear decline in total tocopherol content of olive oil obtained from ripe purple olives. While green raw olives showed high values of α-tocopherol (192.47 mg kg−1), β + γ-tocopherols (233.65 mg kg−1) and δtocopherol (1087.48 mg kg−1)(Table ), alpha tocopherol value meets purity and trade standards set by International Olive oil council (2019). Castro-Barquero et al. (Citation2018) reported that dietary polyphenols are involved in weight management practice, especially in regions of world with routine consumption of olive oil, and other fruits and vegetables enriched with polyphenols. There is evidence that intake of few specific polyphenols is related to body weight management, but there is no proof that total polyphenols work to cure obesity-related issues.
Table 3. Tocopherol contents of olive oil extracted from raw green and ripe olives
Statistical analysis indicates significant differences between olive oil samples for alpha, beta, gamma and delta tocopherols, individual phenols (except for vanillin,catechin, luteolin and oleuropein which do not show any significance difference when analyzed for least significant difference (LSD) test), and fatty acids except for lauric acid which shows almost similar values with no significant differences.
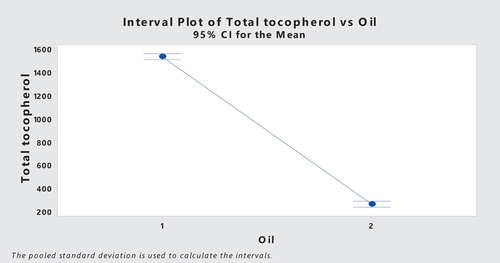
Tocopherols of olive oil are their effective phenolic antioxidants. Their concentration and composition depend on various factors ranging from growing and harvesting conditions, oil extraction tools and storage practices (Špika et al., Citation2016). Their key function is to protect lipids from peroxidation. A single tocopherol molecule as potential protects 103-108 polyunsaturated fatty acids (PUFAs) at low peroxide values (Sommer & Davidson, Citation2002). Reported that tocopherol content of virgin olive oil ranges between 97 and 785 mg kg−1 and α tocopherol covers 90% share of it, while γ tocopherol occupies 10% share and β tocopherols are found in traces, whereas recent findings disagree with them at delta tocopherols 1087.43 mg kg−1 from oil extracted from green raw olives (exceeding the limit of tocopherol content) and 78.96 mg kg−1 from oil of ripe purple olives that also exceeds from β-γ tocopherol content of oil extracted from ripe olives (53.11 mg kg−1) (Table ). Ripening of olive fruit affects chemical composition of olive oil. Genetics also has a nice play here and species, cultivar or variety with unique genetic details exhibits entirely different chemical compositions of fruit and oil (Youssef et al., Citation2010). Recent findings showed a clear pattern of tocopherol levels with ripening, i.e., high tocopherol content was observed in oils of green olives, whereas a drop was noted when they ripened. Our findings agree with (Špika et al., Citation2016) who reported a decrease in total tocopherol content of olive oil with fruit ripening, whereas he also conclude that tocopherol content was negatively correlated with rainfall. In our findings a decline in tocopherol content was observed in oil extracted from olives harvested in comparatively dry month of sampling year (Figure ).
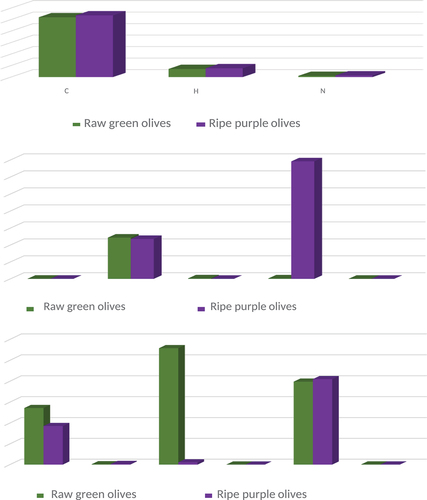
Figure 2. (a): Concentration of carbon, hydrogen and nitrogen (%) in raw green and ripe purple fruits of O. ferruginea. (b): concentration of sodium, potassium, manganese, iron and zinc (mg kg-1) in raw green and ripe purple fruits of O. ferruginea. (c): concentration of bromine, cobalt, chromium, samarium and thorium (mg kg-1) in raw green and ripe purple fruits of O. ferruginea.
3.4. Mineral composition of olive fruits
Carbon (52.04% in green olives and 53.68% in ripe purple olives) and hydrogen (7.08% in raw olives and 7.69% in ripe purple olives) showed least/negligible variation with change kin ripening stages. So, it can be stated that olive ripening least affects carbon and hydrogen content of fruit. Nitrogen (1.07% in green raw olives and 1.44% in ripe purple olive) did not show much fluctuation with ripening (Table ) Among the measured mineral levels in the fruits of O. ferruginea, potassium (12190 mg kg-1 in green raw fruit and 11,800 mg kg-1 in ripe purple olive fruit) was very high when compared with who reported 400.7 mg kg1 potassium in ripe fruits of O. ferruginea. Results of iron ranges between 140 mg kg−1 to 34,600 mg kg−1 for raw and ripe olives, respectively. Here again 140 mg kg−1 is near the results of Abbasi with 123.9 mg kg−1 iron, but a huge boost in iron concentration was reported in our findings when olive fruit turned ripe and purple. That much iron in ripe olive fruits of Zhob is a valuable information to initiate a full-length study on use of olive fruit as a rich source of iron. Locally, these ripe olives are orally used by pregnant and anemic old-age women to treat iron deficiency and weakness. Interestingly, there is a positive correlation between Fe content and total phenolic content of olive fruits according to Centinkaya, 2016. Same correlation was noticed for Ca, Mg, Fe, Zn and Mn, whereas a negative correlation was recorded between elements and total flavonoid content, but these findings do not match with ours. In our results a decline in TPC and TFC values was recorded when fruit changes from green to purple. Sodium (40.3 mg kg−1 for green olives and 25.43 mg kg-1 purple ripe olives) is again below concentration of sodium described by Abbasi, (Na = 47.78 mg kg1) in ripe fruits of O. ferruginea collected from lesser Himalayas. Manganese 147 mg kg−1 in raw green olive fruits drops to 7.35 mg kg−1 in ripe purple olives. Strontium showed negligible fluctuations between two ripening stages, i.e., 19.9 mg kg−1 in green olives and 20.51 mg kg−1 in purple ripe olives. These are almost half of strontium found in olives analyzed by (44.91 mg kg−1). Relatively lower contributions were shown by cobalt (0.09–0.16 mg kg−1), samarium (0.0120.019 mg kg−1) and thorium (0.0420.033 mg kg−1) in green raw and purple ripe olives. Bromine concentration showed a decline as fruit ripened (13.6 mg kg−1 in raw green olives and 9.29 mg kg−1 in purple ripe olives). Chromium concentration showed a peculiar pattern with 27.9 mg kg−1 in raw green olives while drops to 0.55 mg kg−1 as fruit get ripened and changes its colour to purple. Zinc concentration also drops from 19.4 mg kg−1 to 6.63 mg kg−1 as fruit changed its colour from green to purple, i.e., got ripened. Reported the use of olive fruit as skin cleanser (Figure ). Ethnobotanical evidences about use of olive fruit by weak old-age people, kids and pregnant anemic woman as tonic can be easily correlated with its higher than reported usual potassium and iron content (Figure and Table ).
Table 4. Elemental composition of unripe green and ripened purple fruits of O. ferruginea collected from the district Zhob, Balochistan, Pakistan, by CHNS-O analyzer and FAAS
Table.5. Elemental composition of unripe green and ripened purple fruits of ferruginea collected from the district Zhob, Balochistan, Pakistan, by INAA
Figure 3. Interval plot of alpha, beta, gamma and delta tocopherols against oil (1= oil from green raw olives, 2= oil from ripe purple oives).
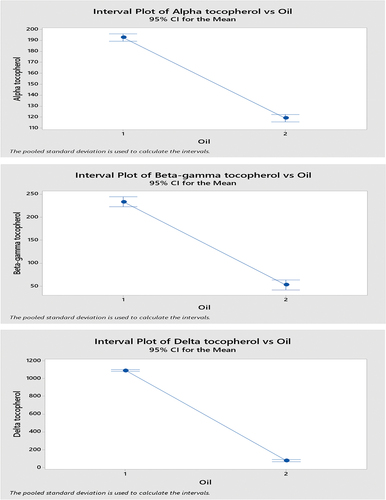
Figure 4. Interval plot of total tocopherol against oil (1= oil from green raw olives, 2= oil from ripe purple olives).
4. Conclusion and recommendations
Fruit of Olea ferruginea is small-sized and commercially underutilized and a way neglected species of olive. Fruits need a thorough investigation to check its nutraceutical importance specially as they are locally used as a tonic to cure anemia, and amazingly, its iron content reaches its peak when olive turns purple and ripe. Ripe olive fruit is exceptionally rich in iron content. Catechin being a strong antioxidant found in good amount in olive oil of both unripe green and ripe purple olives is an indication of its better shelf life. Unexpectedly high levels of delta tocopherols seem to make the oil safe for cooking purposes as they resist the heat stress well to avoid deterioration of natural array of benefits. It seems that a sharp and sudden drop in total tocopherols happens with fruit ripening.
Pakistan is in need of edible oil. Cultivated olives are grown and commercially used to produce oil, large part of which is exported. Oil of O. ferruginea is edible and can fulfil local need of oil. Clinical study is required to unveil potential benefits of each of phenols and fatty acids in vivo and in vitro. There is a need for an extensive study on interrelationship of every mineral with individual phenols in fruits and oil of olive to unveil the true role of each mineral in biosynthesis and fluctuation of polyphenols.
Disclosure statement
No potential conflict of interest was reported by the author(s).
References
- Boskou, D., Blekas, G., & Tsimidou, M. (2006). Olive oil composition olive oil. Elsevier.
- Castro-Barquero, S., Lamuela-Raventós, R. M., Doménech, M., & Estruch, R. (2018). Relationship between Mediterranean dietary polyphenol intake and obesity. Nutrients, 10(10), 1523. https://doi.org/10.3390/nu10101523
- Charoenprasert, S., & Mitchell, A. (2012). Factors influencing phenolic compounds in table olives (Olea europaea). Journal of Agricultural and Food Chemistry, 60(29), 7081–12. https://doi.org/10.1021/jf3017699
- Cicerale, S., Conlan, X. A., Sinclair, A. J., & Keast, R. S. (2008). Chemistry and health of olive oil phenolics. Critical Reviews in Food Science and Nutrition, 49(3), 218–236. https://doi.org/10.1080/10408390701856223
- Criado, M., Motilva, M., Goni, M., & Romero, M. (2007). Comparative study of the effect of the maturation process of the olive fruit on the chlorophyll and carotenoid fractions of drupes and virgin oils from arbequina and Farga cultivars. Food Chemistry, 100(2), 748–755. https://doi.org/10.1016/j.foodchem.2005.10.035
- Difonzo, G., Squeo, G., Calasso, M., Pasqualone, A., & Caponio, F. (2019). Physico-chemical, microbiological and sensory evaluation of ready-to-use vegetable pâté added with olive leaf extract. Foods, 8(4), 138. https://doi.org/10.3390/foods8040138
- García‐González, D. L., Aparicio‐Ruiz, R., & Aparicio, R. (2008). Virgin olive oil‐chemical implications on quality and health. European Journal of Lipid Science and Technology, 110(7), 602–607. https://doi.org/10.1002/ejlt.200700262
- Montedoro, G., Servili, M., Baldioli, M., & Miniati, E. (1992). Simple and hydrolyzable phenolic compounds in virgin olive oil. 1. Their extraction, separation, and quantitative and semiquantitative evaluation by HPLC. Journal of Agricultural and Food Chemistry, 40(9), 1571–1576. https://doi.org/10.1021/jf00021a019
- Nergiz, C., & Engez, Y. (2000). Compositional variation of olive fruit during ripening. Food Chemistry, 69(1), 55–59. https://doi.org/10.1016/S0308-8146(99)00238-1
- Parkinson, L., & Cicerale, S. (2016). The health benefiting mechanisms of virgin olive oil phenolic compounds. Molecules, 21(12), 1734. https://doi.org/10.3390/molecules21121734
- Ramirez-Tortosa, M. C., Granados, S., & Quiles, J. L. (2006). Chemical composition, types and characteristics of olive oil. CABI Publishing.
- Sommer, A., & Davidson, F. R. (2002). Assessment and control of vitamin a deficiency: The annecy accords. The Journal of Nutrition, 132(9), 2845S–2850S. https://doi.org/10.1093/jn/132.9.2845S
- Špika, M. J., Kraljić, K., & Škevin, D. (2016). Tocopherols: Chemical structure, bioactivity, and variability in croatian virgin olive oils products from olive tree. InTech.
- Youssef, N. B., Daoud, D., Zarrouk, M., Nouairi, I., Youssef, N. B., Daoud, D., & Zarrouk, M. (2007). Influence of fruit ripening and crop yield on chemical properties of virgin olive oils from seven selected oleasters (Olea europea L.). Journal of Agronomy, 6(3), 388–396. https://doi.org/10.3923/ja.2007.388.396
- Youssef, N. B., Zarrouk, W., Carrasco‐Pancorbo, A., Ouni, Y., Segura‐Carretero, A., Fernández‐Gutiérrez, A., & Zarrouk, M. (2010). Effect of olive ripeness on chemical properties and phenolic composition of chétoui virgin olive oil. Journal of the Science of Food and Agriculture, 90(2), 199–204. https://doi.org/10.1002/jsfa.3784