
 ?Mathematical formulae have been encoded as MathML and are displayed in this HTML version using MathJax in order to improve their display. Uncheck the box to turn MathJax off. This feature requires Javascript. Click on a formula to zoom.
Abstract
The planting industry plays a significant role as both a source of global greenhouse gas emissions and a carbon sink system. It is crucial to clarify the carbon sources and sinks of the planting industry for the development of low-carbon agriculture. This study calculates the carbon sources and sinks of the planting industry based on crop data from 2000 to 2020 and utilizes the Theil index for further analysis. The results indicate that the total carbon sources of the planting industry in China initially increased and then decreased, ranging from 75.71 million tons to 98.22 million tons, with an average annual growth rate of 2.06%. On the other hand, the carbon sinks of the planting industry increased from 563.805 million tons to 864.42 million tons, reflecting a 53.32% increase. Notably, the national net carbon sinks demonstrated a steady growth trend, rising from 488.10 million tons in 2000 to 766.21 million tons in 2020. Secondly, the differences of carbon sources and sinks have increased and the distribution differences were basically differences within regions. Thirdly, with regionally unbalanced distribution, there were obvious differences in the variation of regional net carbon sinks. Guangxi had the highest level of net carbon sinks. Consequently, the development of a low-carbon planting industry necessitates reduced reliance on agricultural inputs and the formulation of region-specific agricultural carbon reduction policies. It also involves exploring the potential for agricultural carbon reduction in each region, promoting regional cooperation, and improving the mechanism for dividing regional tasks.
1. Introduction
The issue of climate change has become a common concern of mankind all over the world (Ramanathan et al., Citation2022). Over the past 40 years, ozone depletion and climate change are affecting human health and ecological stability (Barnes et al., Citation2019). Food security, as one of the goals of sustainable development, is also deeply affected by it (Fujimori et al., Citation2019). The main cause of climate change is the emission of greenhouse gases, which may lead to frequent occurrences of extreme weather. As one of the most severe challenges facing the current society, it has brought serious threats to the survival and development of human beings all over the world (Payne et al., Citation2022; Wang et al., Citation2022). The global average temperature was 1.2°C above pre-industrial levels in 2020, which was one of the three warmest years since full meteorological observers became available. The way to mitigate and adapt to climate change has become an urgent global issue. IPCC pointed out that in order to achieve the goal of controlling the atmospheric temperature rise above the industrial level by 2°C, or even within 1.5°C by the end of this century, actions must be taken to reduce greenhouse gas emissions. Various governments and international organizations have drafted and passed numerous laws and bills to address global warming, such as the United Nations Framework Convention on Climate Change, the Kyoto Protocol, and the Paris Agreement (Liu et al., Citation2023). China and the United States are the largest developing and developed countries, respectively, and the two largest emitters of greenhouse gases (Wu et al., Citation2022). In order to address climate change and demonstrate its image as a responsible power, China pledged at the 75th UN General Assembly to strive to achieve carbon peaking by 2030 and carbon neutrality by 2060 (Lu et al., Citation2022). Carbon neutrality means that carbon dioxide emissions into the atmosphere are offset by the removal of carbon dioxide from the atmosphere, which requires systemic changes in socioeconomics (Jia et al., Citation2022).
Planting industry carbon emissions are a significant source of greenhouse gas emissions (Wang et al., Citation2022). According to the data from the Food and Agriculture Organization of the United Nations (FAO), global greenhouse gas emissions from agricultural production and food systems have increased to 17% (Wang et al., Citation2023). As the most critical production method in China, the planting industry bears the responsibility of food security, ensuring farmers’ income, and serves as an important barrier to natural ecological environment. However, due to excessive reliance on agricultural inputs such as pesticides, agricultural films, and fertilizers in agricultural production, the high emission characteristics of the planting industry have gradually become prominent in recent years. In addition, greenhouse gas emissions such as N2O and CH4 are generated during crop production. Shifting from extensive production with pesticide and fertilizer consumption, high-intensity tillage and irrigation, and improper waste disposal to low-carbon agricultural production has become an important means for the planting industry to achieve emission reduction. The planting industry also has a good carbon sequestration function and occupies a special position in the climate (Guotong et al., Citation2022). It has two major characteristics, carbon source effect and carbon sink effect, with the carbon sink effect producing positive externality and the carbon source effect producing negative externality (Cui et al., Citation2022), making an important contribution to agricultural carbon emissions. Therefore, studying the carbon source and carbon sink of the planting industry and calculating the current state of net carbon sequestration is of utmost significance for guiding the development of ecological, green, and low-carbon agriculture.
In recent years, relevant scholars have conducted extensive research on carbon sources and sinks in the planting industry in China, providing valuable references for this paper. Firstly, some scholars calculated the carbon source and sink of planting industry, and proposed scientific emission reduction measures. For example, Li et al. (Citation2023) found that the carbon sinks of the planting industry remained relatively stable before 2008, increased from 2008 to 2015, and have remained largely unchanged since then. Guan et al. (Citation2023) estimated the indirect and direct carbon emissions caused by the planting industry and found that the carbon emissions in Henan Province were higher than in other provinces in 2019 but showed a decreasing trend. Li et al. (Citation2023) found that the carbon sinks of the planting industry was relatively stable before 2008, increased from 2008 to 2015, and remained basically unchanged after 2015. Furthermore, the carbon sinks of the planting industry was much higher than the carbon emissions. Secondly, some scholars have focused on the influence of different factors on carbon emissions and carbon sinks in the planting industry. Song et al. (Citation2023) calculated the carbon emissions from agricultural inputs from 1991 to 2019 and used ridge regression analysis to identify driving factors. They found that fertilizer input, agricultural industry structure, and energy intensity had a significant positive correlation with carbon emission intensity. Urbanization rate, agricultural investment, and planting scale had a significant negative correlation with carbon emission intensity. Tang and Chen (Citation2022) found that agricultural land circulation had a positive effect on carbon emissions in the planting industry, with agricultural input playing an intermediate role between agricultural land circulation and carbon emissions. Some scholars have also focused on studying the net carbon sinks in the planting industry. For example, Ye et al. (Citation2023) used the SDID model and found that policies in major grain-producing areas significantly improved their net carbon effects. However, due to the agglomeration effect in major grain-producing areas, the policies indirectly inhibited the net carbon effects in neighboring provinces. Ma et al. (Citation2022) believed that rural population structure affected the agricultural net carbon sink through the planting structure index and input structure index. The quantity and quality structure of the rural population had a significant positive impact on the agricultural net carbon sink, while the age structure of the population had a significant negative impact on the agricultural net carbon sink. In summary, research on agricultural carbon sources and sinks has been relatively advanced, but there are still limitations. Most studies have focused on measuring agricultural carbon emissions, with limited research on carbon sequestration. The research scope and calculation methods of agricultural carbon emissions are also inconsistent. Furthermore, while there are more studies on specific regions in China, such as Shandong and Jiangsu, which are major grain-producing areas, there is a lack of research on the overall temporal and spatial differences of carbon sources and sinks nationwide. Therefore, this paper calculates the temporal and spatial differences in carbon sources and sinks in the planting industry in 31 provinces, municipalities, and autonomous regions of China (excluding Hong Kong, Macao, and Taiwan) from 2000 to 2020. The reasons for these differences are analyzed using the Theil index, and the pathways for achieving low-carbon agricultural transformation in China are explored. Finally, feasible strategies and recommendations to promote carbon emission reductions in Chinese agriculture are proposed.
Compared with previous studies, this paper’s marginal contributions are as follows: (1) In terms of research scope, existing studies mostly focus on national or provincial-level carbon emissions in the planting industry, with fewer literature comparisons and analyses of regional differences. Therefore, this paper comparatively analyzes the carbon emissions in the planting industry among the four major regions and eight major economic zones. (2) In terms of research content, few existing studies combine carbon emissions in the planting industry with carbon sinks for analysis. This paper considers the dual attributes of the planting industry as both a carbon source and sink, estimating the carbon emissions and net carbon sequestration in the planting industry. (3) In terms of research methodology, this paper uses Theil index to analyze regional differences in carbon sources and sinks in the planting industry, aiming to provide suggestions and references for promoting carbon emission reduction in the planting industry.
2. Methods and data
The carbon sources of planting industry refer to the carbon released in agricultural activities, mainly including the combustion of fossil energy in agricultural machinery, the use of chemical fertilizers, pesticides and agricultural film, soil respiration and straw burning. The carbon sinks refer to a series of activities in which agricultural ecosystems absorb greenhouse gases in the air and then fix them in soil and crops. This study mainly aimed at the targeted discussion of narrow agriculture.
To analyze the differences and internal correlation of different regions, 31 provinces are divided into four major parts of Central, East, West, and Northeast (Table ). Then four major parts are further subdivided into eight agricultural economic zones of North Coast, East Coast, South Coast, Middle Reaches of the Yellow River, Middle Reaches of the Yangtze River, Great Southwest, Great Northwest and Northeast (Zhao et al., Citation2019).
2.1. Calculation of carbon source in planting industry
The calculation of agricultural carbon sources in planting industry mainly includes two parts. The first part is the carbon source caused by the use of agricultural machinery. The formula is (Li & Wang, Citation2023):
Where, is the crop planting area,
is the total power of agricultural machinery, B and C are the conversion coefficients of the crop planting area and the total power of agricultural machinery, which are 16.47 kg/hm2 and 0.18 kg/kW, respectively.
The second part is the carbon sources generated by the input of agricultural factors other than agricultural machinery. In this paper, the emission coefficients are used to calculate. To be specific, the use of chemical fertilizer, pesticide, agricultural film, agricultural diesel and irrigation area are taken as the main sources of carbon emissions. The calculation formula is (Li & Wang, Citation2023):
Where, k is the types number of agricultural materials, is the consumption of agricultural materials, that is, the usage of the agricultural input element i.
is the carbon emission coefficient of the agricultural material i. The emission coefficients of various agricultural materials are shown in Table (Li & Wang, Citation2023).
Table 1. Regional division concerning carbon sources and carbon sinks
Table 2. Carbon emission coefficients of different agricultural input factors
2.2. Calculation of carbon sink in planting industry
In terms of planting carbon sinks, this paper mainly calculates the carbon sequestration effect of crop photosynthesis, and takes rice, wheat, corn, beans, peanuts, rapeseed, cotton, potato, tobacco, vegetables, melons and other crops as the main sources of planting carbon sinks. The calculation formula is (Huang et al., Citation2022):
where the carbon required by crops to synthesize unit organic matter through photosynthesis,
is the output of the crop,
is the water content of the crop,
is the economic coefficient of the crop. The specific parameters are shown in Table (Huang et al., Citation2022):.
Table 3. Economic coefficients and carbon absorption rates of main crops
2.3. Analysis of Theil index
Theil index analysis can further subdivide the carbon emissions and carbon sinks of planting industry, and depict whether the overall difference is caused by differences between regions or differences within regions. In this paper, 31 provinces are divided into eight agricultural economic zones, and then the levels of carbon sources and carbon sinks are split. represents the differences within regions, and
represents the differences between regions. Therefore, the differences in carbon sources and carbon sinks within regions and between regions can be further measured, and finally the Theil index and the contribution rate of each region can be calculated (Cui et al., Citation2022)
Where, i and j are the number of regions and the number of provinces in the region, respectively, TC is the carbon emissions or carbon sinks of the national planting industry, is the carbon emissions or carbon sinks of the regional planting industry,
is the carbon emissions or carbon sinks of the planting industry of province j in region i, Y is the gross product of the national planting industry,
is the gross agricultural regional product,
is the gross agricultural product of province j in region i, T is the overall differences of carbon emissions or carbon sinks of planting industry,
is the differences between regions,
is the differences within regions.
2.4. Data source
The data on fertilizer application, pesticides, agricultural film, etc. used in this article are sourced from the “China Statistical Yearbook” (2000–2021) compiled by the National Bureau of Statistics and the statistical yearbooks of various provinces and cities. The data on crops such as wheat and corn are sourced from the “China Rural Statistical Yearbook” (2000–2021) compiled by the Rural Social and Economic Survey Department of the National Bureau of Statistics. The descriptive statistics table for the main variables is as follows (Table ):
3. Results
3.1. Evolution trend of overall carbon situations
3.1.1. The carbon sources of planting industry increased first and then decreased
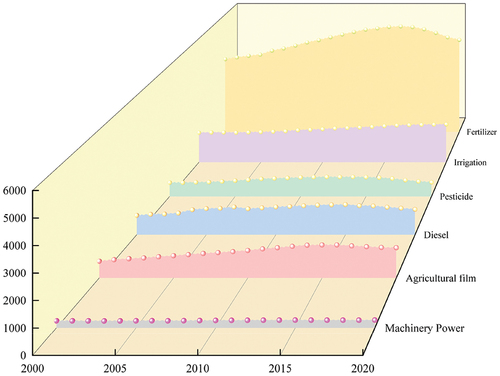
The carbon sources of planting industry in China increased first and then decreased (Figure ). From 2000 to 2015, the carbon sources of the planting industry in China increased from 75.71 million tons to 109.74 million tons, an increase of 34.03 million tons, representing a growth of 44.95%. From 2016 to 2020, the carbon sources of the planting industry decreased from 109.02 million tons to 98.22 million tons, a reduction of 10.81 million tons, accounting for a decrease of 9.91%. Mainly due to changes in agricultural input factors such as fertilizers, pesticides, and agricultural film, the amount of fertilizer in 2015 increased by 6.63 million tons compared with 2016. Structurally, fertilizer and irrigation are the main sources of carbon sources. Among them, fertilizer contributes the most to the carbon sources, reaching 49.50%. In addition, due to the adjustment of the planting structure and the guiding role of the market economy, the land area of vegetables, fruits and other crops has increased, and the demand for fertilizer has also increased, which reflects the high dependence of agricultural production on fertilizer. Agricultural film and diesel are two rising sources of emissions, but their share will be only 12.60% and 11.16% respectively by 2020. Other sources of emissions showed a downward trend. In terms of reducing total emission sources, fertilizer, as one of the main emission sources, has great potential to reduce emissions.
Figure 1. Overall characteristics of carbon sources of planting industry in China during 2000–2020(ten thousand tons).
3.1.2. The carbon sinks of planting industry have increased significantly
From 2000 to 2020, the total carbon sinks of planting industry in China jumped from 563.81 million tons to 864.42 million tons, with an increase of 53.32% and an average annual growth rate of 2.06% (Figure ). In view of the year-on-year growth rate, changes in carbon sinks could be divided into three situations. Firstly, three obvious decline periods were 2002–2003, 2008–2009 and 2015–2016, decreasing by 4.90%, 1.26% and 3.54%, respectively. Secondly, the large rising periods (more than 5%) were 2003–2004, 2005–2006, 2008–2009 and 2016–2017, increasing by 8.12%, 5.05%, 6.36% and 6.77%. The rest were slightly increasing periods. It could be found that there were relatively large changes before 2010. Although there was a drop and a large rise after 2010, the overall change has slowed down. From 2018 to 2020, the annual year-on-year growth rate was as low as 0.49%, 1.21%, 0.76%.
Figure 2. Overall characteristics of planting carbon sinks in China from 2000 to 2020 (ten thousand tons).
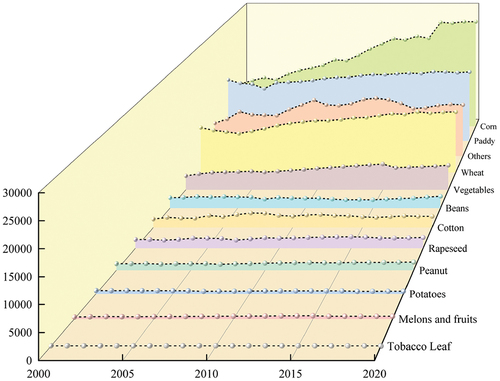
From a structural perspective, rice, wheat, and corn are the fundamental components of carbon sinks in the planting industry. By 2020, these three crops together accounted for 67.31% of the total carbon sinks in the planting industry. From 2000 to 2020, except for corn and vegetables, the proportion of carbon sinks in other crops showed a downward trend. While the proportion of vegetables ascended very little (0.86%). The proportion of corn changed the most, its carbon sinks proportion increasing from 19.26% to 30.89%, and become the largest contributor in 2007. Rice saw the biggest descend, decreasing from 26.98% to 19.84%, but it remained the second-largest crop of carbon sinks. In 2020, in descending order, the share of carbon sinks of several major crops are corn, paddy, wheat, vegetables, beans, cotton, rapeseed, peanut, potatoes, melons and fruits and tobacco leaf. There were huge differences in carbon sinks among crops. The carbon sinks of corn were 1019 times that of tobacco leaf and 49 times that of potatoes. The level of carbon sinks in different crops have certain reference significance to adjust the agricultural industrial structure and achieve carbon peak and carbon neutrality targets.
3.1.3. The net carbon sinks of planting industry grew steadily
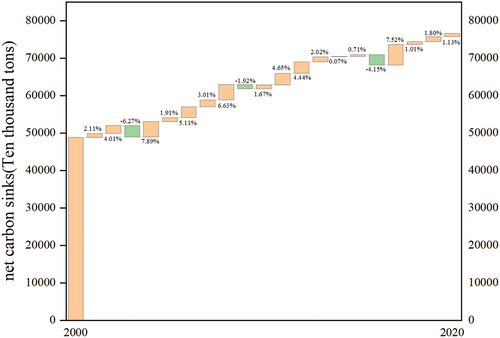
The difference between carbon sinks and carbon sources were the net carbon sinks (Figure ). From 2000 to 2020, the national net carbon sinks showed an overall increasing trend, rising from 488.10 million tons in 2000 to 766.21 million tons in 2020, with an increase of 56.98% and an average annual growth of 2.17%. It was mainly because the growth of carbon sinks have promoted the increase of net carbon sinks. In 2003, 2009 and 2016, the change range of carbon sinks were −4.90%, −1.26% and −3.54%, respectively, and the change range of carbon sources were 1.64%, 2.87% and −0.65%, respectively. Therefore, the net carbon sinks consequently fell during this period, and the growth of carbon sinks was the main driving force for the growth of net carbon sinks. Since 2017, the growth rate of carbon sinks was greater than that of carbon sources, coupled with the application of agricultural science and technology and the improvement of farmers’ environmental awareness, there are still great development potential of carbon sinks. Therefore, the net carbon sinks would continue to increase in the coming period.
Figure 3. Overall characteristics of net carbon sinks of planting industry in China from 2000 to 2020(ten thousand tons).
3.2. Spatial analysis of carbon sources and carbon sinks in planting industry
3.2.1. Differences in carbon sources between regions and provinces
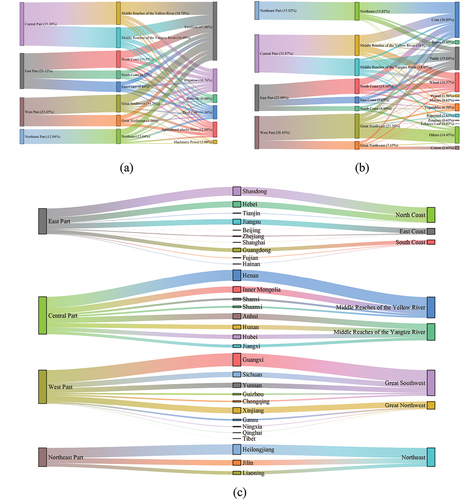
The carbon emissions from the planting industry in all four major regions have shown varying degrees of increase Figure . The Eastern region had the smallest increase, at 12.92 million tons, while the Central region had the largest increase of 913.92 million tons. The Northeast region had the highest increase, at 72.51%, primarily due to a 70.92% increase in fertilizer usage from 2000 to 2020. The East and Central Parts accounted for the highest proportion of the national carbon sources, with the sources of the two parts reaching 64.51% in 2020. In addition, the proportion of the East Part was higher than that of the Central Part before 2009, but after 2010, the Central Part was higher than that of the East Part, with 6.26% higher in 2020. The change trend of the East Part can be divided into two periods. The period from 2000 to 2007 was a growth phase, with carbon emissions reaching a peak of 34.17 million tons in 2007, an increase of 20.01%. The year of 2008–2020 was the decline period, with a decrease of 14.06%. In general, it could be concluded that the increase in the East Part was small and the change was gentle, indicating that the East Part played a certain role in restraining agricultural carbon sources. The Central, West and Northeast Part had similar change trends, with the tendency of rising first and declining then. Their carbon sources reached the peak in 2015, 2016 and 2016 respectively, indicating a certain effect in the emission reduction in recent five years.
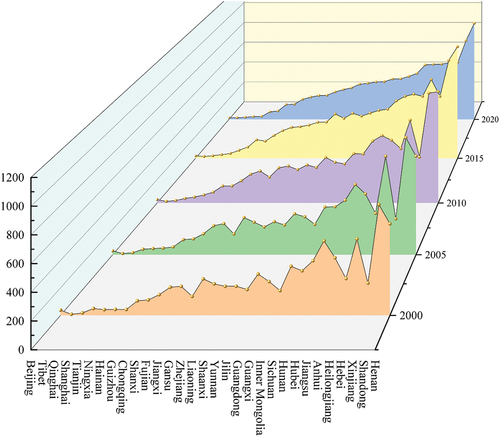
Figure 4. Regional distribution of carbon sources, carbon sinks and net carbon sinks of planting industry during 2000–2020 (a: carbon sources; b: carbon sinks; c:net carbon sinks, ten thousand tons).
From the perspective of eight economic zones, a downward tendency of carbon sources can be found in North and Eastern Coast. Both witnessed a rise first and fell then, peaking in 2008 and 2011, respectively. In 2000, the Northern Coast accounted for the highest proportion of carbon sources, and was overtaken by the Middle Reaches of the Yellow River after 2010. The top three emission zones changed from the Northern Coastal, the Middle Reaches of the Yellow River and the Middle Reaches of the Yangtze River to the Middle Reaches of the Yellow River, the Middle Reaches of the Yangtze River and the Great Southwest. The Great Northwest had the highest change rate, reaching 104.14%, of which Xinjiang and Tibet were the main contributors.
In view of the provincial analysis, Tibet had the lowest carbon sources from 2000 to 2020, provinces with the largest carbon sources followed were Shandong, Henan, Hebei, Jiangsu, Anhui, Hubei, Shandong, Henan, Hebei, Jiangsu, Anhui, and Hubei (Figure ). Represented by East and Central China, the carbon sources of Jiangsu were 68.56 times that of Tibet. Six provinces showed negative growth, including Beijing, Shanghai, Tianjin, Shandong, Jiangsu and Hebei, which are all in East region, with a drop of 61.78% in Beijing. Xinjiang had the highest increase rate and there were four provinces with an increasing rate of more than 100%, followed by Xinjiang (138%), Inner Mongolia (118.55%), Tibet (104.53%) and Heilongjiang (101.35%). Provinces with the largest increase amount were Xinjiang, Henan, Heilongjiang, Inner Mongolia and Jilin. As a non-major grain producing province, Xinjiang ranked eighth in carbon sources from 2000 to 2020. It was mainly because of the increased use of agricultural materials, among which the use of agricultural fertilizer increased by 2.13 times, the use of agricultural film rose by 1.94 times and the use of diesel added by 1.15 times. Therefore, according to the actual and reasonable needs of Xinjiang, the agricultural industrial structure is required to be adjusted, the application of technology should be promoted, and the green agriculture and rural ecological construction are supposed to be strengthened. On the contrary, as major grain producing provinces, the carbon sources of Liaoning, Jilin, Inner Mongolia and Jiangxi were not in the forefront, which was mainly thanks to the effective control of the increase in agricultural input factors and the improvement of the recycling intensity of agricultural production materials. In terms of emission sources, fertilizer was the main source of emissions in 26 provinces in 2020. While agricultural film was the main emission source in Shanghai and Gansu used, diesel was the main emission source in Zhejiang employed. In addition, the main emission source of Tibet and Qinghai was irrigation. The division of provinces according to carbon emission sources was of great significance for carbon sequestration and emission reduction.
Figure 5. Interprovincial distribution of planting carbon sources in China, 2000–2020 (ten thousand tons).
3.2.2. Concentration of planting carbon sources in the central part
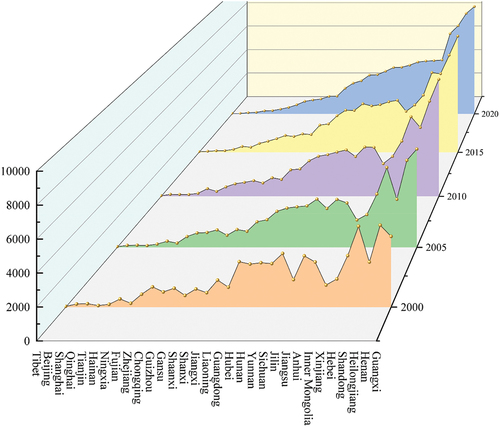
The carbon sinks of planting industry in the four regions showed an increasing trend (Figure , with the largest carbon sinks in the Central Part and the least in the Northeast Part. From 2000 to 2020, the Central Part enjoyed the largest increase of carbon sinks, reaching 101.89 million tons, while the East Part had the least increase, reaching 25.75 million tons. In terms of growth rate, except for the East Part (14.96%), the other three parts grew by more than 50%, and the Northeast Part reached 140.18%. The changes of the East, West and Central Part had their own characteristics. To be specific, the East Part changed gently, experiencing two plunges in 2000–2003 and 2014–2016, with a decline of 11.08 million tons and 9.92 million tons, respectively. The Central Part dropped significantly in 2002–2003 and 2015–2016, but followed by a larger rise in the following year. The obvious decline period of the West Part occurred in 2008–2010 and 2014–2016, with a decline rate of 3.71% and 5.62%, respectively. The Northeast Part had more decline periods than other three parts but with a lager overall fluctuation, compared with the previous year, there were 7 years with an increase of more than 10%.
From the perspective of eight economic zones, the zone with the largest amount of carbon sinks was the Great Southwest, and the zone with the least amount was the Southern Coast. The Middle Reaches of the Yellow River had the largest increase amount (71.7 million tons) and the Northeast witnessed the largest growth rate. Different from other regions, the carbon sinks in the South Coast decreased by 5.57 million tons from 2000 to 2020 in 2020, with a decrease rate of 13.6%, and the peak appeared in 2013 at 41.92 million tons. Its change trajectory can be roughly divided into 2000–2007, 2007–2014 and 2014–2020, with decreasing, rising, and falling. Both decline rates were more than 10%, and the increase rate was 5.95%. The North Coast and the Middle Reaches of the Yangtze River shared similar change progress, with a similar increase and growth range of 33.8% and 30.74%, respectively, and both of which declined to varying degrees in 2016. In the same way, the middle reaches of the Yellow River and the Great Northwest showed similar varieties, both declining in 2003 and 2016. The difference was that the Middle Reaches of the Yellow River had a large decrease in 2003 (16.27%). The East Coast had the least change, with an increase of only 5.57% and 2.57 million tons. In addition, from 2000 to 2008, carbon sinks in the Great Southwest soared by 57.94 million tons, increasing by 41.6%, and then began to fluctuate in 2009–2020, with an increase of only 7.92 million tons. The eight economic zones are ranked from low to high, followed by the Southern Coast (−13.6%), the East Coast (5.57%), the Middle Reaches of the Yangtze River (30.74%), the Northern Coast (33.8%), the Great Southwest (47.97%), the Middle Reaches of the Yellow River (85.32%), the Great Northwest (118.52%) and the Northeast (140.18%). The Central Part, especially the Great Southwest, was the main force for agricultural carbon sequestration.
In view of the provincial level, provinces with the largest carbon sinks were Guangxi, Henan, Shandong, Heilongjiang and Hebei, and there were eight major grain producing provinces in the top ten provinces (Figure ). Specially, the high yield of sugar crops in Guangxi and Yunnan was the principal reason. The total carbon sinks of Liaoning, Inner Mongolia and Jiangxi were not ranked high. Liaoning and Inner Mongolia were constrained by the low yield of paddy, and Jiangxi was subject to the low yield of corn. Provinces with the least carbon sinks were Tianjin, Shanghai, Qinghai, Beijing and Tibet. There were huge differences between provinces. Guangxi, which had the largest carbon sinks in 2020, was 175.9 times that of Tibet. From 2000 to 2020, there were eight provinces sawing the decrease in carbon sinks, including Zhejiang, Fujian, Hainan, Beijing, Shanghai, Guangdong, Guizhou and Tibet. Provinces with an increase rate of more than 100% included Inner Mongolia, Heilongjiang, Xinjiang, Jilin, Liaoning and Guangxi, of which Inner Mongolia increased by 221.33%. In view of structure, corn was the largest contributor to carbon sinks in 11 provinces in 2020, paddy was the largest contributor in 10 provinces, and wheat was the largest contributor in 4 provinces. In addition, it is interesting that rapeseed was the biggest contributor in Qinghai (38.92%), cotton was the biggest contributor in Xinjiang (48.61%), and sugar crops were the biggest contributors to carbon sequestration in Guangdong, Guangxi, Hainan and Yunnan.
Figure 6. Interprovincial distribution of carbon sinks in China’s planting industry from 2000 to 2020 (ten thousand tons).
3.2.3. Different change trends and characteristics of regional net carbon sinks
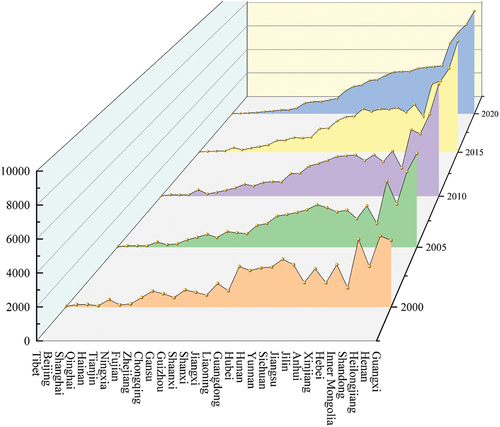
From the perspective of regions Figure , the Central Part enjoyed the highest net carbon sinks and the largest increase. The Northeast Part had the least net carbon sinks but the highest increase, its carbon sinks increased from 50.10 million tons to 124.97 million tons, growing by 149.44%. While the East Part had the lowest increase increasing rate of only 17.84%, which was much lower than the other parts. In addition, its proportion of carbon sinks dropped from 29.42% in 2000 to 22.09% in 2020. Among eight economic zones, the Great Southwest had the highest net carbon sinks, while the South Coast experienced negative growth from 2000 to 2020, with a drop of 18.98%. Although the net carbon sinks in the Great Northwest was not high, its increase rate reached as high as 121.19%. In view of change trajectory, the net carbon sinks of the four major parts and eight economic zones share similar trajectories with their carbon sinks. For example, the net carbon sinks and carbon sinks in the Central Part showed an obvious downward trend in 2003 and 2016, and the decline was close to 11.36% (9.42%) and 3.55% (3.11%), respectively.
In view of the provincial level (Figure ), provinces with declining net carbon sinks consisted of Beijing, Shanghai, Zhejiang, Fujian, Guangdong, Hainan, Guizhou and Tibet. Inner Mongolia, Xinjiang, Heilong, Jilin, Liaoning and Guangxi had the highest increasing rates in net carbon sinks, and the overall characteristics were consistent with the provincial differences in carbon sinks. Besides, Jilin, which ranked the 10th in total carbon sinks and the 15th in total carbon sources, is a key area for agricultural carbon sequestration. While Hubei and Hunan ranked the 6th and 10th in terms of total carbon sources and the 13th and 12th in total carbon sinks, thus targeted measures in the future carbon reduction work should be taken.
Figure 7. Provincial distribution of planting industry net carbon sinks in China from 2000 to 2020 (ten thousand tons).
3.3. Temporal and spatial differences of carbon sources, sinks and net sinks values in China’s planting industry
From the regional point of view, the total carbon sources, total carbon sinks and total net carbon sinks of China’s planting industry have obvious regional differences and spatial characteristics. Among the four major parts of East, Central, West and Northeast, the Central Part had the largest total carbon sources, carbon sinks and net carbon sinks. In four major parts, provinces with the largest carbon sources were Shandong, Henan, Xinjiang and Heilongjiang, and provinces with the largest carbon sinks were Shandong, Henan, Guangxi and Heilongjiang. From the perspective of eight economic zones, provinces with the largest total net carbon sinks were Shandong, Jiangsu, Guangdong, Henan, Anhui, Guangxi, Xinjiang and Heilongjiang. The proportion of their total carbon sinks to the total regional net carbon sinks were 57.79%, 80.64%, 72.54%, 57.33%, 31.33%, 46.35%, 68.88% and 49.68%, respectively. Therefore, it could be found there was a regional imbalance of the net carbon sinks, which had a distinct linear correlation with the regional agricultural output value a certain extent. In addition, the regional differences in net carbon sinks were apparent. Areas with high net carbon sinks were mainly centered in several provinces with high agricultural output value like Guangxi, Henan, Shandong and Heilongjiang. The agricultural output values of these provinces from 2000 to 2020 were 3185.18 billion yuan, 6829.38 billion yuan, 7007.8 billion yuan and 3937.18 billion yuan respectively, and the corresponding net carbon sinks were 1596.64 million tons, 1215.76 million tons, 1016.07 million tons and 932.36 million tons respectively. The net carbon sinks of these provinces were much higher than the national average level, and their total net carbon sinks accounted for 37% of the total national net carbon sinks. This was mainly due to the extensive planting area of crops and cash crops in these provinces, which were also the major crop producing areas in China. Besides, the improvement of net carbon sinks also benefited from the enhancement of agricultural carbon sinks. Regions with low net carbon sinks were mainly divided into two categories. One was Tibet, Qinghai and Ningxia, the other was Beijing, Tianjin, Shanghai and Hainan, whose corresponding agricultural output values were much higher than the total net carbon sinks from 2013 to 2020. Both categories are provinces with low agricultural economic development. The differences among these provinces were that the former category had a high level of urbanization, economy and a small area of agricultural planting, while the latter was mainly because natural conditions and agricultural technology levels placed restrictions on the development of agriculture. The bottom three provinces of net carbon sinks were Tibet, Beijing and Shanghai, with corresponding net carbon sinks of 6.76 million tons, 18.26 million tons and 20.86 million tons, respectively. As the province with the largest net carbon sinks, the net carbon sinks of Guangxi were 236.36 times, 87.43 times and 76.53 times that of the three provinces, respectively. However, the corresponding ranking of agricultural output value was different from the ranking of carbon sinks. Shandong ranked first in agricultural output value, with an agricultural output value of 7,007.83 billion yuan, while the bottom three provinces were Tibet, Qinghai and Beijing, with an agricultural output value of 107.05 billion yuan, 198.67 billion yuan and 260.99 billion yuan respectively. In addition, the agricultural output value of Shandong was 65.46 times, 35.27 times and 26.85 times that of the three provinces, respectively.Therefore, the formulation of reasonable agricultural economic development policies can not only promote the development of agricultural economy, but also improve the level of net carbon sequestration.
3.4. The differences between carbon sources and carbon sinks of planting industry in China
The spatial and temporal pattern of carbon sources and carbon sinks of planting industry reflected the evolution trend of agricultural economy and industrial structure to some extent. Therefore, it is crucial to identify the differences in carbon sources and sinks in order to determine whether there is a positive cycle between economic growth and environmental pressure.
3.4.1. Differences within regions were greater than differences between regions in carbon source
From the overall change trend (Table ), the Theil index extended from 0.014 to 0.046, and the difference widened. In general, the differences within regions were greater than the differences between regions, in which the differences between regions rose from 0.008 to 0.023, with an average annual growth rate of 5.16%, and the differences within regions flourished from 0.006 to 0.023, with an average annual growth rate of 6.61%. For a long time in the early stage, the differences within regions were generally greater than the differences between regions, and the differences between regions were greater than the differences within from 2018 to 2020, indicating that the differences within regions were the main differences in carbon sources in the early stage of economic development, while the differences between regions were the main differences in recent years.
Table 4. Descriptive statistics table for main variables
Table 5. Theil index of carbon sources from 2000 to 2020
From the perspective of the eight economic zones (Table ), in general, the Theil indexes in the North Coast, North Coast and Great Northwest were declining, and the differences in carbon sources among provinces within the region have narrowed. On the contrary, the Theil indexes of the East Coast, Great Southwest, Middle Reaches of the Yellow River, Middle Reaches of the Yangtze River and Northeast were increasing, and the differences among the provinces within the regions have expanded.
Table 6. Theil index of regional carbon sources from 2000 to 2020
3.4.2. Increased regional differences of the development of carbon sinks
From the overall change trend of Theil index (Table ), it rocketed from 0.057 in 2000 to 0.121 in 2020. The Theil index between regions climbed from 0.026 to 0.035 and the Thai index within regions remained upward from 0.031 to 0.086.
Table 7. Theil index of carbon sinks from 2000 to 2020
From 2000 to 2020, the Theil index within regions was larger than the Theil index between regions, and its contribution rate was also higher than that of inter-regional differences. The difference of contribution rate was getting bigger. Only in 2003 and 2005, the difference between regions was higher than the difference within regions for a short time. This indicates that the overall difference in carbon sinks was caused by differences within regions.
In view of the development differences of the eight economic zones (Table ), the Theil index of the North Coast and the Northeast showed a decline trend. The Theil Index of North Coast decreased from 0.009 to 0.004, the Northeast decreased from 0.072 to 0.051, decreasing by 51.56% and 30.13%. The Theil index in other economic zones were on the rise, with the Great Southwest having the highest Theil index of 0.208. Overall, differences within regions were the main source of differences in the level of carbon sinks in China. Therefore, the formulation of a regional coordinated development strategy is required to promote agricultural development and enhance the level of carbon sequestration to achieve the double carbon goals, which not only needs to make up for shortcomings between regions, but also considers the development of the provinces within regions.
Table 8. Theil index of regional carbon sinks from 2000 to 2020
4. Conclusions
Based on the construction of the calculation method of agricultural carbon sources and carbon sinks, the carbon sources and carbon sinks of China’s narrow agriculture (planting industry) from 2000 to 2020 are calculated and the spatial and temporal differences of carbon sources and sinks in different regions were analyzed. In addition, based on the analysis of Theil index, the overall regional differences are divided into differences within regions and differences between regions. The main conclusions are provided as follows.
First of all, the total carbon sources of China’s planting industry increased first and then decreased, and the growth period from 2000 to 2015 was about 44.95%. 2016–2020 was the decline period, but it was still an increase of 22.5067 million tons compared to 2000. While carbon sources were growing, carbon sinks were also growing, which were larger than carbon sources, and has maintained a small increase in recent years. Affected by different trends and changes in carbon sources and carbon sinks, the overall net carbon sinks increased steadily. Structurally, chemical fertilizers contributed the most to carbon sources and was the main reason for carbon source changes. Rice, wheat and corn were the main contributors of carbon sinks.
Secondly, in view of regions, the East Part and the Central Part had the highest carbon sources, but the growth of the East Part was not high. At the same time, the Central China was also the region with the largest carbon sinks. The Yellow River Basin in the Central Part has a huge planting industry, which provides an important guarantee for national food security. However, in recent years, the high carbon emissions of agriculture have restricted the development of high-quality agriculture. At the provincial level, provinces with the most carbon sources were mostly concentrated in East China and Central China, and provinces with the most carbon sinks were mostly the main grain producing areas.
Thirdly, the Theil index of carbon sources and carbon sinks increased from 2000 to 2020, which was basically due to the differences within regions.
In recent years, scholars have made calculations on agricultural carbon sources and sinks, but there are differences in the results due to different data and methods. For example, Li et al. (Citation2022) estimated that from 2003 to 2018, China’s carbon emissions from crop cultivation increased and then decreased, reaching the highest level in 2015, followed by a downward trend. This is consistent with the results of this study. Li and Wang’s (Citation2023) results showed that the main source of agricultural carbon emissions is the use of fertilizers. Carbon emissions were relatively stable before 2008, increased from 2008 to 2015, and remained basically unchanged after 2015, which is similar to the results of this study. Additionally, agricultural carbon sinks were estimated to be about 10 times the agricultural carbon emissions. There is a discrepancy with our estimation results, mainly due to different methods used to estimate agricultural carbon sinks. The study mentioned above roughly measured agricultural carbon sinks by multiplying the carbon sink coefficient (αACS) by the arable land area (SA), which is different from this study. Wen et al. (Citation2022) calculated agricultural carbon sources using the IPCC emission factor method, including agricultural materials, rice cultivation, livestock and poultry, agricultural energy, straw burning, and soil. The results showed that China’s total agricultural carbon emissions in 2019 were 1,497.27 million tons of CO2 equivalent, an increase of 39.54% compared to 1991’s 1,073.02 million tons. From 2015 to 2019, agricultural carbon emissions fluctuated greatly, and in 2019, it decreased to 1,497.27 million tons, declining for three consecutive years. There is a significant difference between the agricultural carbon emissions calculated in this study and the study mentioned above, mainly because the latter includes a broader definition of agriculture, including animal husbandry and straw returning. In general, this study is more consistent with the results of Li et al., and on this basis, the carbon sinks of planting industry is estimated, regional differences are calculated, and the time horizon is wider.
5. Discussion after results
A significant share of global greenhouse gas emissions comes from planting industry, which is also a very vulnerable and sensitive sector, vulnerable to temperature changes. China is a traditional agricultural powerhouse, and due to factors, such as technological level, production methods, and planting scale, it generates a huge amount of agricultural carbon emissions every year, accounting for 17% of the total greenhouse gas emissions. Among them, carbon emissions from grain production are one of the important sources and have great potential for reduction. Actively promoting carbon reduction in the planting industry is a prerequisite for achieving the goal of “peak carbon and carbon neutrality”. From the estimation results, the implementation of China’s carbon reduction measures in recent years has effectively promoted the coordinated development of China’s planting industry economy and environment to a certain extent. The reduction of carbon emissions in the planting industry and the increase in carbon sequestration will become an important driving force for China to achieve its “dual carbon” goals. However, the emission sources and regional differences in the planting industry still reveal the significant pressure of carbon reduction. Fertilizer is the largest source of carbon emissions in the planting industry, and from 2000 to 2020, the carbon emissions from fertilizer accounted for 49.03% of the total carbon emissions in the planting industry. The growth of fertilizers and other agricultural materials ensures stable and increased agricultural production. In the early days of the founding of New China, the amount of fertilizer used was about 80,000 tons, and by 2020, the amount of fertilizer used reached 52.51 million tons, making China the world’s largest producer and user of fertilizers. At the same time, it is also the second largest producer of pesticides and the largest consumer. Due to the law of diminishing marginal returns, the current cost of fertilizer application has exceeded the potential output benefits it can bring, and excessive use of fertilizers has a restraining effect on grain production efficiency. One reason is that China is a typical large country with small-scale farmers, and the decentralization of small-scale farmers has led to increased costs for the promotion and application of low-carbon technologies. At the same time, the transfer of young labor force in rural areas has weakened the overall economic, technological, and cultural capabilities of the surplus labor force in rural areas, making it difficult to effectively implement and implement modern agricultural policies. One of the effective ways to achieve long-term sustainable development is to improve energy efficiency (Hong et al., Citation2022). Therefore, a key measure to promote low-carbon transformation in crop production is to enhance the efficient utilization of agricultural materials such as fertilizers, pesticides, and agricultural films.
From the previous text, it can be seen that regional differences are the main reason for the overall differences in carbon emissions and carbon sinks in the planting industry. Provinces within the region have significant differences in natural conditions, economic development level, agricultural structure, and resource endowments. For example, Hebei Province, as a major grain-producing province, has a higher carbon emission in the planting industry. In contrast, neighboring economically developed provinces such as Beijing and Tianjin have a lower proportion of the planting industry in their industry structure. Rapid urbanization has driven the restructuring of the agricultural industry, demanding higher requirements for technological innovation, promotion of low-carbon technologies in the planting industry, and the high-quality development of the industry. As a result, carbon emissions from the planting industry have decreased. Some western provinces focus on agricultural cultivation, while others focus on animal husbandry, showing significant differences among provinces. This means that reducing carbon emissions in the planting industry can be achieved by narrowing the differences between provinces. Therefore, it is necessary to strengthen the division of agricultural production and ecological functions based on the unique characteristics of each region and formulate targeted development policies accordingly. The central region is the area with the highest carbon emissions and carbon sinks in the planting industry. The central region is the concentrated area of China’s major grain-producing provinces, and provinces such as Henan and Anhui in the region rank among the top ten in terms of carbon emissions and carbon sinks in most years. The differences in carbon emissions and carbon sinks in different regions of the planting industry are partly due to differences in industrial structure and planting composition. As mentioned earlier, cash crops have lower carbon sink levels, while provinces such as Shandong and Henan, which mainly grow food crops, have higher agricultural carbon sinks than other provinces. At the same time, different provinces are at different stages of agricultural development, and the demand for agricultural materials usually varies. The development models of the industry are not exactly the same, and there may also be similar differences in different stages within the same region, which in turn affects the choice of development strategies.
Although this article estimates that the overall carbon sequestration in the agricultural sector is higher than the carbon emissions, it only calculates the carbon emissions in the planting industry and does not take into account the data from the livestock and fisheries sectors. Agricultural input factors also include the transportation and storage of agricultural products. It is necessary to continuously expand the research perspective to make the calculation of agricultural carbon sources and sinks more accurate, and to conduct more comprehensive analysis in future studies. In addition, there are still some deficiencies in the measurement methods of carbon sources and carbon sinks in China’s planting industry. It is necessary to further improve the measurement method, refine the potential factors affecting the carbon sources and carbon sinks of planting industry, and put forward more targeted suggestions. Lastly, this article only estimates the situation in China, so future research can focus on comparisons between other countries and different countries.
6. Policy recommendations
Based on the above research on the evolution trend and regional differentiation of carbon sources and sinks in China’s planting industry, the following suggestions are put forward:
Firstly, while ensuring the growth of grain production, it is necessary to reduce reliance on agricultural inputs and increase the application of machinery and low-carbon technologies. Fertilizers, pesticides, and agricultural films are the main sources of carbon emissions in planting industries in various regions and provinces. Therefore, the development of low-carbon agriculture requires the scientific and rational use of agricultural materials. Farmers can be encouraged to use efficient and harmless pesticides, promote the use of small-capacity spraying technology and biodegradable, environmentally friendly agricultural films, and establish relevant standards for the use and consumption of agricultural inputs. In addition, diesel fuel is the main fuel for agricultural machinery and causes significant environmental damage. Therefore, it is important to phase out and update agricultural equipment, promote energy-saving and emission-reducing technologies, and adopt low-carbon and energy-saving agricultural equipment. Developing circular planting industries, improving the utilization and recycling rates of agricultural waste, and replacing some input factors with recycled agricultural input waste can also be effective measures.
Secondly, it is necessary to consider the actual conditions of different regions and formulate carbon reduction policies, emphasizing the principle of “suitability and highlighting key areas”. The carbon emission reduction policies in the planting industry at the national level should be coordinated with the carbon emission reduction policies of local governments to avoid carbon shifting in the industry. At the same time, due to differences in resource endowments, planting industry crop planting structure, and output levels, there are significant variations in carbon emissions from the planting industry in different regions. Therefore, it is necessary to develop tailored low-carbon policies for the planting industry in each region. The central region is the key area of carbon emission reduction in planting industry and the concentrated area of grain production. On the premise of ensuring food security, it is important to optimize the crop structure of the planting industry, increase the proportion of grain crops, and promote the green transformation of the planting industry. Meanwhile, the eastern region should play a leading role in the green transformation of the planting industry.
Finally, it is important to improve the mechanism for regional task division. Developed regions such as the eastern region are key areas for carbon emissions and have advantages in economic development. Efforts should be made to increase research and development of low-carbon technologies, utilize coastal advantages for international cooperation, introduce new low-carbon projects, and extend their influence to provinces within the region and neighboring areas. In particular, technologies and funding for emissions reduction should be provided to western regions such as Xinjiang, Tibet, Qinghai, and Ningxia, to harness their carbon sequestration potential and enhance their capacity for carbon reduction. In provinces with high grain production and large carbon emissions, such as Henan Province, measures should be taken to reduce or control the use of agricultural inputs such as fertilizers, pesticides, and agricultural films, while actively exploring the application of clean energy and transforming traditional high-emission production methods. In promoting the optimization and upgrading of the agricultural industry structure, it is important to protect the red line of arable land and advocate for production methods that achieve both increased yield and improved quality.
Disclosure statement
The authors declare that we have no known competing financial interests or personal relationships that could have appeared to influence the work reported in this paper.
Additional information
Funding
References
- Barnes, P. W., Williamson, C. E., Lucas, R. M., Robinson, S. A., Madronich, S., Paul, N. D., Bornman, J. F., Bais, A. F., Sulzberger, B., Wilson, S. R., Andrady, A. L., McKenzie, R. L., Neale, P. J., Austin, A. T., Bernhard, G. H., Solomon, K. R., Neale, R. E., Young, P. J., Norval, M., … Zepp, R. G. (2019). Ozone depletion, ultraviolet radiation, climate change and prospects for a sustainable future. Nature Sustainability, 2(7), 569–21. https://doi.org/10.1038/s41893-019-0314-2
- Cui, Y., Khan, S. U., Sauer, J., & Zhao, M. (2022). Exploring the spatiotemporal heterogeneity and influencing factors of agricultural carbon footprint and carbon footprint intensity: Embodying carbon sink effect. Science of the Total Environment, 846, 157507. https://doi.org/10.1016/j.scitotenv.2022.157507
- Fujimori, S., Hasegawa, T., Krey, V., Riahi, K., Bertram, C., Bodirsky, B. L., Bosetti, V., Callen, J., Després, J., Doelman, J., Drouet, L., Emmerling, J., Frank, S., Fricko, O., Havlik, P., Humpenöder, F., Koopman, J. F. L., van Meijl, H., Ochi, Y.,… van Vuuren, D. (2019). A multi-model assessment of food security implications of climate change mitigation. Nature Sustainability, 2(5), 386–396. https://doi.org/10.1038/s41893-019-0286-2
- Guan, N., Liu, L., Dong, K., Xie, M., & Du, Y. (2023). Agricultural mechanization, large-scale operation and agricultural carbon emissions. Cogent Food & Agriculture, 9(1), 2238430. https://doi.org/10.1080/23311932.2023.2238430
- Guotong, Q., Fei, C., Na, W., & Dandan, Z. (2022). Inter-annual variation patterns in the carbon footprint of farmland ecosystems in Guangdong province, China. Scientific Reports, 12(1), 14134. https://doi.org/10.1038/s41598-022-18425-z
- Hong, Q., Cui, L., & Hong, P. (2022). The impact of carbon emissions trading on energy efficiency: Evidence from quasi-experiment in China’s carbon emissions trading pilot. Energy Economics, 110, 106025. https://doi.org/10.1016/j.eneco.2022.106025
- Huang, J., Sun, Z., & Zhong, P. (2022). The spatial disequilibrium and dynamic evolution of the net agriculture carbon effect in China. Sustainability, 14(21), 13975. https://doi.org/10.3390/su142113975
- Jia, Z., Wen, S., & Liu, Y. (2022). China’s urban-rural inequality caused by carbon neutrality: A perspective from carbon footprint and decomposed social welfare. Energy Economics, 113, 106193. https://doi.org/10.1016/j.eneco.2022.106193
- Li, J., Wang, W., Li, M., Li, Q., Liu, Z., Chen, W., & Wang, Y. (2022). Impact of land Management scale on the carbon emissions of the planting industry in China. Land, 11(6), 816. https://doi.org/10.3390/land11060816
- Li, M., Peng, J., Lu, Z., & Zhu, P. (2023). Research progress on carbon sources and sinks of farmland ecosystems. Resources, Environment and Sustainability, 11, 100099. https://doi.org/10.1016/j.resenv.2022.100099
- Li, S., & Wang, Z. (2023). The effects of agricultural technology progress on agricultural carbon emission and carbon sink in China. Agriculture, 13(4), 793. https://doi.org/10.3390/agriculture13040793
- Liu, J., Ren, Y., Hong, Y., & Glauben, T. (2023). Does forest farm carbon sink projects affect agricultural development? Evidence from a quasi-experiment in China. Journal of Environmental Management, 335, 117500. https://doi.org/10.1016/j.jenvman.2023.117500
- Lu, X., Tong, D., & He, K. (2022). China’s carbon neutrality: An extensive and profound systemic reform. Frontiers of Environmental Science & Engineering, 17(2), 14. https://doi.org/10.1007/s11783-023-1614-3
- Ma, L., Zhang, W., Wu, S., & Shi, Z. (2022). Research on the impact of rural population structure changes on the net carbon sink of agricultural production-take Huan County in the loess Hilly region of China as an example. Frontiers in Environmental Science, 10, 911403. https://doi.org/10.3389/fenvs.2022.911403
- Payne, J. E., Lee, J., Islam, M. T., & Nazlioglu, S. (2022). Stochastic convergence of per capita greenhouse gas emissions: New unit root tests with breaks and a factor structure. Energy Economics, 113, 106201. https://doi.org/10.1016/j.eneco.2022.106201
- Ramanathan, V., Xu, Y., & Versaci, A. (2022). Modelling human–natural systems interactions with implications for twenty-first-century warming. Nature Sustainability, 5(3), 263–271. https://doi.org/10.1038/s41893-021-00826-z
- Song, S., Zhao, S., Zhang, Y., & Ma, Y. (2023). Carbon emissions from agricultural inputs in China over the past three decades. Agriculture, 13(5), 919. https://doi.org/10.3390/agriculture13050919
- Tang, Y., & Chen, M. (2022). Impact mechanism and effect of agricultural land transfer on agricultural carbon emissions in China: Evidence from mediating effect test and panel threshold regression model. Sustainability, 14(20), 13014. https://doi.org/10.3390/su142013014
- Wang, B., Cai, A., Li, Y., Qin, X., Wilkes, A., Wang, P., Liu, S., Zhang, X., & Zeng, N. (2022). Four pathways towards carbon neutrality by controlling net greenhouse gas emissions in Chinese cropland. Resources, Conservation and Recycling, 186, 106576. https://doi.org/10.1016/j.resconrec.2022.106576
- Wang, L., Zhu, R., Yin, Z., Chen, Z., Lu, R., & Fang, C. (2022). Quantifying the spatial–temporal patterns and influencing factors of agricultural carbon emissions based on the coupling effect of Water–land Resources in arid inland regions. Frontiers in Environmental Science, 10, 10. https://www.frontiersin.org/articles/10.3389/fenvs.2022.908987
- Wang, R., Chen, J., Li, Z., Bai, W., & Deng, X. (2023). Factors analysis for the decoupling of grain production and carbon emissions from crop planting in China: A discussion on the regulating effects of planting scale and technological progress. Environmental Impact Assessment Review, 103, 107249. https://doi.org/10.1016/j.eiar.2023.107249
- Wen, S., Hu, Y., & Liu, H. (2022). Measurement and spatial–temporal characteristics of agricultural carbon emission in China: An internal structural perspective. Agriculture, 12(11), 1749. https://doi.org/10.3390/agriculture12111749
- Wu, Z., Huang, X., Chen, R., Mao, X., & Qi, X. (2022). The United States and China on the paths and policies to carbon neutrality. Journal of Environmental Management, 320, 115785. https://doi.org/10.1016/j.jenvman.2022.115785
- Ye, D., Zhen, S., Wang, W., & Liu, Y. (2023). Spatial double dividend from China’s main grain-producing areas policy: Total factor productivity and the net carbon effect. Humanities and Social Sciences Communications, 10(1), 459. https://doi.org/10.1057/s41599-023-01962-x
- Zhao, D., Chen, H., Yu, E., & Luo, T. (2019). PM2.5/PM10 ratios in eight economic regions and their relationship with meteorology in China. Advances in Meteorology, 2019, 1–15. https://doi.org/10.1155/2019/5295726