
 ?Mathematical formulae have been encoded as MathML and are displayed in this HTML version using MathJax in order to improve their display. Uncheck the box to turn MathJax off. This feature requires Javascript. Click on a formula to zoom.
Abstract
The study is being done to assess the availability of feed dry matter (DM) from private holdings and communal lands in relation to livestock demand and to provide management solutions in a smallholder system in Gamo Gofa and Dawuro zones of south western Ethiopia. Data for the study were compiled by combining crop and livestock production information at the household level. The extents of community land cover and land utilisation were calculated using spatial contours in geographic information system (GIS) and field survey results. Monthly feed DM availability by land cover area (ha) was computed using data from the livelihoods early assessment and protection (LEAP) software derived from eight years of normalised differential vegetation index values. According to the study, private land generated 33% of the feed while common land produced 67%. Around 1,300 tonnes of DM were generated as livestock feed per year, with 47% coming from private property and the remaining 53% from communal land. When compared to the existing livestock population, the required amount of DM is only 62% of total supply, yielding a 38% surplus. However, feed shortages are prevalent in the region due to supply inconsistencies. Livestock requirements can be met by employing appropriate management strategies that preserve feed availability from varied land use types and land cover in times of scarcity. Planning and preserving feeds, training communities in the operation and use of available resources, and developing infrastructure for in-situ feed conservation throughout dry season will help smallholder livelihoods and the national economy.
Public interest statement
Since the beginning of time, humanity has come a long way, and national resources have considerably supported the poor's achievement. In prosperous nations, resources are utilised more effectively, which is promoted by careful consideration of resource management. However, Darwin (Sala et al., 2000) stressed the difficulty in identifying the core causes of crises. “I marked all the seedlings of our native weeds as they came up, and out of 357 no less than 295 were destroyed, chiefly by slugs and insects. If turf which has long been mown (and the case would be the same with turf closely browsed by quadrupeds) be let to grow, the more vigorous plants gradually kill the less vigorous. Within the last ten years, large spaces have been enclosed [so that cattle could not enter] and self-sown firs are spaces have been enclosed [so that cattle could not enter] and self-sown firs are fir.”
1. Introduction
Land use for animal production has a number of effects on the earth system (Pereira et al., Citation2023; Phelps & Kaplan, Citation2017). It is often stated that land is a significant challenge and central to the achievement of Sustainable Development Goals. Grazing systems, or grazing ecosystems such as grasslands and shrublands, cover roughly 40% of the global terrestrial ice-free land surface (Erb et al., Citation2007; Lorenz et al., Citation2018; Petermann & Buzhdygan, Citation2021; Reid et al., Citation2005; Wolf et al., Citation2021) and account for one-third of total ecological energy flow appropriated by humans (Erb et al., Citation2016; Haberl et al., Citation2007). Land dedicated to animal production is crucial for supporting dietary needs worldwide, contributing at least 40% of the global agricultural output and securing livelihoods for nearly 1.3 billion people (Steinfeld, Citation2006). Livestock production plays a key role in national and regional economies, for food security and poverty alleviation, the climate system, biodiversity, and the biogeochemical cycles of carbon, nitrogen and water (Erb et al., Citation2016).
Despite the importance of the ruminant livestock sector for food security and various forms of animal production, land use and land cover change studies fail to differentiate between different systems (Phelps & Kaplan, Citation2017). In various farming systems agricultural products are regularly mixed with animal feed, and arable land is not explicitly used for fodder production. According to Van Zanten et al. (Citation2018), livestock in various production systems turns leftovers from arable land and grass resources into valuable food rather than eating on items that are immediately consumed by humans, such as grains. The scientific community acknowledges that uncertainties and data gaps exist in this prospect (Erb et al., Citation2016; Petz et al., Citation2014; Ramankutty et al., Citation2008; Smil, Citation2014; Van Kernebeek et al., Citation2016), although their extent is unknown (Fetzel et al., Citation2017; Van Zanten et al., Citation2018).
These information gaps impede study and comprehension of grazing systems’ roles in the earth system, as well as assessments of their contributions to human well-being. In view of future sustainability challenges such as population growth, dietary changes, climate change, and the objective of replacing fossil fuels with biomass, Fetzel et al. (Citation2017) stated that we must improve our understanding and knowledge of the level of uncertainties. Many other studies have indicated that ensuring sustainable production and sustaining the numerous irreplaceable roles and services provided by livestock to disadvantaged smallholder households are important goals (Garnett, Citation2014; Herrero & Thornton, Citation2013; Malomo et al., Citation2018; Salmon et al., Citation2018).
According to Phelps and Kaplan (Citation2017), the difficulty in identifying land use in space and comprehending how land use evolves over time is the other major constraint to our knowledge of the impact of animal production on land cover. This type of challenge, on the other hand, might be addressed using a bottom-up approach utilising metadata sources. Field surveys, statistical modelling, process modelling, and parameter modelling are now the most often used methods for assessing and quantifying bio-based resources (Feng & Zhao, Citation2011; Hao et al., Citation2009; Luo et al., Citation2012). The aim of this study was to investigate and estimate livestock feed dry matter supply from different land use and land cover in different agro-ecological zones (AEZs) using field survey data and data of normalised differential vegetation index values of eight-year period (2008–2015) derived from the livelihoods early assessment and protection (LEAP) software in Dawuro and Gamo Gofa zones in south western Ethiopia. Additionally, the study offered management suggestions.
2. Materials and methods
2.1. Study area
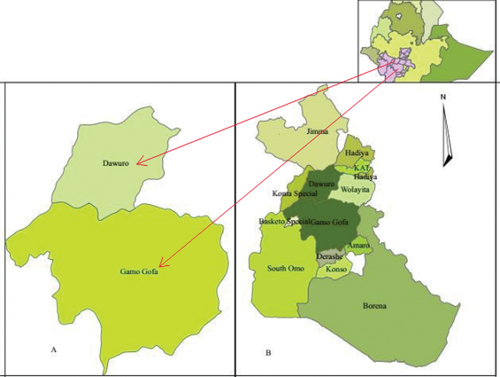
The study was conducted in a smallholder mixed crop-livestock system in Ethiopia’s Southern Nations, Nationalities, and Peoples’ Region (SNNPR) state’s Gamo Gofa and Dawuro zones (Figure ). The area is located between 36° 22′ and 37° 51′ E longitude and 5° 34′ to 7° 21′ N latitude (Amejo, Citation2018). The study area is comprised of intricate landscapes ranging in elevation from 1214 to 2723 meters above sea level. The overall livestock population of the study household in a tropical livestock unit (TLU) was 2145 animals head, which included 1854 cattle, 78 sheep, 138 goats, and 74 horses (Amejo et al., Citation2018a). The study household’s overall average (Mean ± Standard Deviation) farm holdings, herd, and family size were 1.74 ± 1.35, 6.7 ± 2.56, and 6.09 ± 3.40, respectively (Amejo et al., Citation2019).
Figure 1. Map of (a) Gamo Gofa and Dawuro zones in Ethiopia, (b) zones boundary in the direction.
2.1.1. Study design and sampling
The sampling plan and data collection procedure for the investigation are described in earlier works (Amejo, Citation2018; Amejo et al., Citation2018b, Citation2019; Guja, Citation2020). In household interviews, crop residue management, livestock husbandry by type of land use, feeding system, and fodder management were discussed. Estimates of forage, weed, crop residue, and by-product requirements for animal feed were made using information from household interviews. The private holdings and communal land (ha) area coverage of each peasant association (PA) were estimated using the PA’s shape file, the number of population heads, farm size, and number of sampled households. The shape files for the PAs were created using the digital elevation model (DEM), which were then analysed in GIS 10.2. The average farm size (ha) per household obtained during the interview was used to calculate each household’s share of common land per capita (Bouma et al., Citation2012). The per capita population of the sampled PA (the registered owner of farm land) was obtained from the Local Agriculture and Rural Development Office (LARDO). Similarly, the LARDO’s annual chart and other secondary-source data were utilised to assess the PA’s land-cover extent of forestlands, woodlands, shrub/bushlands, and grasslands (Amejo, Citation2018; Amejo et al., Citation2018a). Thus, a communal land use type (LUT) area (ha) was approximated and determined based on field survey, field experience, and secondary source data. The results of the household interviews were used to compute the area (ha) of privately owned LUTs. The availability of feed DM from different LUTs was evaluated for each study region by establishing a functional link with NDVI values collected using LEAP software tailored for Ethiopia conditions.
2.1.1.1. Estimation of communal land area
The total area coverage of the study PA was calculated using the area (ha) of the shape file generated in GIS 10.2, the per capita population of the sampled PA, and the average farm size (ha) of the sample households. Thus, Bf is the privately owned land area (ha) of the total coverage in the PA; Sa is the total land area (ha) of the PA obtained from the shape file in GIS 10.2; fs is the average farm size (ha) of the sample households in the PA; and PN is the sample PA’s per capita population.
The difference between the PA’s total land area (Sa) and privately held land (Bf) divided by the PA’s per capita population (PN) yields the per capita share (Bcf) of sample household communal land.
2.1.1.2. Estimation of feed DM supply from land area
MODIS NDVI measurements (Hoefsloot & Calmanti, Citation2012) were utilised to estimate feed DM from different LUT land area. Three ten-day NDVI values were exported to Excel and aggregated into monthly values for an eight-year period (2008–2015). The aggregated monthly DM (kg/ha) supply at each study site was then adjusted to the model equation provided by Quiroz et al. (Citation1999), which was determined as follows:
Ymk is the potential feed DM (kg) production in month m at site k;
Emk is the DM (kg/ha) calculated from the NDVI value in month m at the sample site k; and
Gjmkf is the area cover (ha) of land-use type j with coefficient factor f in month m at sample site k.
Depending on management conditions, forage consumption is predicted to be one-third to two-thirds of total potential production (Kassam et al., Citation1991). In this regard, the livestock consumption rate was calculated from the area production potential in month m in sample site k as follows.
Ljmk is the amount of feed DM (kg) that livestock consume from the area j production in month m in the sample site k;
Yjmk is land area j feed DM (kg) production in month m in sample site k; and
Cfmk is a coefficient factor f to the amount of feed consumed by livestock in month m in sample site k.
Total digestible nutrients (TDN, kg/kg DM) from area production were calculated using the formula proposed by Reid et al. (Citation1952) with a 60% digestion coefficient.
Tjmk is the total digestible nutrients (kg/kg DM) from the production area j in month m at sample site k; and
Ljmk is the amount of feed DM (kg) that livestock consume from the production area j in month m in the sample site k;
Digestible crude protein (DCP, kg) was calculated as the average summary of feed content in land use category j, as follows:
Pjmk is a digestible crude protein (kg) from the area production j in month m in sample site k;
Tjmk is total digestible nutrients (kg/kg DM) from the area production j in month m at sample site k; and
Uj is a summarised average digestible crude protein content of feedstuffs from land use type j.
Digestible crude protein was calculated to be 72.4 g/kg for natural pasture (Boudet & Rivière, Citation1968), 134.2 g/kg for various forage species (Le Houerou, Citation1980), and 83.0 g/kg for herbaceous from fallow land (Birnin-Yauri et al., Citation2012). The amount of feed produced from food crops such as crop residues, cereals, and roots was calculated using crop-yield equivalents from household interviews. The DM rates were estimated using crop correction factors and utilisation coefficients, as described by Kassam et al. (991). The DM content assumed in the calculation was 92.4% for crop residue, 81% for cereals and pulses, 27% for enset and banana pseudostem, 32.5% for root crops, and 5% for vegetables. TDN accounted for 35% of DM in food crop products, while DCP accounted for 22.5% of TDN (Bakrie et al., Citation1996). The total annual livestock feed supply of DM, TDN, and DCP in the specific sample PA was the sum of feed from common land, private land, and household food crop production.
Estimation of livestock feed requirements. The annual total livestock DM demand is determined by taking into account the maintenance and physiological needs of breeding female animals at sample site k.
Bfeyk is the total annual DM (tonnes) requirement for female breeding animals at sample site k;
Mfey is the total annual DM (tonnes) requirement for female breeding animals for maintenance; and
Pfeyk is the total annual DM (tonnes) requirement for female breeding animals for physiological needs at sample site k.
The total annual feed DM requirement of a breeding cow in sample site k is calculated as:
Pfeyck is breeding cow total annual DM (kg) requirement at sample site k;
Cwtc is breeding cow carcass weight (kg);
Epc is the energy required for milk production;
Lyck is cow’s lactation milk yield (kg) at sample site k; and
Rck is cow’s fertility rate at sample site k.
Similarly, the DM requirement of ewe and doe was calculated as:
Me(d)k is ewe or doe total annual DM (kg) requirement at sample site k;
Cwte(d) is ewe or doe carcass weight (kg);
Epe(d) is the energy required for milk production of ewe or doe;
Lye(d) is lactation milk yield (kg) of ewe or doe; and
Re(d)k is ewe or doe fertility rate at sample site k.
The milk production energy (MJ) value for the cow was 5 and 4.6 for the ewe and doe (Lalonde & Sukigara, Citation1997), with carcass weight for both species being 48% of live weight. Lactation milk yield and fertility rate of cow, ewe, and doe were calculated using data from household interviews. The total yearly DM requirement of ruminant animal at sample site k was determined using the correction factor t by converting the number of animals n in age g and sex x groups into tropical live weight units as follows.
Duqyk is ruminant livestock’s total annual DM requirement at sample site k;
Ungxtk is ruminant livestock number n, age g and sex group x in sample site k in tropical livestock live-weight unit; and
Bfeyk is a female breeding animal total annual DM (tonnes) requirement at sample site k.
The total annual DM requirements of non-ruminant livestock at the sample site k were adjusted to TLU live weight using the formula presented (Lalonde & Sukigara, Citation1997), which was based on correction factor t, age g, sex x, and number of animals n.
Diqyk is non-ruminant livestock total annual DM requirements at sample site k;
Ingxtk is the non-ruminant livestock number n in TLU live-weight unit, in age g and sex x, in sample site k; and
Bfeyk is a female breeding animal total annual DM (tonnes) requirement at sample site k.
The size, age, and sex of the animals were included in the household interview. The overall annual DM demand (tonnes) was the sum of the ruminant and non-ruminant livestock requirements at each sample site. The daily DM requirement of a female breeding animal was 7.8 kg (Kassam et al., Citation1991). TDN for animals was calculated using DM rates, while DCP was calculated using TDN rates. Monthly and annual nutrient (DM, TDN, and DCP) balances were calculated at each sample location as the difference between available to livestock requirements. A person correlation analysis was conducted between available feed DM yields, livestock feed requirements, cow productivity performance, and herd size, with the latter two variables determined from a household interview in the study area. Correlation analysis was performed at the PA level.
3. Results and discussion
3.1. Proportions of feed supply and demand
Private (agricultural) LUT supplied 33% of livestock feed, while communal LUT supplied 67% (Table ). Natural grazing land produced 6% of the feed available from agricultural holdings, while cropland provided 27% (Table ). According to Ethiopia’s Central Statistics Agency (CSA Central Statistical Agency, Citation2011), grazing land accounts for 66% of livestock feed resources. Natural pasture, crop residue, hay, agro-industry by-products, improved fodder, and others account for 54.6%, 31.06%, 6.81%, 1.53%, 0.31%, and 5.11% of the country’s total livestock feed supply, respectively (CSA Central Statistical Agency, Citation2017). Throughout the year, livestock may have access to a variety of feed sources of varying amount and quality (Tahir et al., Citation2018).
Table 1. Land-cover area for actual and potential livestock feed supplies, on an annual basis, for the study peasant administration (PA)
According to the study’s findings, 1,300 tonnes of livestock feed are generated annually from available sources, with 47% coming from private land and the remaining 53% from common land (Table ). In private holdings, 163 tonnes (12%) of total annual feed DM supply came from natural pasture lands, 345 tonnes (27%) from croplands, and 104 tonnes (8%) from grain by-products and crop residues. FAO (Food and Agriculture Organization) (Citation2018) reported that the total annual biomass potential available for animal feeding in Ethiopia is 144.5 million tonnes, with metabolizable energy (ME) and CP contents of 890 × 109 MJ and 7.49 million tonnes, respectively. According to Food (Citation2018), the total annual potential availability of forage DM is around 110 million tonnes, which includes 5.8 million tonnes of stubble biomass, 57.09 million tonnes of grazing forage, and 46.9 million tonnes of crop residues (mostly straw and stover). According to the livestock system classification developed by Seré et al. (Citation1996), 90% of dry matter fed to animals comes from rangelands, pastures, annual forages, and purchased feeds, with less than 10% coming from non-livestock farming activities.
Table 2. Available production and livestock required amount of feed dry matter (DM) (tonnes/year) in the study peasant administration (PA)
The total annual livestock feed DM demand was 805 tonnes, accounting for 62% of the total annual feed DM production (Table ). The average DM demand per cow unit was 5.5 tonnes per year, with Gmra Qema PA requiring the least at 4.4 tonnes and Yalo Worbati PA requiring the most at 7.4 tonnes. This result was consistent with Kassam et al. (Citation1991) estimate of feed DM requirements per herd TLU (kg/day) in non-pastoral systems, as well as the average feed DM (tonnes/year) formulated in a cow unit requirement in the intermediate technology system. The increased yearly feed DM supply in wet lowland locations may be the result of savannah-type grassland conditions (TECSULT, Citation2004). Eastern Africa is a hotspot for grass genetic diversity, and grasslands are either under government control, open to the public, or shared property (Reid et al., Citation2005). Seasonal feed shortage, on the other hand, was detected in dry lowland environments, which is likely connected to the characteristics of forest/shrub biomass as well as recurring droughts.
The total annual DM and TDN production for ruminant livestock was 798 tonnes and 563 tonnes, respectively (Table ). The average annual available DCP production was 48 tonnes. Livestock TDN and DCP demand averaged 359 and 37 tonnes per year, respectively (Table ). A farm-level evaluation of livestock feed balance revealed a critical feed shortage, with only about 49, 81, and 62% of DM, ME, and DCP requirements being met for the prevailing livestock from on-farm production combined with purchased feeds (Tahir et al., Citation2018). Another study in Ethiopia found that the available feed sources only met 72% of the annual DM requirement per household (Amsalu & Addisu, Citation2014). According to Food (Citation2018), the difference between the availability of feed resources as dry matter (DM), ME, and CP and the requirements of all animal species (i.e. feed balance) revealed that Ethiopia has a 9% DM deficiency, while ME and CP deficiencies are 45% and 42%, respectively, indicating a lack of good quality feeds in the country.
Table 3. Annual available and required amount of total digestible nutrient and digestible crude protein for ruminant livestock (tonnes/year) in the peasant administration (PA)
Other research has also found that livestock feed imbalances are common in Ethiopian smallholding systems (Yisehak & Janssens, Citation2014; Zewdie & Yoseph, Citation2014). According to Tahir et al. (Citation2018), livestock continue to survive, reproduce, provide, and perform their essential functions even when severe annual feed shortages are reported to be below maintenance.
There was a significant correlation between available DM and TDN production (r = 0.74, p 0.01). Between the estimated DCP of ruminant livestock required and the available feed DM, a similar significant correlation (r = 0.69) was observed. The latter was also related to the indirectly calculated DCP of various land-use types (r = 0.98, p 0.01). The relationship between feed DM production from available sources and total herd head was significant (r = 0.63, p 0.05). The cow’s lactation-milk yield correlated significantly with each estimated annual average production of DM (r = 0.59), TDN (r = 0.59), and DCP (r = 0.59), respectively. Similarly, the lactation-milk yield of the cow was significantly correlated with the estimated DM and TDN requirements (r = 0.64, p 0.05). The correlation between estimated DCP and lactation-milk yield was not significant (r = 0.50, p > 0.05), whereas the correlation between lactation-milk (r = 0.75) and daily milk (r = 0.60) yields and the average feed DM (tonnes/year) requirement formulated in a cow unit was significant (p < 0.05).
3.2. Implications for management
Table summarises potential management options of feed supply surpluses and shortfalls in the PAs over months. Understanding the agro-ecological capacity, vegetation requirements in relation to relevant environment (humid and hot climates), wet and dry seasons, crop type and cropping season with a diverse range of vegetation is critical.
Table 4. Summary of opportunity windows, for each of the study peasant administrations (PA), by month, for hay-making, conserving hay and crop residues during feed surplus (++/+++), and use of a grazing option, utilisation of conserved hay and crop residues during feed scarcity (±/–)
Feedstuffs are generally available from both grazing and food production sources at the beginning and end of the rainy season, particularly from April to June and October to December (Table ). However, these feedstuffs are not expressly kept for the months of scarcity, particularly January to March and July to August, when the former has a dry season and the latter has heavy cropping activity. During the wet season, cropping activities, along with filthy pasture conditions and land scarcity, provide a particular difficulty in the highland production system. Fire suppresses a substantial amount of bushy grassland in the humid lowland. Conservation and grazing management measures must be implemented to minimise seasonal feed supply shortages. Haymaking and hay conservation (with an emphasis on crop residue management), as well as grazing management, will be critical for the successful implementation of these efforts. Haymaking practices in Ethiopia can be improved and expanded to ensure a consistent and high-quality feed supply throughout the year (Aranguiz & Creemers, Citation2019; Food, Citation2018).
Feed resources should be addressed in a broader context rather than just during an emergency, as is now the case. Institutionalisation of a feed security system is thus required in order for the country to be aware of its demands, resource availability, gaps, implications, and how the gap can be addressed within the country, the region, or beyond (Food, Citation2018). According to FAO report, this will increase the effectiveness of feed projects in the country in the short, medium, and long term, as well as provide replication options in the region.
In livestock production, the proportion of each land type and its rate of evolution over time should be considered alongside the land as a whole. Feed from various sources, such as grasses from natural pastures, fodders and forages, browse trees and shrubs, land use types of different cereals and perennial crops in various seasons, significantly improved livestock feed supply in the current production system. According to Moyo et al. (Citation2010), livestock and biophysical resources such as total land, arable land, an arable and permanent crop, permanent or non-permanent pastures, and non-arable pastures are concerns of different land categories that require attention. This boundary also determines how to feed a growing global population sustainably and what major changes may be required in terms of both.
Variation in the quantity and quality of forage produced, frequent droughts (Boval et al., Citation2015), seasonal effects, and bushfires are major obstacles to improving the supply of pasture-based livestock feed. As a result, quantifying the potential of tropical grasslands to provide grazing efficiency is critical, as is prioritising feed availability and forage consumption for grazing livestock (Coppock et al., Citation1986). This is critical to preserving the role of livestock, which is known for converting leftovers, residues, and grass products from arable and non-arable land into valuable food and manure (Van Zanten et al., Citation2018), as well as to preserving the local role of animal energy in food crop production. According to Schader et al. (Citation2015), livestock production with lower shares of food-competing feedstuffs would generate synergies between increased food availability and reduced environmental impacts.
According to Beutel et al. (Citation2015), establishing the appropriate stocking rate over a suitable duration will ensure sustainable grazing during the dry season while also contributing to rangeland health. They pointed out that the former outcome relates to maintaining livestock performance (e.g., live-weight gain, health, and reproductive efficiency) by avoiding the negative effects of overstocking, while the latter has less potential to waste a potentially valuable resource, namely the pasture itself, as a result of understocking during the actual grazing period. The latter outcome is associated with preserving, if not improving, the “health” of the rangeland environment itself. As a result, such baseline information on biomass production and grazing area is critical for adjusting stock numbers or stocking intervals to suit the available grass cover (Beutel et al., Citation2015).
4. Conclusions
The aim of this research was to investigate feed availability in both privately owned and communal locations using a field survey and metadata. This study used a bottom-up approach to classify and estimate distinct land uses and area extent based on the findings of household interviews and spatial data gathered from meta-data sources. Natural pastures, fallows, diverse croplands, homesteads, and communal areas such as meadows, woods, bushes, woodlands, and riverbanks all contribute to the animal feed source in the current study area.
In terms of area, communal land accounts for two-thirds of the animal feed supply, while private property accounts for one-third, with 53% of animal feed supplies coming from common land and 47% from agricultural land. Educations for smallholder farmers, policy options, and infrastructure investment all have the potential to increase system efficiency. Priorities include alleviating feed shortages and ensuring seasonal feed availability, as well as developing sustainable livestock production systems. Planning and preserving feeds from various sources, training communities in the operation and utilisation of available resources, developing infrastructure for in-situ pasture and fodder conservation during dry years, and establishing stakeholder participation in technical support are all beneficial to smallholders’ livelihoods as well as the national economy. Long-term environmental and livestock output improvements are also potential.
Competing interests
The author declares no competing interest.
Acknowledgments
Great thanks to the Arba Minch University (Ethiopia) for the support during this study activity.
Disclosure statement
No potential conflict of interest was reported by the author(s).
Additional information
Funding
Notes on contributors

Asrat Guja Amejo
Asrat Guja Amejo The Author’s research interest is to work on integration and sustainable integration of livestock and crop production, climate change impact on farming system and dairy and meat science.
References
- Amejo, A. G. (2018). Mapping soil terrain resources and descriptions of agro-ecological zone in Dawuro and Gamo Gofa zones in south-western Ethiopia. Journal of Soil Science and Environmental Management, 9(10), 164–13. https://doi.org/10.5897/JSSEM2018.0695
- Amejo, A. G., Gebere, Y. M., Kassa, H., & Tana, T. (2018a). Agricultural productivity, land use and draught animal power formula derived from mixed crop-livestock systems in Southwestern Ethiopia. African Journal of Agricultural Research, 13(42), 2362–2381. https://doi.org/10.5897/AJAR2018.13258
- Amejo, A. G., Gebere, Y. M., Kassa, H., & Tana, T. (2018b). Comparative analysis of climate change impact on livestock in relation to biomass base feed availability using standardized precipitation index in south-western Ethiopia. International Journal of Livestock Production, 9(7), 184–191. https://doi.org/10.5897/IJLP2018.0478
- Amejo, A. G., Gebere, Y. M., Kassa, H., Tana, T., & González-Redondo, P. (2019). Characterization of smallholder mixed crop–livestock systems in integration with spatial information: In case Ethiopia. Cogent Food & Agriculture, 5(1), 1565299. https://doi.org/10.1080/23311932.2019.1565299
- Amsalu, T., & Addisu, S. (2014). Assessment of grazing land and livestock feed balance in gummara-rib watershed, Ethiopia. Current Agriculture Research Journal, 2(2), 114. https://doi.org/10.12944/CARJ.2.2.08
- Aranguiz, A. A., & Creemers, J. (2019). Quick scan of Ethiopia’s forage sub-sector. Wageningen, Gelderland, HB, Netherlands. https://edepot.wur.nl/504124
- Bakrie, B., Hogan, J., Liang, J. B., Tareque, A. M. M., & Upadhyay, R. C. (1996). Ruminant nutrition and production in the tropics and subtropics. (No. 435-2016-33736). file:///C:/Users/user/Downloads/36.pdf
- Beutel, T., Karfs, R., Wallace, J., Trevithick, R., Scarth, P., & Tindall, D. (2015). VegMachine® in Queensland innovation in the rangelands. In Proceedings of the 18th Australian Rangeland Society Biennial Conference Alice Springs, NT.(Ed. MH Friedel.) Australian Rangeland Society: Parkside, SA. file:///C:/Users/user/Downloads/ARS_Handbook_2015_email.pdf
- Birnin-Yauri, H. B., Birnin-Yauri, U. A., Maigandi, S. A., & Mohammed, A. A. (2012). Biomass estimation and some chemical composition of herbage at Dabagi farm grazing land, Usmanu Danfodiyo University, Sokoto-Nigeria. The Journal of Agricultural Science, 1, 27–30. researchgate.net
- Boudet, G., & Rivière, R. (1968). Emploi pratique des analyses fourragères pour l’appréciation des pâturages tropicaux. Revue d’Elevage et de Médecine Vétérinaire des Pays Tropicaux, 21(2): 227–266. https://doi.org/10.19182/remvt.7588
- Bouma, J., Kuyvenhoven, A., Bouman, B. A. M., Luyten, J. C., & Zandstra, H. G. (Eds.). (2012). Eco-regional approaches for sustainable land use and food production: Proceedings of a symposium on eco-regional approaches in agricultural research, ISNAR, The Hague (Vol. 4). Springer Science & Business Media. 12–16 December, 1994,
- Boval, M., Edouard, N., & Sauvant, D. (2015). A meta-analysis of nutrient intake, feed efficiency and performance in cattle grazing on tropical grasslands. Animal, 9(6), 973–982. https://doi.org/10.1017/S1751731114003279
- Coppock, D. L., Ellis, J. E., & Swift, D. M. (1986). Livestock feeding ecology and resource utilization in a nomadic pastoral ecosystem. Journal of Applied Ecology, 23(2), 573–583. https://doi.org/10.2307/2404037
- CSA (Central Statistical Agency). (2011). Agriculture sample survey reports from 2011. https://catalog.ihsn.org/catalog/1389/related-materials
- CSA (Central Statistical Agency). (2017). Agricultural sample survey. Report on livestock and livestock characteristics (private peasant holdings). Central Statistical Agency (CSA): CSA; Volume II.194p. https://searchworks.stanford.edu/view/6509594
- Erb, K. H., Fetzel, T., Kastner, T., Kroisleitner, C., Lauk, C., Mayer, A., & Niedertscheider, M. (2016). Livestock grazing, the neglected land use. In H. Haberl, M. Fischer-Kowalski, F. Krausmann, & V. Winiwarter (Eds.), Social Ecology: Society-Nature Relations Across Time and Space (Vol. 5, pp. 295–313). https://doi.org/10.1007/978-3-319-33326-713
- Erb, K. H., Gaube, V., Krausmann, F., Plutzar, C., Bondeau, A., & Haberl, H. (2007). A comprehensive global 5 min resolution land-use data set for the year 2000 consistent with national census data. Journal of Land Use Science, 2(3), 191–224. https://doi.org/10.1080/17474230701622981
- FAO (Food and Agriculture Organization). (2018). Report on feed inventory and feed balance. FAO. https://www.fao.org/3/ca1718en/CA1718EN.pdf
- Feng, X. M., & Zhao, Y. S. (2011). Grazing intensity monitoring in Northern China steppe: Integrating CENTURY model and MODIS data. Ecological Indicators, 11(1), 175–182. https://doi.org/10.1016/j.ecolind.2009.07.002
- Fetzel, T., Havlik, P., Herrero, M., Kaplan, J. O., Kastner, T., Kroisleitner, C., & Erb, K. H. (2017). Quantification of uncertainties in global grazing systems assessment. Global Biogeochemical Cycles, 31(7), 1089–1102. https://doi.org/10.1002/2016GB005601
- Garnett, T. (2014). Three perspectives on sustainable food security: Efficiency, demand restraint, food system transformation. What role for life cycle assessment? Journal of Cleaner Production, 73, 10–18. https://doi.org/10.1016/j.jclepro.2013.07.045
- Guja, A. (2020). Spatial and temporal variability of household food nutritional condition in mixed crop-livestock systems in Southwestern Ethiopia. World Journal of Agricultural Sciences, 16, 1–10. https://doi.org/10.5829/idosi.wjas.2020.01.10
- Haberl, H., Erb, K. H., Krausmann, F., Gaube, V., Bondeau, A., Plutzar, C., & Fischer-Kowalski, M. (2007). Quantifying and mapping the human appropriation of net primary production in earth’s terrestrial ecosystems. Proceedings of the National Academy of Sciences, 104(31), 12942–12947. https://doi.org/10.1073/pnas.0704243104
- Hao, G., Xue-Biao, P. A. N., & Yu, F. (2009). Influence of climate change on potential climate productivity in grassland of central inner Mongolia. Chinese Journal of Agrometeorology, 30(3), 277. https://zgnyqx.ieda.org.cn//EN/Y2009/V30/I03/277
- Herrero, M., & Thornton, P. K. (2013). Livestock and global change: Emerging issues for sustainable food systems. Proceedings of the National Academy of Sciences, 110(52), 20878–20881. https://doi.org/10.1073/pnas.1321844111
- Hoefsloot, P., & Calmanti, S. (2012). LEAP version 2.61 for Ethiopia. https://hoefsloot.com/downloads/LEAP.pdf
- Kassam, A. H., Van Velthuizen, H. T., Fischer, G. W., & Shah, M. M. (1991). Agro-ecological land resources assessment for agricultural development planning. A case study of Kenya. Resources data base and land productivity. Technical Annex, 1, 9–31. Available on https://www.fao.org/3/t1482e/t1482e.pdf
- Lalonde, L. G., & Sukigara, T. (1997). LDPS2 User’s Guide. Food and Agriculture Organization of the United Nations. https://www.fao.org/fileadmin/templates/lead/pdf/user97.pdf
- Le Houerou, H. N. (1980). Browse in Africa: The current state of knowledge. International Livestock Centre for Africa. https://hdl.handle.net/10568/67392
- Lorenz, K., Lal, R., Lorenz, K., & Lal, R. (2018). Carbon sequestration in grassland soils. Carbon Sequestration in Agricultural Ecosystems, 175–209. https://doi.org/10.1007/978-3-319-92318-5_4
- Luo, G., Han, Q., Zhou, D., Li, L., Chen, X., Li, Y., Li, L., Li, Y., Hu, Y., & Li, B. L. (2012). Moderate grazing can promote aboveground primary production of grassland under water stress. Ecological Complexity, 11, 126–136. https://doi.org/10.1016/j.ecocom.2012.04.004
- Malomo, G. A., Madugu, A. S., & Bolu, S. A. (2018). Sustainable animal manure management strategies and practices. Agricultural Waste and Residues, 119. https://doi.org/10.5772/intechopen.78645
- Moyo, S., Swanepoel, F., & Stroebel, A. (2010). The role of livestock in developing communities: Enhancing multifunctionality. UJ Press. https://doi.org/10.18820/9781928424819
- Pereira, L. S., Paredes, P., Espírito-Santo, D., & Salman, M. (2023). Actual and standard crop coefficients for semi-natural and planted grasslands and grasses: A review aimed at supporting water management to improve production and ecosystem services. Irrigation Science, 1–32. https://doi.org/10.1007/s00271-023-00867-6
- Petermann, J. S., & Buzhdygan, O. Y. (2021). Grassland biodiversity. Current Biology, 31(19), R1195–R1201. https://doi.org/10.1016/j.cub.2021.06.060
- Petz, K., Alkemade, R., Bakkenes, M., Schulp, C. J., van der Velde, M., & Leemans, R. (2014). Mapping and modelling trade-offs and synergies between grazing intensity and ecosystem services in rangelands using global-scale datasets and models. Global Environmental Change, 29, 223–234. https://doi.org/10.1016/j.gloenvcha.2014.08.007
- Phelps, L. N., & Kaplan, J. O. (2017). Land use for animal production in global change studies: Defining and characterizing a framework. Global Change Biology, 23(11), 4457–4471. https://doi.org/10.1111/gcb.13732
- Quiroz, R., Zorogastúa, P., Baigorria, G., Barreda, C., Valdivia, R., Cruz, M., & Reinoso, J. (1999). Toward a dynamic definition of agroecological zones using modern information technology tools. CIP Program Report, 2000, 361–370. http://cipotato.org/site/inrm/home/publicat/01cpb028.pdf
- Ramankutty, N., Evan, A. T., Monfreda, C., & Foley, J. A. (2008). Farming the planet: 1. Geographic distribution of global agricultural lands in the year 2000. Global Biogeochemical Cycles, 22(1). https://doi.org/10.1029/2007GB002952
- Reid, R. S., Serneels, S., Nyabenge, M.& Hanson, J. (2005). The changing face of pastoral systems in grass-dominated ecosystems of Eastern Africa. Grasslands of the World, 19–76. 9251053375.
- Reid, J. T., Woolfolk, P. G., Hardison, W. A., Martin, C. M., Brundage, A. L., & Kaufmann, R. W. (1952). A procedure for measuring the digestibility of pasture forage under grazing conditions: One figure. The Journal of Nutrition, 46(2), 255–269. https://doi.org/10.1093/jn/46.2.255
- Salmon, G., Teufel, N., Baltenweck, I., van Wijk, M., Claessens, L., & Marshall, K. (2018). Trade-offs in livestock development at farm level: Different actors with different objectives. Global Food Security, 17, 103–112. https://doi.org/10.1016/j.gfs.2018.04.002
- Schader, C., Muller, A., Scialabba, N. E. H., Hecht, J., Isensee, A., Erb, K. H., Smith, P., Makkar, H. P. S., Klocke, P., Leiber, F., Schwegler, P., Stolze, M., & Niggli, U. (2015). Impacts of feeding less food-competing feedstuffs to livestock on global food system sustainability. Journal of the Royal Society Interface, 12(113), 20150891. https://doi.org/10.1098/rsif.2015.0891
- Seré, C., Steinfeld, H., & Groenewold, J. (1996). World livestock production systems. Food and Agriculture Organization of the United Nations.
- Smil, V. (2014). Eating meat: Constants and changes. Global Food Security, 3(2), 67–71. https://doi.org/10.1016/j.gfs.2014.06.001
- Steinfeld, H. (2006). Livestock’s long shadow: Environmental issues and options. Food & Agriculture Org. https://www.fao.org/3/a0701e/a0701e.pdf
- Tahir, M. B., Wossen, A. M., & Mersso, B. T. (2018). Evaluation of livestock feed balance under mixed crop–livestock production system in the central highlands of Ethiopia. Agriculture & Food Security, 7(1), 1–17. https://doi.org/10.1186/s40066-018-0170-8
- TECSULT. (2004). Ethiopian energy II project. Woody Biomass Inventory and Strategic Planning Project (WBISPP)–Phase 2–Terminal Report. https://apps.worldagroforestry.org/economics_papers/anonymous/WKIEMP/Datasets/Louis%20Verchot/Biomas
- Van Kernebeek, H. R., Oosting, S. J., Van Ittersum, M. K., Bikker, P., & De Boer, I. J. (2016). Saving land to feed a growing population: Consequences for consumption of crop and livestock products. The International Journal of Life Cycle Assessment, 21(5), 677–687. https://doi.org/10.1007/s11367-015-0923-6
- Van Zanten, H. H., Herrero, M., Van Hal, O., Röös, E., Muller, A., Garnett, T., Gerber, P. J., Schader, C., & De Boer, I. J. (2018). Defining a land boundary for sustainable livestock consumption. Global Change Biology, 24(9), 4185–4194. https://doi.org/10.1111/gcb.14321
- Wolf, J., Chen, M., & Asrar, G. R. (2021). Global rangeland primary production and its consumption by livestock in 2000–2010. Remote Sensing, 13(17), 3430. https://doi.org/10.3390/rs13173430
- Yisehak, K., & Janssens, G. P. (2014). The impacts of imbalances of feed supply and requirement on productivity of free-ranging tropical livestock units: Links of multiple factors. African Journal of Basic & Applied Sciences, 6(6), 187–197. https://doi.org/10.5829/idosi.ajbas.2014.6.6.9168
- Zewdie, W., & Yoseph, M. (2014). Feed resources availability and livestock production in the central rift valley of Ethiopia. International Journal of Livestock Production, 5(2), 30–35. https://doi.org/10.5897/IJLP2013.0158