
 ?Mathematical formulae have been encoded as MathML and are displayed in this HTML version using MathJax in order to improve their display. Uncheck the box to turn MathJax off. This feature requires Javascript. Click on a formula to zoom.
Abstract
A survey was conducted in five different rural municipalities of Darchula district, namely Apihimal, Byas, Dunhu, Marma, and Naugadh, with the objectives of analyzing and documenting the economics of apple production and identifying the constraints associated with apple production and marketing. The survey was carried out among 80 different apple farmers selected through random sampling from the list of 94 farmers registered at Apple Zone, Darchula. A pretested, semi-structured questionnaire was used to collect the data from respondents. Data analysis was done using MS Excel and SPSS. The average area under apple cultivation was found to be 7.52 ropani. Financial analysis for a productive period of 20 years identified apple as a profitable activity with an average benefit-cost ratio of 1.88 and a net present value of NRs. 119266.17 per ropani. Further, the IRR and payback period were found to be 22.03% and 8 years and 8 months, respectively. The total cost of production associated with apple farming was found to be NRs. 135542.41 per ropani. Fencing costs and labor wages were found to account for the majority of investment and operational costs, respectively. Sensitivity analysis for a 10% increase in cost, a 10% decrease in output, a 1% increase in output price, and a one-year delay in production revealed the project’s insensitivity to the changes mentioned. The study concluded that apple farming was financially feasible in Darchula district, with a further need for progressive mechanization of farming practices and the utmost need for improvement of irrigation and transportation facilities to enhance apple production as desired.
PUBLIC INTEREST STATEMENT
Promising farm owners nowadays use meticulous business plans and precise financial statements to discern the most lucrative agricultural enterprises for their operations. They also compute production costs over a year, analyze market dynamics, and predict future financial growth. The monitoring of cash flows, the choice of investments or insolvencies, and the investigation of alternative applications for capital investments in the farm operation can all be improved with accurate and thorough financial information. Darchula district has the potential for effective commercial apple farming, particularly because of its topography and climatic conditions suitable for apple production. It is possible to encourage entrepreneurship and commercialize apple production in the region by having a prior understanding of the production economy. As a result, we conducted a financial analysis of apple production for a productive period of 20 years and made an effort to cover all financial aspects related to apple production in this paper.
1. Introduction
Agriculture in Nepal is very diverse due to the variations in land topography and wide temperature range across the country, making it suitable for the cultivation of a large range of species. Despite the decreasing contribution of agriculture to the GDP due to industrialization, it is still the second most important sector, contributing about 21.32% of GDP and providing employment to the majority of the total population of Nepal (O’Neill, Citation2022). Due to the availability of different climatic zones, there is immense potential for agricultural advancement through diversification in Nepal. Out of the total cultivable land area available, about 3,091 thousand hectares (ha) are under cultivation, which represents 21% of the total land in Nepal (MoALD, Citation2021). Among different agricultural commodities, fruit is one of the main horticultural sub-sectors, comprising 3.85% of total cultivated land with a productivity of 10.50 tons per hectare (t/ha) (MoALD, Citation2021). Among the cultivated fruits, apples are the most important winter deciduous fruit in Nepal in terms of area, production, and household economy in the mountainous districts of Nepal (Atreya & Kafle, Citation2016). The total area under apple farming in Nepal is about 12,910 ha, of which only 42.71% is productive with an average yield of 8.20 t/ha (MoALD, Citation2021). Khadka and Solberg (Citation2020) reported the cultivation of apples in about 50 districts of Nepal, with 12 of them belonging to the mountain region. Among them, Darchula is one that is emerging as a major apple-producing district in the Mahakali zone of Sudurpaschim Province. The high mountainous area of the district has potential for successful apple cultivation, especially because of its topography and climatic conditions appropriate for commercial apple production. The total area under apple cultivation in Darchula district is 162 ha, accounting for about 18% of the total provincial area under apple cultivation, of which only 52.47% is productive with an average yield of 5.36 t/ha, way too low compared to the national average of 8.20 t/ha (MoALD, Citation2021).
Despite the effort and time the farmers have invested, they’ve now no longer been capable of getting the anticipated results from apple cultivation. Though apple productivity is increasing at an extremely decreasing rate, it has severely declined in comparison to the average yield before fiscal year 2015/16 (MoALD, Citation2020). Amgai et al. (Citation2016) reported low productivity and low profitability among apple growers due to traditional methods of production and harvesting practices that resulted in a high cost of production and less farm income, limiting the expansion of farm enterprises. The major problems in production among apple growers in Jumla were found to be poor management practices like irrigation, fertilizer application, training and pruning, harvesting, and poor transportation (Devkota et al., Citation2017). Further, Gayak et al. (Citation2020) addressed conundrums such as low volume of production, high postharvest loss, and marketing problems like price variation; poor bargaining power, poor marketing infrastructure, and poor linkage were responsible for low economic gain for apple farmers in Mustang.
The comparative benefit of apples in this location hasn’t been adequately researched or utilized, though. Also, there has not been any significant research yet regarding the challenges and opportunities of the apple sub-sector in the district. So, Darchula district lacks information on financial analysis and the feasibility of apple production, due to which even the potential farming areas suitable for apple production are not being considered for farming. Thus, a coordinated study is needed to recommend measures to be taken to expand apple acreage and maximize apple production and farmers’ profits by providing prior knowledge about the economics of production in the long run. The purpose of this research is to provide a financial foundation for apple production in order to encourage entrepreneurship and commercialization in Nepal’s Darchula district, which may be applicable to other places with similar circumstances.
2. Methodology
2.1. Site selection
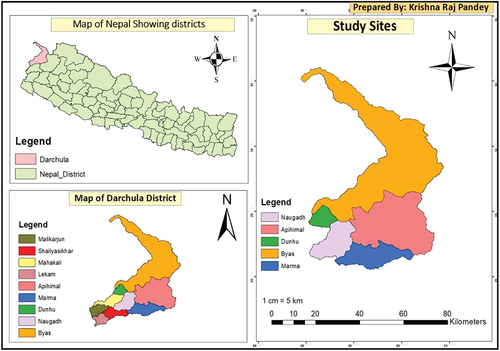
Darchula district is one of the nine districts of Sudurpaschim Province, covering an area of approximately 2,322 square kilometers with a population of aaround 133,464. It ranges in altitude from 518 meters to 7132 meters above sea level (ASL). The average maximum temperature in the region is 18.6 °C, while the minimum temperature is 7.7 °C. The average rainfall is 2129 mm (DDC, Citation2020). Under the Prime Minister Agriculture Modernization Project (PMAMP), Darchula district has been designated as an “Apple and Citrus Zone.”
The research area of this district included five rural municipalities: Byas, Duhu, Naugad, Marma, and Apihimal, as shown in Figure . These areas were purposefully selected as they fall within the command areas of the PMAMP Apple Zone in Darchula, known for their high apple production potential within the district. The total area under apple cultivation in Darchula district is 162 ha, making up about 18% of the total provincial apple cultivation area. However, only 52.47% of this area is productive, with an average yield of 5.36 t/ha, which is significantly lower than the national average of 8.20 t/ha (MoALD, Citation2021).
Figure 1. A map of Nepal showing the study site.
2.2. Sample and sampling technique
The survey was conducted with 80 different farmers in different wards and villages of five different rural municipalities, namely Apihimal, Byans, Dunhu, Marma, and Naugadh, from February to April 2022. The data used in this study comprises memory-based production costs and revenue collected by stakeholders (apple farmers) on respective apple farms prior to the year 2022. The minimum sample size was obtained as 76 at a 95% confidence level using Raosoft software, and for convenience, 80 farmers were selected for scheduled face-to-face interviews. A three-stage sampling procedure was employed to collect these representative samples. In the first stage, purposive sampling was done, in which five major apple-cultivating rural municipalities were purposively selected from a total of nine local bodies based on the suitability of apple production. Then, in the second stage, proportionate stratified sampling was performed to determine the appropriate sample size for each rural municipality under study, as detailed in Table . Finally, in the third stage, simple random sampling was used to determine the respondents for the questionnaire fill-up from the list of 94 registered apple farmers at the PMAMP, Project Implementation Unit (PIU), Apple Zone, Darchula.
Table 1. Sample size determination using the proportionate stratified sampling method
The formula used to calculate the number of farmers selected by the proportionate sampling method is,
2.3. Research instruments
Household surveys, Key Informant’s Interviews (KIIs), and Focus Group Discussions (FGDs) were used as research instruments for the collection of information.
2.3.1. Household survey
Household surveys were conducted in five rural municipalities of Darchula district using a pre-tested questionnaire to collect information regarding social and demographic factors, the adoption of different farming practices, the cost of production, production, and marketing of apples, and associated constraints.
2.3.2. Key informant’s interview
Agriculture technicians, local leaders, and progressive farmers associated with apple production and marketing were identified. Concerned stakeholders were asked a series of questions to collect information on apple farming practices, their economic feasibility, and the constraints associated with them prior to questionnaire preparation.
2.3.3. Focus group discussion
Five focus group discussions were carried out with apple farmers in each local body of the study area to validate the information collected through the household survey regarding the economics of production.
2.4. Data and data types
Primary data was collected directly from farmers involved in apple farming to gain first-hand information by means of household surveys, key informant interviews, and focus group discussions. Whereas different reports, bulletins, proceedings, articles, and websites were assessed for the collection of relevant secondary information on apple farming. Annual reports of the Ministry of Agriculture and Livestock Development (MoALD), the Food and Agriculture Organization (FAO), the Prime Minister Agriculture Modernization Project (PMAMP), the Central Bureau of Statistics (CBS), the Nepal Agriculture Research Council (NARC), and other institutions and organizations were also studied for obtaining secondary data on apple production. The pertinent data was extracted from the accessible literature, and the findings were presented systematically.
2.5. Methods and techniques of data analysis
The data collected from both primary and secondary sources was coded and entered into MS-Excel. MS-Excel and the Statistical Package for Social Sciences (SPSS) were used for the analysis of the data. Descriptive statistics such as frequencies and percentages were calculated along with other cost-benefit-related economic parameters.
3. Calculation
Different parameters for studying the financial feasibility of apple production were calculated using the following formulas, and all the costs incurred and revenue received are expressed in NRs (Nepalese rupees), where 1 USD = NRs. 131.40.
3.1. Benefit-Cost (B:C) ratio
A benefit-cost ratio of value higher than unity represents more benefits and is economically accepted. It provides overall profitability for any business and thus helps the farmers select the most suitable fruit crop to make maximum profit. The B:C ratio was calculated by dividing the total present value of benefits by the total present value of costs (Huirne & Dijkhuizen, Citation1997).
3.2. Net Present Value (NPV)
The method used to estimate net present value encompasses the initial capital investment and is used to calculate the current value of all subsequent cash flows that a project will generate (Fernando, Citation2021). It was calculated as the difference between the present value of the returns (cash inflows) and the present value of the expenses incurred (cash outflows) over a time period.
3.3. Internal Rate of Return (IRR)
The internal rate of return is the discount rate that reduces the net present value of all projected cash flows, both positive and negative, to zero (Fernando, Citation2021). Long-term profitability and feasibility are considered to be higher for a business enterprise with an IRR greater than the discount rate. It is particularly helpful in predicting potential long—term growth and expansion for the project, which ultimately aids investors in making investment decisions, and was calculated using the formula:
where,
LDR= Lower Discount Rate
NPV= Net Present Value
UDR= Upper Discount Rate
3.4. Problem ranking
The forced ranking technique was applied to construct an index for prioritizing the problems associated with apple production and marketing as per the farmer’s perception using MS-Excel. The formula used to find the index of importance for problems was:
Where,
Iimp = Index of Importance
∑= Summation
Si = Ith scale value
Fi = frequency of ith importance
N = total number of respondents
4. Results and discussion
4.1. Socio-demographic characteristics of the respondents
The mean and standard deviation of the age of respondents in the study area were found to be 45.51 and 10.62, respectively. The respondents were within the age range of 24 to 69 years old. A higher percentage (73%) of the respondents were male, and the remaining 27% of the respondents were female. The majority of the respondents (81.25%) were Chhetri, followed by Janajati (11.25%), Brahmin (5%), and Dalit (2.50%). The majority of the respondents had a primary level of education (40%), followed by respondents with a secondary (27.5%), illiterate (16.3%), higher secondary (10%), and bachelor’s or above (6.3%) level of education.
The total population of the study area of 80 households was 539, with an average family size of 6.737 members, which was higher than the national average (4.32) (CBS, Citation2011). The average household percentage of women was 46.94%, which was lower than the national average (51.60%). The minimum family size was 4 and the maximum was 12, and the average number of males and females in the family was 3.58 and 3.16, respectively. The proportion of males involved in full-time and part-time agriculture was 50.81% and 54.76%, respectively.
4.2. Farm characteristics
4.2.1. Land holding status of the respondents
The average landholding of the respondent was found to be 19.82 ropani (19.65 ropani = 1 hectare) with a standard deviation of 6.61, whereas the land used for apple cultivation on average was 7.52 ropani. The minimum and maximum areas for apple cultivation among the respondents were recorded at 2.5 ropani and 15 ropani, respectively, with a standard deviation of 3.20 ropani. About 8.75% of the respondents had rented the land for cultivation, whereas 6.25% of the respondents had rented the land out. Sharecropping was practiced by the remaining 2.50% of respondents.
4.2.2. Apple farming experience
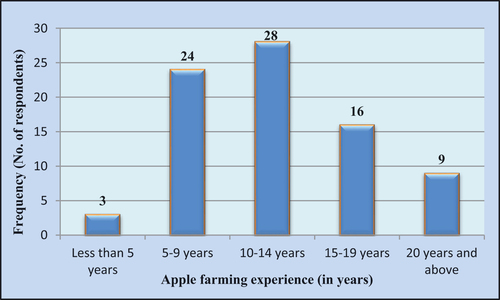
The majority of the apple-growing farmers (35%) have been involved in apple farming for the last 10–14 years, followed by 30% of the respondents who had 5–9 years of experience, 20% of respondents had 15–19 years of experience, 11.25% of respondents had experience of 20 years or above, and about 3.75% of respondents were new to apple cultivation with experience of less than 5 years as shown in Figure .
Figure 2. Apple farming experience of the respondents in the study areas of Darchula district, 2022.
4.2.3. Area, production, and number of bearing and non-bearing trees (2022) in the study area
The total area under apple cultivation owned by respondents in the study area was found to be 549.5 ropani, with Byas Rural Municipality having the most (183 ropani) and Duhu Rural Municipality having the least (73 ropani), as depicted in Table . The total number of bearing and non-bearing trees owned by the respondents in the study area was found to be 8433 and 11,017, respectively, with the highest number of both bearing (2520) and non-bearing (3855) trees in Byas. The average production per plant was highest for Apihimal, followed by Byas. Also, the highest production per ropani was reported in Apihimal, with a production of 1.54 qt. per ropani, followed by Byas rural municipality, with a productivity of 1.46 qt. per ropani.
Table 2. Area, production, and number of bearing and non-bearing trees (2022) in the study areas
4.3. Economics of apple production
4.3.1. Cost of production
Apple being a perennial fruit, it was certain that the cost incurred in its various years of production would vary. Therefore, the total cost was calculated by taking into account both the variable and fixed costs required for apple production from a ropani of land throughout its entire productive life span, i.e., usually 20 years.
4.3.1.1. Initial investment costs
The average production cost was classified into two categories: investment costs (1–4 years) and operational costs (5–9 years, 10–14 years, and 15–20 years). Both fixed and variable costs were taken into consideration for the estimated productive period of 20 years. Based on the data recorded from face-to-face interviews conducted with apple farming households in the study area, the cost of the initial investment for the first four years is depicted in Table . The total cost of production associated with apple farming was found to be NRs. 135542.41 per ropani for Darchula district. The study showed that apple cultivation required a significantly higher investment in the first year (NRs. 72410), as orchard establishments generally require a high investment in comparison to their maintenance in subsequent years. The major share of the initial investment per ropani was found to be greatest in fencing (NRs. 42500), followed by the establishment of irrigation channels (NRs. 10000), saplings (NRs. 7,000), pit digging (NRs. 4000), land preparation and layout costs, and land lease costs, respectively.
Table 3. Initial investment cost (1–4 years) in apple farming in the present survey for the feasibility study of apple production in Darchula district of Nepal, 2022
4.3.1.2. Operating costs
Apple growers in the study area were asked to provide information related to the cost of each year based on an approximate estimation that was later validated through focused group discussions (FGDs). According to the apple farmers, orchards with standard varieties usually started fruiting at an average gestation period of 4 years, which was 2–3 years for orchards with high-density plantings of varieties like Gala and Fuji. The average operating cost of production per ropani was found to be NRs. 9960, NRs. 15967, and NRs. 19228 for operating years 5–9 years, 10–14 years, and 15–20 years, respectively. The operating cost was observed to have increased for up to 15 years before remaining constant at NRs. 19228 for the following years. As shown in Table , labor costs (NRs. 21065 per ropani) accounted for the majority of the costs incurred during these years of operation, followed by manure costs (NRs. 15710 per ropani).
Table 4. Operating costs (5–20 years) in apple farming in the present survey for the feasibility study of apple production in Darchula district of Nepal, 2022
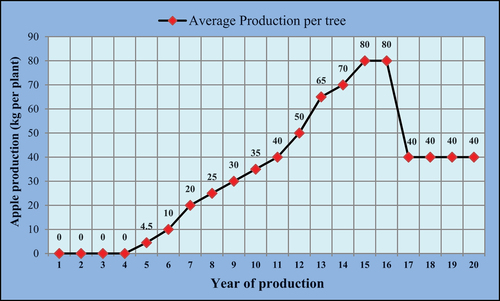
4.3.2. Average apple production per tree and revenue per ropani
Generally, the production of apples or any other perennial fruit varies with the year of growth. The fruit production generally increases for some years once the fruiting starts, and later, after the completion of productive years and the beginning of senescence, the production is reported to be gradually decreasing. In the study area, an apple tree was reported to produce marketable fruits after the 4th year of plantation (for standard varieties), with an average of 4.5 kg/plant in the 5th year. The average apple production per tree in different years after fruiting for the first time is shown in Figure . It was found that once fruiting started, production increased up to the 15th year, remained almost constant for the 16th year, and decreased afterward. Apple production was found to be highest in the 15th and 16th years, with an average of around 80 kg of apples per plant, which was also later validated through FGDs. In addition, surveyed apple growers were reported to cease their orchard management expenditures after the 16th year and prefer re-planting the orchards after the 20th year of productive periods, as the costs required to carry out orchard management practices were reportedly higher than the revenue generated from such orchards afterwards.
Figure 3. Average apple production per plant per year in the study areas of Darchula district, 2022.
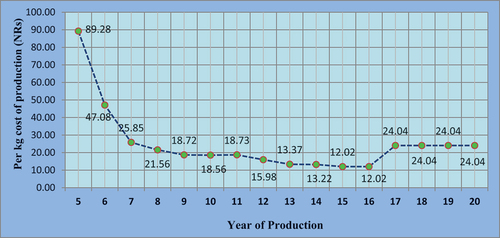
4.3.3. Cost per kg of apple production
Figure depicts the average cost per kg of apple production in various years of productive fruiting. The highest per kg production cost was in the 5th year, with a cost of NRs. 89.28, which kept on decreasing as the production increased up until the 16th year and increased afterward as the production decreased. The lowest per-kg apple production cost was reported in the 15th and 16th years, at NRs. 12.02. Gül and Erkan (Citation2005) also found the unit cost of apple production to be 20.58 YKr/kg among the surveyed apple farms in the Trans-Taurus Mountain Region. The higher values of cost per kg of apple production in the early years of production were due to no production in the first four years, followed by low production years but requiring more expenditures for orchard establishment and maintenance during the early fruiting.
Figure 4. Cost of per kg apple production in the present survey for the feasibility study of apple production in Darchula district of Nepal, 2022.
4.3.4. Cost-benefit analysis
4.3.4.1. Benefit-Cost (B:C) ratio
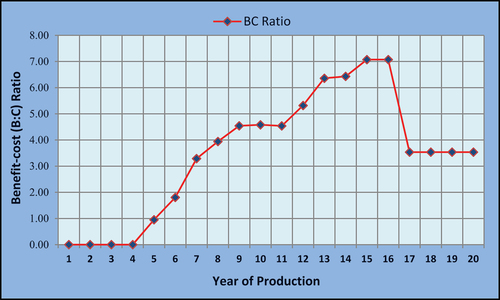
The benefit and cost were calculated separately based on the average costs incurred and benefits obtained for the period of 20 years. From the study carried out, the average B:C ratio for the overall productive period was found to be 1.88. The benefit-cost ratio calculated for each of the respective years is shown in Figure . The B:C ratio showed that apple farming in Darchula is profitable, as the calculated ratio is greater than 1 (1.88). Similar results were found by Fadavi et al. (Citation2011) in Iran with a BC ratio of 1.77 and by Gayak et al. (Citation2020) in Mustang with a B:C ratio of 1.84. Also, in a survey study by Bayav and Karli (Citation2020) in the provinces of Isparta and Karaman, the relative profit from apple farming was found to be 1.80 and 1.42, respectively. Furthermore, a recent study by Sapkota et al. (Citation2022) also reported a profitable B:C ratio of 2.03 in apple farming in the Chandannath municipality of Jumla district. The variation in BC ratios from our findings might be due to the consideration of approximately 20 years of production compared to the BC ratio calculation for a particular year taking only variable costs into account in previously conducted studies.
Figure 5. Benefit-cost (B:C) ratio calculated for 20 years of productive fruiting period of apple in Darchula, 2022.
4.3.4.2. Net Present Value (NPV)
The net present value (NPV) at a 12% discount rate for 20 years of productive apple production was found to be NRs. 119266.17 per ropani. As the calculated NPV was positive, it indicated that apple cultivation was profitable in the study area. The detailed calculation and information on NPV are depicted in Table .
Table 5. Analysis of net present value (NPV) and benefit-cost (B:C) ratios in the present survey for the feasibility study of apple production in Darchula district of Nepal, 2022
4.3.4.3. Internal Rate of Return (IRR)
The IRR for apple farming in Darchula district was found to be 22.03%, which is higher than the discount rate. Uzunöz and Akcay (Citation2006) also had similar findings, in which apple cultivation had an IRR of 22.12%. Since the IRR was found to be greater than the discount rate (which also accounts for opportunity cost), it indicated that apple cultivation was profitable from an economic point of view in the study area. The detailed calculation and information about the IRR are shown in Table .
Table 6. Analysis of the internal rate of return (IRR) in the present survey for the feasibility study of apple production in Darchula district of Nepal, 2022
4.3.4.4. Payback Period (PBP)
The term “payback period” refers to the length of time, usually stated in years, that is anticipated to make a return on an investment or recuperate the funds invested (Kagan, Citation2021). Generally, a shorter payback period is preferred in the case of perennial crops, as it envisages an early return from the enterprise under operation. The payback period of apple cultivation in the study area was found to be 8 years, 8 months, whose calculation is shown in Table .
Table 7. Calculation of payback period (PBP) in the present survey for the feasibility study of apple production in Darchula district of Nepal, 2022
4.3.4.5. Sensitivity analysis
A sensitivity analysis is imperative for deciding the overall significance of a project involving any enterprise regarding its capability to sustain itself under a few uncertain obstacles. The ability of an enterprise or a project to withstand certain ups and downs, veering from expectations, helps in evaluating its effectiveness, which eventually ensures the regular flow of revenues to producers. Necessarily, a sensitivity analysis was performed to account for the feasibility of production under some uncertain conditions: a 10% increase in cost (both investment and operational), a 10% decrease in quantity of fruits produced, a 1% decrease in output price, and a one-year delay in production. The sensitivity analysis revealed the insensitivity of the apple farming enterprise to any of the aforementioned altering conditions, as shown in Table , which further assured the feasibility of apple production in the study area. This analysis ascertained that apple farming could withstand the above-mentioned alterations without hampering economic gain, thereby ensuring the regular inflow of farmers’ profits. Such stability of any enterprise within a particular area assures and attracts entrepreneurs and investors, which encourages exploration and enhancement, ultimately leading to the overall advancement of the enterprise and the locality.
Table 8. Sensitivity analysis under some uncertain conditions in the present survey for the feasibility study of apple production in Darchula district of Nepal, 2022
4.4. Actors involved in the marketing of apples and price satisfaction
The major area for marketing Darchula’s apple involved both Nepal and India, as it lies in the border region. The study revealed that the circulation of apples produced in Darchula district to its potential market area occurs mainly through the involvement of four different channels. The majority (40%) of farmers were found selling their produce directly by themselves; 26.25% used traders for apple marketing; 22.50% sold through traders and farmers themselves; and 11.25% sold through farmer’s groups and cooperatives, as shown in Table . Kashyap and Guleria (Citation2015) also found four marketing channels, the major one being the channel involving traders, in their study in the Mandi district of Himachal Pradesh.
Table 9. Actors’ involvement in marketing the produced apple in the study areas of Darchula district, 2022
Incontrovertibly, the efficacy of agricultural marketing channels to satisfy and maintain producer-consumer relationships is crucial to their sustainability. Farmers’ perspectives on the costs incurred and their contentment with the channel in operation depend on the price paid to them. In the study conducted, apple growers were asked to reveal their satisfaction with the price received per unit of produce. The majority of the farmers (51.25%) were found to be satisfied with the price received, whereas 48.75% of the respondents were unsatisfied with the price. This clarifies the level of farmers’ dissatisfaction with the market system involved, as almost half of the apple-growing farmers interviewed were found to be unsatisfied with the prices received.
4.5. Major problems associated with apple production and its marketing
4.5.1. Ranking of production constraints
Based on a review of the literature and discussion with farmers and key officials of the Apple Zone and Agriculture Knowledge Centre (AKC), Darchula’s major problems associated with apple production were identified and included in the questionnaire. The farmers were asked to rank these problems, and forced ranking was used to determine the major problems, as illustrated in Table . Most of the farmers responded that lack of irrigation was the major problem in apple production, with the highest index value of 0.85, followed by the occurrence of natural hazards and technical constraints, with index values of 0.76 and 0.74, respectively. Lack of pesticides and fertilizers was ranked as the least important problem, with an index value of 0.21. Adhikari (Citation2012)) also reported a lack of irrigation and technical knowledge as major production problems among apple growers in Jumla district. Similar findings were also reported by Amgai et al. (Citation2015) regarding the constraints associated with apple production.
Table 10. Ranking of the problems associated with the production of apples in the study areas of Darchula district, 2022
4.5.2. Ranking of marketing constraints
As shown in Table , lack of transport facilities was found to be the most important problem related to marketing, with an index value of 0.92, followed by lack of storage, with an index value of 0.87. Price fluctuation and a lack of grading and packaging were the third and fourth most serious constraints, with index values of 0.44 and 0.42, respectively, followed by high middlemen margins (an index value of 0.402). Lack of market information was identified as the least important problem, with an index value of 0.396. Similar findings were also reported by Adhikari (Citation2012) and Amgai et al. (Citation2015), where the authors revealed a lack of transport and storage facilities as the major constraints associated with the marketing of apples in the Jumla and Mustang districts, respectively.
Table 11. Ranking of the problems associated with the marketing of apples in the study areas of Darchula district, 2022
5. Conclusion
In conclusion, the study highlights the significant potential of apple production in Darchula District, Nepal, as a means to boost the local economy. Farmers and agri-entrepreneurs looking for sustainable investments should carefully assess costs and revenue. Financial analysis reveals apple farming to be a profitable venture, with a benefit-cost ratio of 1.88, a net present value of NRs. 119,266.17 per ropani over a 20-year period, an IRR greater than the discount rate, and a short payback period of 8 years. Sensitivity analysis shows resilience to cost increases, output reductions, price declines, and production delays. The study provides a valuable guide to stakeholders, offering insights into the economics of apple production over a 20-year span. It further encourages them to consider apple cultivation in currently unused areas suitable for production due to the lack of persuasive financial statements and viable business plans for the profit-cost scenario. Overall, the study affirms the financial feasibility of apple production in Darchula District, particularly with the adoption of modern farming practices, improved irrigation, and enhanced transportation infrastructure to support apple production and marketing growth. Furthermore, future research can be directed towards an in-depth analysis of market trends and consumer preferences, which could further enhance the understanding of apple marketing dynamics and help create tailored strategies for maximizing profitability and sustainability of apple production in the Darchula district of Nepal.
Authors’ contributions
Krishna Raj Pandey created the idea of research, conducted surveys and collected primary data, conducted data analysis, wrote the paper, revised the paper, and submitted it to the journal. Madhav Prasad Neupane helped to revise and gave valuable suggestions during the manuscript preparation. Yagya Raj Joshi, Asmita Paudel, and Sushil Khatri helped with proofreading and provided necessary amendments to the manuscript.
Disclosure statement
No potential conflict of interest was reported by the author(s).
Acknowledgement
The authors extend their sincere and profound gratitude to the apple farmers of Darchula district for their invaluable support during the course of this research. A special note of appreciation goes to the agriculture technician at Apple Zone, Mr. Dipak Dhami, for his invaluable assistance in accessing the registered farmers' data. Last but certainly not least, the authors wish to express their gratitude to all individuals who contributed to the success of this research.
Data availability statement
The data that support the findings of this study are available from the corresponding author upon reasonable request.
Additional information
Funding
Notes on contributors

Krishna Raj Pandey
Krishna Raj Pandey is an agriculture graduate from the Agriculture and Forestry University (AFU) of Nepal. As a young researcher and aspiring academic, he has established a substantial research background with multiple scientific publications in several national and international peer-reviewed journals. His research interests encompass various domains, including agronomy, plant pathology, horticulture, and agricultural economics. He has previously worked as a research intern at the Prime Minister Agriculture Modernization Project, Project Implementation Unit (PMAMP-PIU) in Darchula, and later as a field technician at the Agriculture Knowledge Centre (AKC) in Darchula, Nepal. Driven by an unwavering passion and dedication for agriculture, he aspires to continue pursuing his research interests and make significant contributions to the field.
References
- Adhikari, J. (2012). Economics of organic apple production in Jumla District, Nepal: A case of the high hills of Nepal: Patmara and kartikswami VDCs of Jumla, Nepal. LAP lambert academic publishing. https://www.amazon.com/Economics-Organic-Apple-Production-District/dp/3659138428
- Amgai, S., Adhikari, B. K., & Kadariya, M. (2016). Economic analysis of cost of production of apple in Mustang district of Nepal. Journal of Agriculture and Environment, 17, 141–19. https://nepalindata.com/media/resources/bulkuploaded/The_journal_of_Agriculture_and_environment_2016_eng_may_17.pdf
- Amgai, S., Dutta, J. P., Regmi, P. P., & Dangol, D. R. (2015). Analysis of marketing practices of apple in Mustang district of Nepal. Agriculture Development Journal, 11, 2091–2746. https://www.researchgate.net/publication/356128451_Analysis_of_Marketing_Practices_of_Apple_in_Mustang_District_of_Nepal
- Atreya, P. N., & Kafle, A. (2016). Production practice, market and value chain study of organic apple of Jumla. Journal of Agriculture and Environment, 17, 11–23. https://doi.org/10.3126/aej.v17i0.19855
- Bayav, A., & Karli, B. (2020). The comparison of apple production costs in Isparta and Karaman provinces. Mustafa Kemal Üniversitesi Tarım Bilimleri Dergisi, 25(2), 225–236. https://doi.org/10.37908/mkutbd.687080
- CBS. (2011). National census 2011, Central Bureau of Statistics. Retrieved from March 10, 2022 https://unstats.un.org/unsd/demographic/sources/census/wphc/Nepal/Nepal-Census-2011-Vol1.pdf
- DDC. (2020) . Brief introduction to Darchula district. District Development Committee.
- Devkota, T. R., Bist, V., Adhikari, S., & Dhungana, S. (2017). Resource productivity analysis of apple production in Jumla district, Nepal. Journal of Pharmacognosy & Phytochemistry, 6(6S), 1102–1104.
- Fadavi, R., Keyhani, A., & Mohtasebi, S. S. (2011). An analysis of energy use, input costs and relation between energy inputs and yield of apple orchard. Research in Agricultural Engineering, 57(3), 88–96. https://doi.org/10.17221/0/2010-RAE
- Fernando, J. (2021). What is the formula for calculating net present value (NPV)? Retrieved from September 14, 2022 https://www.investopedia.com/ask/answers/032615/what-formula-calculating-net-present-value-npv.asp
- Gayak, B., Pandey, S. R., & Bhatta, S. (2020). Economics of production and marketing of apple (Malus domestica) in Mustang, Nepal. International Journal of Agriculture Environment and Food Sciences, 4(4), 483–492. https://doi.org/10.31015/jaefs.2020.4.12
- Gül, M., & Erkan, O. (2005). Economic analysis of apple farming in the trans taurus mountains region. Journal of Faculty of Agriculture of ÇÜ, 20(4), 87–96. https://www.researchgate.net/publication/324080384_Toros_Daglari_gecit_bolgelerinde_elma_uretiminin_ekonomik_analizi_Cukurova_Universitesi_Ziraat_Fakultesi_Dergisi_2087-96
- Huirne, R. B. M., & Dijkhuizen, A. A. (1997). Basic methods of economic analysis. In A. A. Dijkhuizen, & R. S. Morris (Eds.), Animal health economics: Principles and applications, Post graduate foundation in veterinary science (pp. 25–40). University of Sydney.
- Kagan, J. (2021). Payback period. Retrieved September 10, 2022. https://www.investopedia.com/terms/p/paybackperiod.asp
- Kashyap, R., & Guleria, A. (2015). Socio-economic and marketing analysis of apple growers in Mandi district of Himachal Pradesh. Journal of Hill Agriculture, 6(2), 202–206. https://doi.org/10.5958/2230-7338.2015.00044.0
- Khadka, P., & Solberg, S. Ø. (2020). Apple value chain analysis in two mountainous districts in Nepal. Journal of Agricultural and Crop Research, 8(1), 1–10. https://doi.org/10.33495/jacr_v8i1.19.139
- MoALD. (2020). Statistical information on Nepalese Agriculture 2075/76 [2018/19], Kathmandu; Ministry of Agriculture and Livestock Development. Retrieved from December 14, 2022. http://doanepal.gov.np/downloadfile/Statistical%20information%20on%20Nepalese%20agriculture_1601976502.pdf
- MoALD. (2021). Statistical information on Nepalese Agriculture 2076/77 [2019/20], Kathmandu; Ministry of Agriculture and Livestock Development. Retrieved from september 27, 2022. https://moald.gov.np/wp-content/uploads/2022/04/STATISTICAL-INFORMATION-ON-NEPALESE-AGRICULTURE-2076-77-2019-20.pdf
- O’Neill, A. (2022). Nepal: Distribution of Gross Domestic Product (GDP) Across Economic Sectors from 2011 to 2021. Retrieved from Statista November 23, 2022. https://www.statista.com/statistics/425750/nepal-gdp-distribution-across-economic-sectors/
- Sapkota, D., Acharya, M., Gautam, S., & Kumar, P. (2022). Economics of apple production in Chandannath municipality, Jumla, Nepal. Journal of Current Research in Food Science, 3(2), 27–31.
- Uzunöz, M., & Akcay, Y. (2006). A profitability analysis of investment of peach and apple growing in Turkey. Journal of Agriculture and Rural Development in the Tropics and Subtropics, 107(1), 11–18.