
 ?Mathematical formulae have been encoded as MathML and are displayed in this HTML version using MathJax in order to improve their display. Uncheck the box to turn MathJax off. This feature requires Javascript. Click on a formula to zoom.
Abstract
This study investigated the relationship between agricultural market imperfections and multidimensional rural poverty in Ethiopia’s Sidama Region in 2022. And this study used qualitative and quantitative methodologies. A multi-stage sampling method was used to select 400 sample sizes. Descriptive statistics method was used to find out modes of agricultural market imperfections, and Tobit model was employed to capture the effects of agricultural market imperfections on multidimensional rural poverty. And the multidimensional poverty index (MPI) technique was employed to measure the severity of multidimensional rural poverty. Apart from what they have traditionally done by themselves, about 23% of people lack knowledge about how to produce and where to sell using modernized information. The Tobit model was also employed to figure out how market imperfections affected multidimensional poverty in the study area. This study showed that 43% of farmers transport their goods by carrying them on their shoulders to the market. For farmers with asymmetric information, the multidimensional poverty index (MPI) is expected to have a value of 0.4354 higher than those with symmetric information. Furthermore, the Tobit model’s findings showed that labor, improved seed, farm size, cooperative membership, and commercialization experience significantly negatively impacted multidimensional rural poverty. And asymmetric information, transaction cost, and infrastructure inaccessibility had a statistically significant and positive impact on multidimensional poverty. Hence, improving input usage and creating access to agricultural market information is a foundation for reducing multidimensional rural poverty.
PUBLIC INTEREST STATEMENT
Agriculture is the backbone of the Ethiopian economy. Most Ethiopians are farmers and have faced the severity of multidimensional rural poverty. Imperfect agricultural markets constrain them from escaping multidimensional poverty. And the inaccessibility of information to produce and sell their agricultural products is a major problem. Therefore, it requires taking critical actions to solve it. This article addresses the key problems to the country’s policymakers, academic workers, researchers, farmers, and other stakeholders to plan to solve the problems in the future. Furthermore, it is used for utilizing the country’s agricultural productivity and accessibility of the markets to improve the living standard of rural households. Hence, this study aimed at the effects of agricultural market imperfections on multidimensional rural poverty in the Sidama Region of Ethiopia. Moreover, appropriate policy implications have been forwarded in this paper.
1. Introduction
The agriculture sector is regarded as the main source of income for rural households and plays a crucial role in driving rural development (Gascón, Citation2015). Farmers in developing nations are subject to market imperfections and various forms of limitations known as market failure. Smallholder farmers in developing nations frequently suffer from the inaccessibility of markets brought on by high transaction costs and asymmetric information. Inaccessibility to markets, high transaction costs, the lack of farmer insurance markets, market asymmetry, and the absence of extension and technical help are other market imperfections (Sekhar, Citation2021). And as a means of lowering rural poverty, reducing market imperfections is getting high consideration in rural areas.
Any market structure that does not adhere to perfect information flow constitutes a market imperfection and results in inefficient resource allocation (Sekhar, Citation2021). Hence, farmers are steered toward economically inefficient resource allocation and suboptimal utilization due to market imperfections both in input and product markets (da Silva et al., Citation2018).
Additionally, farmers sell their goods for less money and purchase production inputs at higher costs, which causes agricultural production to fluctuate. Market imperfection is the biggest obstacle preventing farmers from accessing knowledge, technology, markets, and productive packages. Several parties, including the Ethiopian government, have developed various policies and programs to address this issue. Furthermore, the Ethiopian government and donors broadly recognize sustainable agriculture development policy as a crucial element of a strategy to reduce rural poverty by reducing market imperfections (Wardhana et al., Citation2017).
In Ethiopia, the viability of the well-being of farmers remains a major concern of the Ethiopian government. The Ethiopian government and foreign donors have started several research projects to address the issues caused by agricultural market inefficiencies. To promote sustainable agricultural development and decrease multidimensional rural poverty, existing studies were intended to identify the factors contributing to overpopulation, land degradation, deforestation, overgrazing, soil infertility, poor output levels, ineffective marketing, etc (Adepoju & Oyewole, Citation2020; Oljira & Mulatu, Citation2022; Wardhana et al., Citation2017).
Studies employing the Tobit model model to examine the linkage between agricultural market imperfection and multidimensional rural poverty were lacking. Multidimensional poverty was measured by multidimensional poverty index (MPI) and regressed on variables of agricultural imperfect market and other control variables to assess how proposed agricultural imperfect market will affect Ethiopian agricultural productivity and rural poverty. This model simulations have not, as far as I’m aware, been specifically employed in earlier research to recommend improved agricultural strategies to Ethiopian policy-makers. The simultaneous incorporation of control variables in the model is a significant advance in this work. As a result, the work closes a knowledge gap in the literature on agricultural policy modelling. Moreover, this study was intended to pinpoint the modes of market imperfection and its remedial measures to eradicate multidimensional poverty. Hence, the study adds to the little body of knowledge about empirical literature.
1.1. Literature
Markets are important for the spatial and temporal distribution of inputs and outputs, adding value to raw materials to produce finished goods, information flow, and risk management (Barrett & Mutambatsere, Citation2008). According to the first welfare theorem of neoclassical economics, competitive market equilibria allow for efficient resource allocation and maximize overall well-being. Developing countries’ agricultural markets operate much less effectively than the theories suggest (Barrett & Mutambatsere, Citation2008; Harriss-White, Citation1999). Imperfections are deviations from ideal market conditions which are common in rural marketplaces in developing countries. The neo-classical theories do not consider the inefficiencies brought on by imperfect property rights, poor contract oversight and enforcement, high transaction costs, and certain liquidity constraints (De Janvry et al., Citation1991; Holden et al., Citation2001).
In response to neoclassical economic theory’s flaws, the New Institutional Economics (NIE) movement has embraced the ideas of imperfect markets, uncertainty, and transaction costs. In the face of uncertainty, NIE thought that market institutions could lower the costs of managing information, transactions, and property rights (Bardhan, Citation1989). It is crucial to acknowledge the complexity and diversity of agricultural markets around the world. By distributing savings and reinvested profits, markets act as pricing channels and a mechanism for transferring resources between sectors. They are also locations where workers and small producers are taking advantage of what they provide to the market (Harriss-White, Citation1999).
It is well known that the main goal of agriculture is to increase economic, environmental, and social sustainability. Since, like any other industry, agriculture’s capacity to survive depends on its ability to remain sustainably profitable over time, financial sustainability is a big concern for farm households. Farm survival, food security, and farmers’ welfare significantly impact farm profitability (Tey & Brindal, Citation2015). Given issues like rising cultivation costs and inadequate output price realization, among others, improving the efficiency of factors and the product market in rural areas is essential for the welfare of farm households. Market imperfections make it difficult for farm households to decide what to produce and consume. Farm households will implicitly encounter various factor pricing ratios when factor markets are flawed (Brandt, Citation1987). This shows that farm households will have different output-input ratios and the best factor combinations in a profit-maximizing scenario (ibid). For instance, if factor markets in rural areas are successful, households with small landholdings that cannot absorb the supply of family labor should be able to hire out some of their labor or rent additional land to alleviate the restriction (Brandt, Citation1987). However, when the labor and housing markets are inefficient, these households must use their land more intensively by investing more labor and other inputs per unit (ibid).
Furthermore, compared to well-known and wealthy farmers, small and poor farmers are more likely to experience market imperfections (Holden & Binswanger, Citation1998). For example, poor farmers have a lower chance of accessing credit markets, which limits their ability to solve their issues through consumption smoothing (coping strategies). In addition, defective markets perpetuate poverty over generations (Singh et al., Citation1986). To overcome the inefficiencies caused by faults in the rural market, government interventions, such as support pricing, procurement, input provision, and subsidies, are extremely important. Farm households also create strategies to reduce the welfare costs associated with these market failures utilizing the limited resources at their disposal due to the pervasiveness of market flaws and limitations (De Janvry & Sadoulet, Citation2006). It is critical to comprehend how farm households deal with such a demanding environment. The studies on rural market flaws that are currently available are reviewed in the section that follows while keeping these challenges in mind. The rural market has flaws, which may be evident in the input markets and problems with labor, credit, and land. Each variable’s shortcomings, the reasons for their existence, and the difficulties they pose to farm households are briefly reviewed in light of prior studies on market faults.
1.1.1. Labor market imperfections
One interesting observation is the correlation between high agricultural labor productivity in wealthy nations and the extensive usage of intermediate inputs supplied by non-agriculture. It is well known that industrial growth makes it possible to supply agriculture with labor-saving intermediate inputs at affordable costs. Using the intermediate inputs intensively to generate a given agricultural output increases labor productivity. However, the low labor productivity in agriculture is responsible for impoverished countries’ poverty and low aggregate productivity since a large portion of their labor force is allocated to agriculture, a sector in which they are particularly underproductive (Nishida, Citation2012).
Large farms use hired labor, permanently or seasonally, whereas small farms typically use family labor to complete farming tasks in developing countries. Due to its role as the risk taker and residual claimant, family labor is believed to be highly motivated. Family laborers exert more effort and discretion than hired laborers, who require continual supervision (Heltberg, Citation1998). Supervisory costs are incurred when hired labor is used instead of family labor. Search and hiring costs and supervision costs are involved with hiring outside labor. Moral hazard problems with hired employees cause defects in the labor market. Furthermore, some or all labor markets might not exist or only exist during certain seasons (Heltberg, Citation1998).
1.1.2. Land market imperfections
Because of the uncertainty caused by ambiguous and inadequate land reform legislation, Marshallian inefficiency, and transaction costs, land rental markets exhibit faults. It is thought that imperfect land markets result in sticky operational and rigid owned holding (Heltberg, Citation1998). Due to unique land reform rules, long-term leasing arrangements on land might be problematic for the proprietor (such as the “land to the tiller” rule). Because the landowners are concerned that the tenants would inherit the land if the law is upheld. As a result, the price of renting land and the likelihood of property loss are related. Such actual or imagined threats from land reform may hamper the effective operation of the land rental markets.
Additionally, Marshallian inefficiency would lead to lower input consumption and lower profit on plots with joint tenancy (Cheung, Citation1969; Holden et al., Citation2001). A shared tenancy, a land rental agreement, calls for paying rent as a specific portion of the crop. Tenants in such a situation are less inclined to invest than an owner-cultivator would be since their marginal returns on effort and input are far lower than the relevant marginal products. In light of this, it was determined that owner cultivation and fixed rent tenancy were superior to sharecropping (Unal, Citation2012).
According to Cheung (Citation1969), transaction costs differ depending on the kind of tenancy, with sharecropping having a disproportionately higher transaction cost (including bargaining and enforcement costs) than wage contracts and fixed rent tenancies (enforcement costs). However, various types of homes are associated with varying levels of risk. For instance, in fixed-rent leases, all risks are taken by the tenants; in wage contracts, all risks are assumed by the landlord; and in share tenancies, all risks are equitably distributed. Due to the benefits of risk sharing, all ways of living are efficient despite having differing transaction costs. According to Stiglitz, fixed-rent tenancies are preferred when enforcement costs are high, while sharecropping is preferred when the tenant is risk-averse (Stiglitz, Citation1974). Farmers may lower risk by diversifying their holdings if credit or insurance markets improve. Therefore, sharecropping ought to be eliminated. Other explanations for the existence of different tenancies are uncertainty and inefficient rural markets (Bardhan, Citation1977). Due to the imperfections in markets, the dissociability of many inputs, the diversity of managerial skills among people, and the prevalence of uncertainty, a wide range of housing types are possible (Unal, Citation2012).
The markets for buying and selling land are not without flaws. The markets for the available land could be marginal or nonexistent. Land sales markets are affected by a variety of causes. For instance, selling land to strangers in various parts of the world might be illegal. Another important factor is crop failure. Crop failure is a covariate risk that has an equal impact on all households in a certain area. However, wealthy farmers are generally better able to cope because they have better access to credit markets and more important asset positions. Poor individuals are forced to hunt for alternative means of balancing their consumption due to a lack of insurance markets and restricted access to credit markets. This frequently ends in distressed land sales to the region’s wealthier farmers. The existing unbalanced distribution of land is further distorted in favor of large farmers by this. Even during periods of exceptional crop, land prices are typically far higher than the anticipated average profits from farming due to the insurance, inflation-hedge, savings, prestige, and collateral features of the land. This implies that, even if finance were available for land acquisitions, debt repayment would still require non-farm income (Binswanger & Deininger, Citation1997). Due to these factors, the actual distribution of land will likely differ significantly from the ideal distribution, which would maximize output or efficiency.
Generally speaking, the markets for renting land are more active than those for buying it. Due to flaws and manipulations in the land leasing and sales markets, farmers cannot successfully match the size of their owned and operated farms to their endowment of family labor and other fixed assets (Heltberg, Citation1998). Socially vulnerable communities need access to land to preserve their way of life as well as their cultural and social identities. Therefore, improving the land market’s efficient and equitable operation is essential to raising the rural population’s capacity for self-sufficiency.
1.1.3. Credit market imperfections
Formal financial institutions ration the quantity of credit granted to the farm sector due to agriculture’s inherent risks and information asymmetry (Heltberg, Citation1998). Farmers must offer financial institutions collateral in land or other fixed assets to obtain loans. As a result, households in the agricultural sector face loan or liquidity issues. Lack of access to funding may make it more difficult for farmers to rent or purchase essential inputs, such as land, labor, fertilizer, and other supplies. Numerous theoretical and empirical studies have demonstrated that several market flaws cause the loan market in developing countries to operate inefficiently. Asymmetric information, adverse selection, and moral hazards are issues. You can get around the moral hazard problem by using collateral. However, lenders will consider the farmers less creditworthy due to a lack of or difficulty in obtaining assets to serve as collateral (Holden & Binswanger, Citation1998).
1.1.4. Product market imperfections
Obviously, the worst market imperfections include missing markets, partially missing markets caused by rationing or seasonality, thin markets caused by unfair competition, and interconnected markets (Holden & Binswanger, Citation1998). The main causes of pervasive market faults include asymmetric information, moral hazard, transaction costs, and covariate risk. To get past the problem of not being a full set of marketplaces, the same participants in an interlocking system of exchange engage in various transactions. Rural business is therefore characterized by interlinkage. In Indian agricultural markets, interlocked factor markets—which happen when two markets are linked together in an intertemporal contract by integrating two independent transactions into one contract—were common (De Janvry et al., Citation1991). The private insurance markets in countries like India are ill-equipped to deal with these issues because of the insurer’s vulnerability; Binswanger and Deininger (Citation1997) linked to the significant systemic and covariate risk inherent in agriculture and the significant transaction costs related to dealing with millions of small farmers.
Alternative institutional arrangements are developed to fill the hole left by failing markets (De Janvry et al., Citation1991). A sharing contract, labour exchange, or extended family arrangement could be created through these agreements. Due to ambiguous property rights and a lack of information, these arrangements are thought to have high-efficiency costs. De Janvry et al. (Citation1991) stressed the significance of carefully balancing the advantages of improved institutional and market performance to achieve higher efficiency and welfare.
However, research and subsequent development experiences showed that market failures were related to installed capacity, where the learning process plays a crucial role. The state may considerably boost the economy’s potential for learning by recognizing the following two considerations. One is that, despite markets frequently not functioning properly, they have a significant role in monitoring producers to stop resource waste. The other is that institutional adaptations might not always occur spontaneously in a changing context. The right kinds of market institutions can be supported and encouraged by the government. When market signals are ineffective, appropriate non-market institutions must be created. A system of market and non-market institutions must be developed for civilizations to advance. The state can correct market failures in the case of commissions and omissions by taking market-excluding and market-complementing measures (Sekhar, Citation2005).
2. Conceptual framework
Alkire and the indicators forwarded MPI, which measured multidimensional rural poverty. The multidimensional poverty index (MPI) was represented in three dimensions and ten indicators. Each home is assigned a deprivation score based on the MPI assessment, and depending on the score, households are divided into poor and non-poor categories. The weighted sum of the scores for each indicator is used to get the deprivation score for each family. Each person has a deprivation score, which goes from 0 to 1. That household is not poor if the score is 0.
Similar to how the score grows, so does the person’s poverty, which peaks at 1 when they are devoid of all indicators. If a household is deprived in a combination of indicators with a weighted sum exceeding 33% of deprivations, then and only then is it considered multidimensionally poor (Alkire, Citation2018). Then, using the conceptual framework developed below, the effects of an imperfect agricultural market on multifaceted rural poverty were captured in the study area (Figure ).
Figure 1. Conceptual framework of socio-economic determinants of rural poverty.
3. Materials and methods
3.1. Description of the Study Area
The Sidama Region is located 275 km south of Addis Abeba, the capital of Ethiopia. It is one of Ethiopia’s 10 regions and, for administrative reasons, comprises 36 rural woredas. The Oromiya region borders the region on the north, east, and south, and the West by the Bilate River, which divides it from the Wolayita zone (Figure ). The Sidama region’s capital is Hawassa City. On 18 June 2020, it was created from the Southern Nations, Nationalities, and Peoples’ Region (SNNPR). The former Sidama Zone administration upgraded from a zone (lower level) to a region (higher). In a 2019 referendum, 98.52% of voters approved becoming a Region. Sidamigna (also known as Sidaamu Afoo) is a Cushitic language spoken by about 5 million people in the Sidama region as of 2017. The Sidama Region consists of three agroecological zones such as the highlands (32%), the midlands (48%), and the dry midlands/lowlands (20%).
Figure 2. Administrative map of the Sidama region.
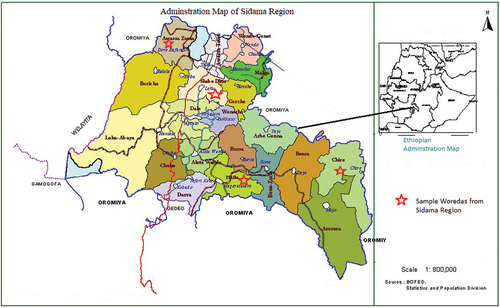
The Sidama Region is renowned for its extensive, varied, and well-established agroforestry systems, which co-produce various annual and perennial crops. According to CSA 2010/11, the region’s economy is largely centered on agriculture, which is the primary generator of jobs, export revenue, and livelihoods.
3.2. Study design
In this study, both qualitative and quantitative methodologies were used. The qualitative method aids in locating specific data, enhancing the study’s investigation. The quantitative approach produces solid outcomes when analyzing quantitative data analytically.
3.3. Types and sources of data
Both primary and secondary data types were employed in this investigation. Primary data sources were gathered from households using data collection tools like key informant interviews, focus groups, and structured questionnaires. Secondary data were gathered from reports of various organizations, including the central statistics authority, the national bank, the Ministry of Planning and Development, the finance bureau, the agriculture office, the Ethiopian economic association, and the finance bureau; articles and journals, books, and magazines. The information gathered from various sources dealt with the characteristics of agricultural markets and rural poverty.
3.4. Sample size determination and sampling procedures
A formula that most clearly and accurately expresses the proportion of the target population was chosen to estimate the sample size. The following formula was used (Madow, Citation1968): n = Where n means the sample size, N is the population size, e (5%) represents the level of precision of error margin, and
is the total rural population of four Woredas (CSA, Citation2013). Hence,
The sample size was 400 as a result. The chosen sample size was chosen using a multi-stage sampling process. The Sidama region was selected at the first stage using a purposive sample technique out of the 11 regions of Ethiopia because it has several imperfect markets. In the second stage, the Sidama Region is clustered into four zones (administrative structure), one capital city administration (Hawassa City administration), and 36 districts known as woredas. Only those four zones and thirty Woredas, which comprise the rural population, were considered in this study. Northern, Central, Southern, and Eastern Zones are those Zones approved by the State Council in 2022. As a result, there are 8, 6, 8, and 8 Woredas in each administrative zone, respectively. Since there are nearly equal numbers of woredas in each zone, one Woreda from each zone was chosen randomly in the third stage, as shown in Table . In the fourth stage, sample households were chosen by random sampling method from each Woreda according to the percentage of the rural population size (Table ).
Table 1. Targeted rural population and sample size distribution among sample Woredas
3.5. Dimensions and indicators of multidimensional poverty measurement
Selecting a few pertinent dimensions before utilizing MPI to assess poverty is essential. Using the Alkire and Foster selection criteria for OPHI, the global MPI employs three dimensions and ten indicators that are implicit mirror images of the HDI (2018). The weights for each MPI indicator that measures poverty will be determined in this phase. Because weighting systems can be difficult to interpret, choosing the dimensions so their weights are similar can be helpful (Alkire, Citation2018). Each of the three dimensions receives a third of the overall weight in this study because they are all equally weighted. Then, some indicators within each corresponding dimension are given equal weight. As a result, the weight assigned to each indicator within the health and education dimensions is 1/6 (1/3 divided by two indicators each). Comparatively, the weight assigned to each indicator within the living condition dimensions is 1/18 (1/3 divided by six indicators). The summation of the weights of each indicator i is given as . Deprivation cutoffs in this analysis were based on the internationally accepted UNDP standards (Alkire, Citation2018). This stage replaces the individual’s score with their status in relation to each cutoff; individuals are categorized as deprived or not for each indicator. The process is repeated for all indicators for all other dimensions. The deprivation score for each family is then calculated using the deprivations in each component indicator. The weighted sum of each person’s deprivations is used to calculate their deprivation score, which ranges from 0 to 1, or between 0% and 100%. As a person experiences more deprived conditions, their score increases until it reaches a maximum of 1 when they are deficient in all component indicators. A person with zero deprivation in indicators receives a score of 0. Formally:
Where I is the score of each indicator, and wi is the weight given to each indicator i with
The proportion of (weighted) deprivations a person must endure to be considered poor is known as the poverty cutoff, or k (for short). As a result, someone is deemed poor if their deprivation score is equal to or higher than the poverty cutoff. The MPI identifies a person as poor if their deprivation score is greater than or equal to one-third. In other words, a person must have at least a third of the (weighted) indicators of deprivation to be considered MPI poor. This is known as censoring in the measuring of poverty and is replaced with a “0” for individuals whose deprivation score is below the poverty cutoff, even if it is not zero by what we call it censoring. To identify the censored deprivation score from the original Ci(k) deprivation score, we use the symbol Ci. Note that when Ci ≥ k, then Ci (k) = Ci, but if Ci< k, then Ci (k) = 0. Ci (k) is the deprivation score of people experiencing poverty.
3.5.1. Multidimensional Headcount ratio (H)
measures the percentage of people experiencing poverty. It is a useful metric, but the level of deprivation felt by people experiencing poverty has little bearing on it. It cannot be broken down to look at how different groups of people experience poverty. Mathematically, the parameter k
where q (k) represents the number of multidimensionally poor households and n is the total number of people.
3.5.2. The intensity of multidimensional poverty (A)
It is described as the typical percentage or degree of weighted indicators of deprivation felt by multidimensionally poor households, mathematically, written as
. where q represents the proportion of multidimensionally poor people, and Ci (k) is the censored deprivation score of individual i. A is the average number of hardships experienced by the impoverished. It was calculated by multiplying the overall number of people experiencing poverty by the percentage of overall deprivations each person experienced.
By multiplying headcount poverty by the “average” number of deprivations experienced by all poor people, it is possible to determine the breadth of deprivations experienced by multidimensionally poor households. According to the overview, the MPI includes two essential pieces of data: (1) the proportion or frequency of people (within a specific population) who experience numerous deprivations; and (2) the severity of their deprivation or the average percentage of (weighted) deprivations they experience. The multidimensional index, M0=HxA, combines the two dimensions, H and A. This study used three dimensions to measure multidimensional rural poverty: education, health, and standard of living. Based on the data accessibility and the global multidimensional poverty index, 10 indicators that reflect three dimensions were chosen (OPHI’s Alkire, Citation2018). The dimensions, indicators weights, and associated cutoffs used to identify poor households are shown in the following Table .
Table 2. The dimensions, indicators, deprivation cutoffs, and weights of the MPI
3.6. Specification of econometric model
In cases where the dependent variable is a continuous variable with a limited range, the Tobit regression model offers the best fit. The multidimensional poverty index (MPI) household scores were utilized to represent poverty as a continuous variable. As a result, for this investigation, the Tobit regression model was preferable to the binary Logit and Probit Models. Binary Logit and Probit models have fundamental flaws because they lump all poor households together. The weakness of logit and probit models occurs when translating household spending by households into a dichotomous variable since they are not all relatively equally wealthy or poor (Abdul-Salam & Phimister, Citation2019). Therefore, the Tobit regression model was employed to ascertain the connection between market imperfections and poverty. Various studies have previously defined and utilized this analytical model and specified below (Andrew & Campbell, Citation1996) as follows:
Where is the latent variable representing the multidimensional poverty index of the ith respondent,
are parameters to be estimated, and Zi is a component of an imperfect market and control variables that affect poverty. And
= an error term that is independently and normally distributed with mean zero and variance
. And individual-specific MPI scores for the individuals range between zero and one. Therefore, the Tobit model can be presented as follows.
The two-limit tobit model permits censoring in the distribution’s tails (Geta et al., Citation2013). The log-likelihood is derived from sets of the two-limit Tobit model using doubly censored data.
Each marginal effect in a Tobit model considers how the explanatory variables may affect the likelihood that the dependent variable will fall in the uncensored part of the distribution and the expected value of the dependent variable under the assumption that it will be more prominent than the lower bound. The probability function decomposition of the marginal effects of the Tobit model was proposed as follows (Geta et al., Citation2013):
(1) The unconditional expected value of the dependent variable
(2) The expected value of the dependent variable is conditional upon being between the limits.
(3) The probability of being between the limits
where,
are standardized variables that came from the likelihood function given the limits of y* and
standard deviation of the model.
3.7. Variables used in the study
3.7.1. Dependent variables
Multidimensional poverty, which is the dependent variable in this study, is measured by the MPI and includes dimensions related to health, education, and living standards (for measurement-related issues, refer to Table above). The value of MPI for multidimensional poverty cutoff (k) equals one-third of the weighted indicators at k = 3 was chosen as the threshold for assessing whether a household is multidimensionally poor. It uses an MPI value, which is between 0 and 1. To distinguish between the poor and non-poor, the estimated MPI value of rural multidimensional poverty at the lower limit or censored from left at the 0.333 thresholds is utilized. Any household with an MPI value below 0.333 is filtered below the lower limit and classified as non-poor. Households with an MPI value above 0.333 are deemed to be poor.
3.7.2. Explanatory variables
In this study, explanatory variables were operationally defined as follows:
3.7.2.1. Sex of household head
This is a reference to the sex of the household’s head. If a man is the head of the family, the value is binary 1; otherwise, it is 0.
3.7.2.2. Age of household head
is the age level of household head and measured in a year.
3.7.2.3. Family size
This denotes the household’s family number. And used as a proxy variable for demographic factors that affect rural poverty.
3.7.2.4. Improved inputs utilization
It is anticipated that households that employ contemporary agricultural inputs at the required rate and improved inputs could produce more crop yields and hence have a greater chance of improving their poverty. If the household used improved inputs, the variable was 1; otherwise, it was 0. Used as a proxy variable to capture the effects of the productivity of farms on rural poverty.
3.7.2.5. Labor
If the household used only family labor, the variable was 0; otherwise, (hired labor and family labor) was measured as 1. Used as a proxy variable to capture the effects of labor productivity on rural poverty.
3.7.2.6. Utilization of credit
To enhance and diversify their income and lift themselves out of poverty, it is projected that households with access to credit were more likely to engage in off-farm activities like owning plowing oxen. The variable has a value of 1 if the household has access to cooperatives or microloans for rural financing; otherwise, it has a value of 0. Additionally, it is a proxy variable of capital finance, used to measure the impact of institutional determinants on rural poverty.
3.7.2.7. Commercialization
This variable tries to capture the experience of participation in trade or commercialization and its effect on rural poverty. It was measured as 1 if the household produced for market in addition to own consumption and 0 otherwise.
3.7.2.8. Infrastructure inaccessibility
The distance to the main market was utilized to account for the impact of the construction of roads and market facilities in rural areas. Thus, it suggests that living away from the nearest market disadvantages households by raising the transportation costs associated with buying inputs, discouraging households from buying more inputs, and resulting in inefficiency.
3.7.2.9. Asymmetric Information
This variable is related to access to information about input and output markets. It was measured as 1 if households have access to information and 0 otherwise.
3.7.2.10. Transaction cost
It refers to the bureaucratic process to get inputs of production from government offices. It was measured as 1 if the household faced bureaucracy and 0 otherwise.
3.7.2.11. Farm size
The cultivated land owned by households is expressed in hectares. Families with large tracts of cultivated land should have the opportunity to earn more money from agriculture and related activities, reducing their risk of falling into poverty because the land is a critical resource and factor in production.
3.7.2.12. Fertilizer
If the household used fertilizer required amount on time, the variable was 1; otherwise, it was 0. It was used as a proxy variable to capture land fertility effects on rural poverty.
4. Results and discussions
4.1. Coverage of major cash crops
Concerning the growth of cash crop products, the area of land occupied by significant cash crops has occasionally been declining. According to Table , 75% of farmers claimed that the land used for major cash crops has decreased, while 16% of respondents claimed that this area has risen. Additionally, about 9% of farmers said their cash-harvesting farm has not changed. Rural life is tied to important cash crops either directly or indirectly, which poses a serious dilemma for the community in the future. According to the focus group discussion, almost all farmers complained that agricultural production inputs were expensive. The sole supplier of major inputs is the government, the inefficient service provider in the study area; the absence of private suppliers in the area was one of the major problems in accessing production inputs. In addition, some had transport problems accessing the input market.
Table 3. Status of farm covered by major cash crops
The highland cash crop farms were not degrading greatly despite being harvested mostly for their consumption and sale in local markets, according to focus group discussions about the significant cash crop farms and the consensus reached throughout the numerous focus group talks. However, the lowland and midland cash crop farms were deteriorating and swiftly extinct. Table shows that population growth (30% of households), adverse impacts of using inorganic fertilizers (23%), climatic change (19%), and overgrazing (15%) were the main causes of sterility of the land area used for cash crops and decrease in the production of cash crop production.
4.2. Sources and types of market information for farmers
Farmers can learn more about the crops they should grow using the right market information. The farmers use market information from various sources. As shown in Figure , out of 400 respondents, 30% (120) of the respondents (farmers) receive information from the government. Around 15% (60) of respondents were compelled to use information from local farmers, although it can occasionally be inaccurate and unreliable. And 19% (76) of people received market information from cooperatives. About 13% (52) of the respondents received information about the agricultural market from users, and 23% (92) did not know about where to sell, how to produce, or how to use it in a modernized manner as opposed to what they have traditionally done by themselves.
Figure 3. Source of market information about major cash crops product.
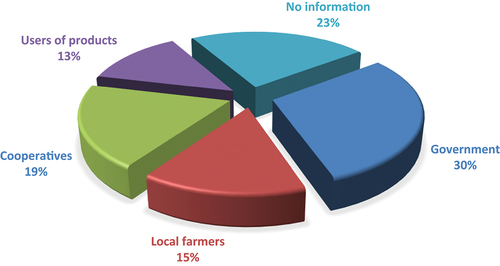
Figure illustrates how the farmers obtain information from several sources. As shown in the accompanying Table , these diverse sources of information provide further information on various topics that are directly or indirectly connected
Table 4. The information provided to the farmers
Table reveals the market’s demand for products, how to meet that demand, and where to sell those items. According to the findings of this study, 11% (34) of farmers receive information about where to sell their product, 20% (62) of respondents receive information about product demand, 24% (74) of respondents receive information about how to supply their products, 15% (46) of households receive information about the demand for their products and how to supply major cash crops to trees, and 12% (37) of respondents receive information about both supply and sale of their products. Moreover, 11% (34) have information on the level of demand and where to sell. However, only 7% (21) of farmers have complete access to information on how to produce, where to sell, and how much demand there is for their goods. To improve the quality and quantity of the important cash crop product, information assists farmers in obtaining higher or better prices for their goods. The research reveals that while some farmers receive information on many areas, complete information is not consistently accessible. This demonstrates insufficient market information on the goods they produce in this region.
4.3. Type of marketing and price determination methods
Farmers deal with customers to sell their goods locally. They may also deliver goods to the market by carrying them on their shoulders, riding horses, etc. Table displays the main cash crop goods that farmers are marketing.
Table 5. Different types of marketing methods
According to Table above, 15% (60) of respondents sell their products through retailers, 43% (172) of respondents sell their products to marketing intermediaries by a trip to the market by carrying their goods on their shoulders, 35% (140) of respondents sell their products to marketing intermediaries by coming to the village, and the remaining 7% (28) of respondents sell their products to the middleman by a trip to the market and dealers coming to the village. Pricing decisions heavily influence marketing choices. Most of the time, in the marketing system, producers and consumers jointly decide the product’s price at the farm and retail levels. The information on who decides the prices of the main cash crops in the research area is shown in Figure .
Figure 4. Price determination of major cash crops by percentage.
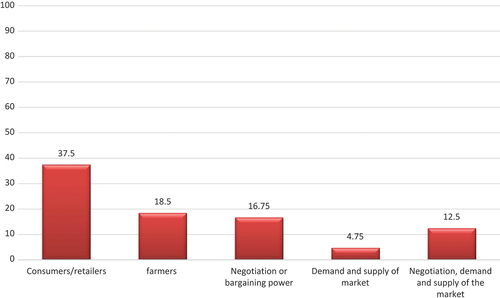
Figure shows that 37.5% of farmers said that users or consumers determine the price of their main cash crops. In addition, 18.5 % of farmers said that they set the prices for their goods. 4.75 % of respondents use market demand and supply to decide the price of their main cash crops, whereas 16.75% of respondents claimed that agricultural product prices are negotiated with the consumer or marketing middleman. The remaining 12.5% of respondents determine the pricing of their products through negotiations and market supply and demand.
Figure 5. Status of multidimensional poverty among rural households.
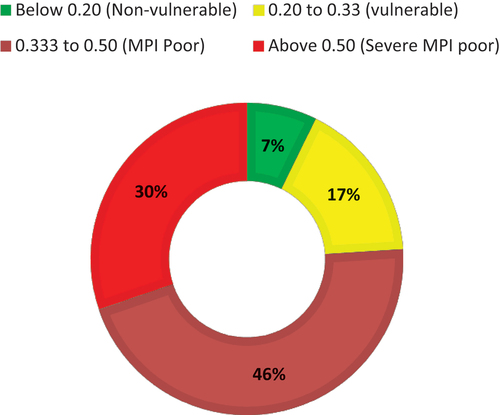
4.4. Distribution of multidimensional poverty scores among rural households
Figure presents the distribution of multidimensional poverty scores among rural households in the study area. Figure demonstrates that 46% of households had multidimensional poverty scores between 0.333 and 0.5 indexes, indicating a high incidence of multidimensional poverty. In contrast, around 17% percent of households were vulnerable to multidimensional poverty. Moreover, around 30% of households had greater than 0.5 multidimensional scores and faced high severity of multidimensional poverty, while only 7% were non-vulnerable to multidimensional poverty in the study area.
Figure explains that the index of multidimensional poverty measures declines as the poverty threshold (k) increases as proposed by OPHI (Citation2018). Higher values of the MPI indicate greater multidimensional poverty. The household is categorized as multidimensionally poor if the deprivation score is 33.33% or higher. Additionally, it shows the range of households classified as poor (H), the average level of deprivation (A), and the MPI score for households with k = 11.11%, 22.22%, 33.33%, … and 100%. Every family (100%) is deficient in at least one indicator meaning one indicator of deprivation is used as the poverty line (k = 11.11%). When the cutoff (k) value was 22.22%, 92% of households were classified as being multidimensionally poor, with an MPI of 0.488 values; 76% of households experienced poverty in three indicators, and 65% experienced it in four.
Figure 6. Incidence, intensity, and MPI with different cutoff (k) values.
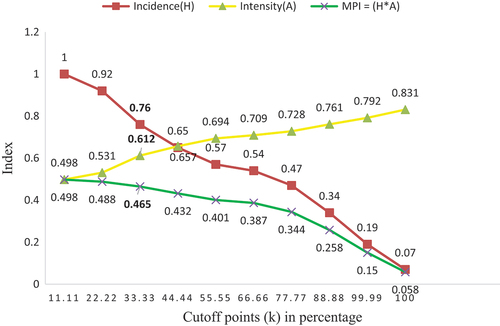
In contrast, at k = 100%, an H value was 0.07, meaning that 28 households were deprived across all dimensions. While the average intensity of multidimensional poverty rises among the families still classified as poor with higher values of k, the value of MPI reduces as the fraction of poor households diminishes. Each impoverished household’s average percentage of deprivation is shown by the average intensity of multidimensional deprivation, which is 61.2%. As A and H are both products of MPI, an index value of 0.465 is obtained. As a result, in the region, multidimensionally poor households suffer 46.5% of the total deprivations that would be felt if all homes were poor and suffering from all of the chosen poverty indicators. This result indicated that there is severe multidimensional poverty in the study area.
4.5. Censored headcount ratio and indicators’ contributions to MPI
The percentage of the population who are simultaneously multidimensionally poor and disadvantaged in that dimension is known as the censored headcount ratio (Alkire & Santos, Citation2010). In light of this, the censored deprivation headcount ratio would provide us with more accurate information regarding the type of deprivation. Therefore, each indicator’s censored headcount displays the percentage of deprived and impoverished families. Higher censored headcount ratio poverty metrics are more likely to be multidimensionally poor.
The MPI, which is sensitive to changes in both components, is the product of the headcount or incidence of multidimensional poverty (the percentage of multidimensionally poor people) and the intensity of multidimensional poverty (the average share of weighted deprivations, or average deprivation score, among multidimensionally poor people). The standard of living indicators was weighted 1/18 each, while the health and education indicators are each given a 1/6 weight within their respective dimensions (UNDP, Citation2022).
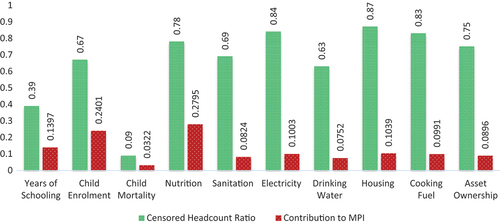
The fraction of households who are multidimensionally poor and deprived in each well-being metric is graphically represented in Figure . The study region’s overall censored headcount ratio is very high, implying that multidimensional poverty among households is severe. Findings from the study showed that 87%, the highest level of deprivation of the households in the survey, are multidimensionally poor and experiencing housing deprivation. This result demonstrated that their house’s walls, floors, and roofs were made of manure, sand, and mud. Electricity has the second-highest deprived headcount ratio, with 84% of the people being multidimensionally impoverished without access to it. Wellbeing of households are reduced when people lack access to electricity for lighting, manufacturing, communication, and cooking. The third stage of energy deprivation among the assessed households is demonstrated by the fact that 83% are multidimensionally impoverished and lack the energy for cooking.
Figure 7. Censored headcount ratios and contributions of indicators to MPI.
According to the focus group discussion, primary fuel sources for households are firewood, dung, and crop leftovers occasionally collected over large distances. This startling outcome demonstrates how difficult it is for disadvantaged households to meet their basic fuel needs. They relied on ineffective and harmful fuel sources. The result also revealed that 69% and 63% of the households have limited access to better sanitation and improved water services. The health of households and communities is impacted directly or indirectly by the poor’s inadequate access to sanitation services and improper disposal of human waste. In addition, unprotected wells, springs, and surface water, likely the leading causes of infections, hurt the poor. Focus group discussion revealed that many individuals are getting sick and dying from easily treatable diseases that cause diarrhea from drinking contaminated water. Additionally, this forced poor households to spend their meager cash on medicine. Lack of healthcare worsens things for households traveling a considerable distance for medical care.
And 78%, 75%, and 67% of the population are denied access to nourishment, asset ownership, and having any child not enrolled in school, respectively.
Similarly, Adepoju and Oyewole (Citation2020) depicted asset ownership as having a significant and negative effect on poverty. Moreover, the studies undertaken on sustainable livelihood approaches in India indicated that housing substantially impacted other asset bases, including social capital, often based on local residential and community networks (Farrington et al., Citation2002).
The lowest levels of deprivation were seen in years spent in school, and child mortality, with 9% of households having an infant dying within the previous 5 years, while 39% of the population has no one who has completed 5 years of education in household. These deprivations were higher than deprivations found by Fransman and Yu (Citation2019) in South Africa; according to their study, the percentage of the population living in poverty was less than 1% for the child mortality indicator, while it was just 2.5% and 5.4% for the school attendance and years of schooling indicators, respectively. Moreover, the results are much lower than the censored headcount ratio of these deprivation indicators shown in 2011 (Alkire & Santos, Citation2010) and 2016 for years of schooling, child school enrollment, child mortality, access to electricity, sanitation, water, and cooking fuel (Alkire & Santos, Citation2010). This is true even if each multidimensional poverty indicator has a high aggregate suppressed headcount ratio (Alkire & Kanagaratnam, Citation2018).
According to the censored headcount ratios, the poor in this society exhibit the highest levels of housing, access to power, and cooking fuel deprivation, followed by nutrition and asset ownership. However, the indicators that impact poverty most are not housing, power, or cooking energy. Why? Since their weights are significantly less than mortality and years of schooling. Thus, contributions give an impression of relative deprivation heavily impacted by weights. According to Figure 6.3, the most significant contributor to MPI was found to be nutrition deprivation, which comprised 27.95% of the total. This was followed by deprivation in child enrollment (24%) and years of schooling (13.97%). This is similar to the findings of Tina and Derek (Citation2019), who figured out that disability and low years of schooling also significantly contributed to the MPI in South Africa. In addition, housing issues accounted for 10.39% of overall multidimensional poverty, closely followed by electricity (10%), energy for cooking (9.91%), asset ownership (8.96%), and access to better sanitation (8.24%), in that order. Finally, it was discovered that child mortality (3.22%) and access to safe drinking water (7.52%) contributed the least to the overall value of multidimensional poverty. This is similar to the findings of Tina and Derek (2019), who figured out that child mortality contributed to multidimensional poverty in South Africa.
4.6. Agricultural market imperfections and multidimensional rural poverty
Table displays the Tobit regression model result, which indicated that 11 from 12 variables had statistically significant effects on multidimensional rural poverty (MPI). Null hypothesis is LR Chi-Square (666.24) test that at least one of the predictors‘ regression coefficients is not equal to zero. The Prob > chi2 refers to whether there is no effect on the predictor variables; this is the likelihood of receiving this chi-square result or one more extreme. This p-value is compared to an alpha level commonly set at 0.05. The researcher infers that at least one of the regression coefficients in the model is not equal to zero based on the low p-value, which equals 0.0001.
Table 6. Tobit regression estimates associating market imperfections with rural poverty
According to this study, there is a statistically significant and negative (β = −0.1431) association between multidimensional poverty and the sex of the family head at a 1% significance level. Therefore, the marginal effect showed that, when other factors were held constant, the anticipated value of MPI is, on average, 0.1439 units lower for male-headed families than for female-headed households. According to this argument, men have greater access to institutional, financial, and economic services than women. This outcome is consistent with that of Fransman and Yu (Citation2019), who discovered that women-headed households in South Africa had more deprivation. And Mduduzi and Talent (Citation2018) determined that in South Africa, households led by women experienced higher severity of poverty than households headed by men. In addition, Fransman and Yu (Citation2019) examined multidimensional poverty and noted that female-headed households in South Africa had greater poverty than male-headed households.
This study discovered a positive and statistically significant relationship between family size and multidimensional poverty at a 5% significance level in the studied region. The marginal effect demonstrates that when other variables remained constant, an average one number increase in family size was related to a 0.0079 point rise in the predicted MPI value. This demonstrates that the likelihood of being multidimensionally poor also rises as the size of the household’s family does. When families grow, it becomes more difficult for the home to provide for family members’ needs in terms of education, health care, and living standards. This outcome is consistent with Oljira and Mulatu’s (Citation2022) findings that discovered a strong and positive correlation between family size and multidimensional poverty in Nekemte of Ethiopia. On contrary, Adepoju and Oyewole’s (Citation2020) found that there was a negative association between household size and multidimensional poverty in Nigeria.
Since most of the farmers in the study area were smallholder producers, they did not have enough capital to hire labor. Consequently, they relied on family labor for most of the farming activities. However, some farmers hire a few daily workers to supplement family labor. Farmers with smaller family sizes are the ones who usually hire labor. As shown in Table , under the assumption that all other variables remain constant, the multidimensional poverty index (MPI) is predicted to be 0.0114 value index lesser for farmers that use hired labor in addition to family labor than for farmers that use only family labor.
In addition to labor, using improved seeds plays an important role in agricultural production. Most smallholder producers used the same seed they used previously. After harvesting, they store some of the seeds for use in the next planting season and use recycled seeds instead. Moreover, as the focus group discussion results indicated, farmers complain that the price of improved seed becomes beyond their capacity, and sometimes timely unavailability and shortage of required quantity challenged their production. On average, the multidimensional poverty index (MPI) is predicted to be a 0.1791 value index lesser for farmers that use improved seeds than their counterparts while other variables remain constant.
The productivity of crop farms was deteriorating, and agricultural production was decreasing due to climate change. Hence, most of farmers apply fertilizer for agricultural production in the lowland areas to accommodate climatic change and keep the land’s fertility. When all other factors are constant, on average, the expected value of multidimensional poverty is 0.2038, indexes lesser for farmers who have used fertilizer than farmers who have not used fertilizer appropriately As the focus group discussion indicated, although most of them applied fertilizers on their farm, they did not use the optimal quantity of fertilizer due to expensiveness and timely unavailability of it. Holding all other factors fixed, the anticipated value of rural poverty decreases by 0.024 MPI on average for every Timad increase in farm size. This finding’s outcome is consistent with those made by Takeshima (Citation2015).
Credit utilization has a negative and statistically significant effect on multidimensional poverty at the 5% significance level in the study area. This showed that, on average, the predicted value of MPI of households who utilized credit was lower by 0.0541 than that of their counterparts, holding all independent variables constant. More specifically, it was shown that having access to finance boosted households’ capacity to buy farm inputs that would otherwise be out of reach. Credit, therefore, offers a lot of potential to increase farm productivity in rural areas. However, many households could not get the service for various reasons, such as the absence of the service for the intended purposes and facing the high-interest rate imposed by money lenders.
In a rural location, asymmetric information had a positive association with the multidimensional poverty index (MPI) at a 1% significance level. Under the assumption that all other variables remain constant, the multidimensional poverty index (MPI) is predicted to be 0.4362 indexes higher for farmers with asymmetric information than for farmers with symmetric information. Thapa and Singh’s (Citation2021) findings suggest that there shouldn’t be any significant market imperfections in agriculture’s input, factor, and output markets. Defects in these marketplaces are also relevant since marginal and small farmers supplement their incomes through wage work and dairying. Rural households face high transaction costs like bureaucratic difficulties, especially in accessing production inputs. The multidimensional poverty index (MPI) is predicted to be 0.3269 indexes higher for farmers facing transaction costs than their counterparts while other variables remain constant. Weak market connections and the challenges posed by high transaction costs frequently force households to sell their small marketable surplus at the farm gate for less price. Transaction costs must be reduced through improved smallholder farmer marketing management and increased information exchange (da Silva et al., Citation2018). The findings of Silva, Souza, and Gomes indicated that incomplete information prevents most farmers from engaging in marketing. This limits their capacity to compete with well-built large-scale companies that reside in better neighborhoods with superior market infrastructure to connect existing and emerging market prospects.
Additionally, when other variables remained constant, on average one kilometer increase in distance to the main market was related to a 0.2799 point rise in the predicted MPI value. The focus group discussion’s findings indicate that some trade restrictions have been reduced, supporting farmers in marketing important cash crops. Additionally, MPI in the study area was negatively related to and significantly impacted by participation in commercialization at a 5% significance level. While other factors are held constant, farmers who produce crops for commercialization purposes, in addition to their consumption, had a 0.2119 index decrease in their expected MPI compared to those who did not.
5. Conclusion
Agricultural market policies boost agricultural production output and lessen simultaneous multifaceted rural poverty. This study makes a case for the importance of shifting information flow in scaling up current input utilization techniques to increase agricultural productivity and reduce multidimensional rural poverty. This study suggests that price support programs for agricultural products be introduced in the study area to improve farmers’ marketing efficiency. It is important to employ precision agricultural policies to motivate farmers to purchase the right agricultural inputs. Because of these measures, there is a sufficient agricultural food supply, which lowers prices and boosts consumption for rural poor people.
About 15% of respondents are compelled to use information from local farmers, although it is occasionally false and unreliable. Apart from what they have traditionally done by themselves, roughly 23% of people lack knowledge about where to sell, produce, and utilize a modernized method. And only 7% of farmers have complete access to information on how to produce, where to sell, and how much demand there is for their goods.
The survey results show that 43% of farmers put their items on their shoulders and travel to the market to sell them to marketing intermediaries. Farmers with asymmetric knowledge are projected to have a multidimensional poverty index (MPI) value of 0.4362, which is higher than that of farmers with symmetric information. In addition, farmers without access to infrastructure have an expected MPI value of 0.2799 indexes greater than those with access to infrastructure. Institutional changes and interference are necessary to increase market access and reduce multidimensional poverty. This can be accomplished by improving farmer to farmer communication and rearranging the marketing channels accessible to farmers.
6. Policy Implication
Agricultural market policies increase agricultural production and investment in agriculture, encourage information flow simultaneously in the sector, raise rural households’ production, and reduce multidimensional poverty. This study suggests the significance of information flow change in scaling up modern input utilization practices in improving agricultural productivity and alleviating rural multidimensional poverty.
Improvement of agricultural market information flow has a positive implication for returns to labor, improved seeds, and fertilizers because it increases the volume and type of agricultural production and reduces rural poverty. Hence, the government should formulate policies that improve agricultural marketing systems and the flow of information.
To raise farmers’ marketing effectiveness, this research recommends that agricultural products’ price support policies should be implemented in the study area. Precision agricultural policies should be used to encourage farmers to buy appropriate agricultural inputs. These policies provide a sufficient agricultural food supply, lowering costs and increasing consumption for the poor in rural.
Institutional innovations and interference are required to improve access to the market and alleviate multidimensional poverty. This can be done by reorganizing the marketing channels available to farmers and enhancing farmer-to-farmer contact.
Acknowledgments
The authors are grateful to the Ethiopian Ministry of Education and the Andhra University of India for providing support. We also thank the Sidama Development Association and Hawassa City Administration for their support.
Disclosure statement
The author declares that there are no conflicts of interest regarding the publication of this article.
Additional information
Funding
Notes on contributors

Bealu Tukela Bekata
Bealu Tukela Bekata was a research scholar (Ph.D. student) in the Economics department of Andhra University in India. And former Assistant Professor of Economics at the Hawassa University of Ethiopia. He researched and published articles on efficiency, productivity, savings, poverty, the livelihood of farmers, the roles of information for farmers, and the relationship between financial development and economic growth and e.t.c. This article is a part of my Ph.D. thesis work of the first author.
Ch. Appa Rao
Ch. Appa Rao and Prof. G. Nagaraja, are research guides. Moreover, Prof. Ch. Appa Rao is a Professor of the Economics at Andhra University, India.
G. Nagaraja
G. Nagaraja is a Professor of Economics at Andhra University. They are also involved in several projects focusing on different demographic, socioeconomic, and institutional issues in India.
References
- Abdul-Salam, Y., & Phimister, E. (2019). Modelling the impact of market imperfections on farm household investment in stand-alone solar PV systems. World Development, 116, 66–23. https://doi.org/10.1016/j.worlddev.2018.12.007
- Adepoju, A., & Oyewole, O. (2020). Determinants of multidimensional poverty transitions among rural households in Nigeria. RAAE, Review of Agricultural and Applied Economics, 23(1), 55–64. https://doi.org/10.15414/raae.2020.23.01.55-64
- Alkire, S. (2018). Global multidimensional poverty index. In Oxford Poverty and Human Development Initiative (2018). The Most Detailed Picture To Date of the World’s Poorest People, University of Oxford, UK. (Vol. 54, Issue 4). https://doi.org/10.30541/v54i4i-iipp.287-299
- Alkire, S., & Kanagaratnam, U. (2018). Multidimensional poverty index Winter 2017-18: OPHI Brief methodological note and results. University of Oxford.
- Alkire, & Santos. (2010). Dimensions of human development. World Development, 30(2), 181–205.
- Andrew, W., & Campbell, Y. (1996). Campbell, the econometrics of financial markets [badscan] (p. 630).
- Bardhan, P. (Ed.). (1989). The Economic theory of agrarian institutions. Clarendon Press.
- Barrett, C. B., & Mutambatsere, E. (2008). Agricultural markets in developing countries.
- Binswanger, H. P., & Deininger, K. (1997). Explaining agricultural and agrarian policies in developing countries. Journal of Economic Literature, 35, 1958–2005. https://ssrn.com/abstract=597189
- Brandt, L. (1987). Farm household behavior, factor markets, and the distributive consequences of commercialization in early twentieth-century China. The Journal of Economic History, 47(3), 711–737. https://doi.org/10.1017/S002205070004907X
- Central Statistics Agency (CSA). (2013). Population projection of Ethiopia for all regions at Woreda Level from 2014– 2017. Federal Demographic Republic of Ethiopia. Addis Abeba.
- Cheung, S. (1969). The theory of share tenancy. The University of Chicago Press.
- da Silva, E., Souza, G., & Gomes, E. G. (2018). The effect of marketing imperfection variables on production in the context of Brazilian agriculture. ICORES 2018 - Proceedings of the 7th International Conference on Operations Research and Enterprise Systems, 2018-Januaary(Icores), 15–20. https://doi.org/10.5220/0006509300150020
- De Janvry, A., Fafchamps, M., & Sadoulet, E. (1991). Peasant household behaviour with missing markets: Some paradoxes explained. The Economic Journal, 101(409), 1400–1417. https://doi.org/10.2307/2234892
- De Janvry, A., & Sadoulet, E. (2006). Progress in the modelling of rural households’ behaviour under market failures. In Poverty, inequality and development (pp. 155–181). Springer.
- Farrington, J., Ramasut, T., & Walker, J. (2002). Sustainable livelihoods approaches in urban areas: General Lessons, illustrations from Indian cases. ODI.
- Fransman, T., & Yu, D. (2019). Multidimensional poverty in South Africa in 2001–16. Development Southern Africa, 36(1), 50–79. https://doi.org/10.1080/0376835X.2018.1469971
- Gascón, J. (2015). Pro-poor tourism as a strategy to fight rural poverty: A critique. Journal OfAgrarian Change, 15(4), 499–518. https://doi.org/10.1111/joac.12087
- Geta, E., Bogale, A., Kassa, B., & Elias, E. (2013). Productivity and efficiency analysis of smallholder maize producers in Southern Ethiopia. Journal of Human Ecology, 41(1), 67–75. https://doi.org/10.1080/09709274.2013.11906554
- Harriss-White, B. (Ed.). (1999). Agricultural markets from theory to practice field experience in developing countries. Springer.
- Heltberg, R. (1998). Rural market imperfections and the farm size—productivity relationship: Evidence from Pakistan. World Development, 26(10), 1807–1826. https://doi.org/10.1016/S0305-750X(98)00084-9
- Holden, S., & Binswanger, H. P. (1998). Small-farmer decisionmaking, market imperfections, and natural resource management in developing countries. Agriculture and the Environment: Perspectives on Sustainable Rural Development, 50–71.
- Holden, S., Shiferaw, B., & Pender, J. (2001). Market imperfections and land productivity in the Ethiopian highlands. Journal of Agricultural Economics, 52(3), 53–70. https://doi.org/10.1111/j.1477-9552.2001.tb00938.x
- Madow, W. G. (1968). Elementary sampling theory. Technometrics, 10(3), 621–622. https://doi.org/10.1080/00401706.1968.10490610
- Mduduzi, B., & Talent, Z. (2018). An empirical analysis of the determinants of poverty and household welfare in South Africa. Journal of Developing Areas, 52(1), 115–130. https://doi.org/10.1353/jda.2018.0008
- Nishida, K. (2012). Agricultural productivity differences and credit market imperfections. 38962.
- Oljira, S. A., & Mulatu, G. (2022). Determinants of households ’ multidimensional poverty: The case of Nekemte city, Oromia, Ethiopia. European Journal of Business and Management, 14(21), 1–12. https://doi.org/10.7176/EJBM/14-21-01
- OPHI (Oxford Poverty and Human Development Initiative). (2018). Global Multidimensional Poverty Index 2018: The Most Detailed Picture to Date of The World’s Poorest People. University of Oxford.
- Sekhar, C. S. C. (2005). Economic growth, social Development and interest groups. Economic & Political Weekly, 40(50), 5338–5346.
- Sekhar, C. S. C. (2021). Agricultural Market Imperfections And Farm Profitability In India.
- Singh, I., Squire, L., & Strauss, J. (Eds.). (1986). Agricultural household models. The Johns Hopkins University Press.
- Stiglitz, J. (1974). Incentives and risk sharing in sharecropping. The Review of Economic Studies, 41(2), 219–255. https://doi.org/10.2307/2296714
- Takeshima, H. (2015). Identifying the effects of market imperfections for a scale biased agricultural technology: Tractors in Nigeria. Agriculture in an Interconnected World, 8–14.
- Tey, Y. S., & Brindal, M. (2015). Factors influencing farm profitability. In Sustainable agriculture reviews (pp. 235–255). Springer. https://doi.org/10.1007/978-3-319-09132-7_5
- Thapa, N., & Singh, V. (2021 June). Agricultural market imperfections (final report).
- Tina, & D. (2019). Multidimensional poverty in South Africa in 2001–16. Development Southern Africa, 36(1), 50–79. https://doi.org/10.1080/0376835X.2018.1469971
- Unal, F. G. (2012). Sharecropping or fixed-rent tenancy? In Land ownership inequality and rural factor markets in Turkey (pp. 63–94). Palgrave Macmillan.
- UNDP. (2022). Global multidimensional poverty index. Unpacking deprivation bundles to reduce multidimensional poverty. University of Oxford.
- Wardhana, D., Ihle, R., & Heijman, W. (2017). Agro-clusters and rural poverty: A spatial perspective for West Java. Bulletin of Indonesian Economic Studies, 53(2), 161–186. https://doi.org/10.1080/00074918.2017.1298722