
Abstract
The study was conducted to evaluate the performance of 10 sunflower genotypes in 12 environments during 2017 and 2018 cropping seasons with RCBD design. Twenty-nine parametric and non-parametric measures were compared for the stability of seed yield. Highly significant (p 0.001) interactions were found in the combined analyses of variance, with environmental factors contributing to 46.5% of the total variation. The Spearman correlation analysis determines the existence of a positive and significant (p < 0.001) association with AMMI values, but a non-significant association was observed between most of the non-parametric statistics and seed yield. The AMMI values show a positive and significant correlation and multiple overlaps in the biplot with CV, Var, W2, and Sij, indicating that comparable outcomes will be obtained if one of these parameters is used. Seven clusters were visible in the biplot, and R2 and Gai appeared in a similar group with seed yields, demonstrating their close relationship. G1, G4, and G6 are identified as the most favorable genotypes in terms of stability and seed yield. This study confirms that the tested parameters are informative in identifying desirable genotypes. However, it is essential to identify stability parameters that are more reliable and informative by eliminating duplication.
PUBLIC INTEREST STATEMENT
This study evaluates 29 parametric and non-parametric stability parameters to select stable and high-yielding sunflower genotypes for wider adaptation. Based on the two-year data, sunflower genotypes respond differently across environments, making selection and recommendations more challenging. Both numeric values and graphical methods were employed to choose a desirable genotype and to assess the effectiveness and relationship of stability parameters. The parameters used in this study were able to identify sunflower genotypes for wide adaptations. Most of the parameters are closely similar in sorting out the relative stability of the genotypes. Hence, minimizing redundant parameters and choosing more reliable techniques will save cost and maximize the effectiveness of the sunflower breeding program. Our study has significant implications for breeders, agronomists, and biometricians regarding the choice of superior genotypes and the significance of combining parametric and non-parametric techniques with correlation, PCA, and clustering to simplify the interpretation and identification of stable genotypes.
1. Introduction
Sunflower is one of the most important industrial crops in the world (Helianthus annuus L., 2n = 34). It is the third most extensively produced oilseed and contributes 9% to global vegetable oilseed production. Sunflower is used as a human food source, a source of raw materials for industry, and a feed for livestock, according to Yegorov et al. (Citation2019). It has been recognized as a major source of high-quality, low-cholesterol edible oil and a source of dietary fiber (Pal et al., Citation2015). Besides its primary use in human consumption, sunflower oil has a wide range of applications and can be used as a supplement in the chemical and pharmaceutical industries and as a feed stock for biofuel production (Lai et al., Citation2017).
The sunflower breeding program has been focused mainly on developing high-yielding varieties with excellent oil content and a good level of resistance to biotic and abiotic stresses (Misteru & Birhanu, Citation2021). Any genotype’s potential for adaptation is a function of its genetic makeup, the environment in which it is produced, and the way that environment and genotype interact (Zobel, Citation1990).
The most stable and high-yielding genotypes must be identified by conducting multienvironment trials over a number of years and locations, especially during the final phase of variety development. However, the prevalence of genotype–environment interactions makes it more challenging to analyze data from multilocation trials, evaluate genotypes, and make recommendations. It is possible to identify the genotypes that are most stable and high-yielding by carrying out effective multienvironment trials and assessing their responses using the right stability statistics. For almost all main crops, including sunflower, the significance of genotype–environment interaction has been shown in breeding programs (Jocković et al., Citation2019; Lu´quez et al., Citation2002; Ma’Ali et al., Citation2019; Salem et al., Citation2012; Pour-Aboughadareh et al., Citation2022).
In order to analyze and interpret genotype–environment interactions, both static (biological) and dynamic (agronomic) stability concepts are considered (Léon, Citation1985). To interpret these concepts, a number of statistical models and approaches have been proposed. Parametric and non-parametric stability methods are the most commonly applicable procedures to analyze and interpret genotype-by-environment data (Pour-Aboughadareh et al., Citation2022).
Parametric statistics evaluate genotype stability by relating observed genotypic responses to a sample of environmental conditions. The methods strictly rely on statistical assumptions of normal distribution, homogeneity of error variance, and their interaction effects. Parametric models are further subdivided into univariate and multivariate methods. The GE variance component (Plaisted, Citation1960), Wricke’s ecovalence (Wricke, Citation1962), regression coefficient (Finlay & Wilkinson, Citation1963), deviation from regression (Eberhart & Russell, Citation1966), Shukla’s stability variance (Shukla, Citation1972), coefficient of determination (Pinthus, Citation1973), coefficient of variance (Francis & Kannenberg, Citation1978), and many others constitute univariate methods.
The additive main effects and multiplicative interaction (AMMI)-based stability model include the sum of the absolute value of the IPC Scores (Sneller et al., Citation1997), the AMMI stability value (Purchase et al., Citation2000), the genotype stability index (Farshadfar, Citation2008), the modified AMMI stability value (Zali et al., Citation2012), the AMMI stability index (Jambhulkar et al., Citation2014), and the modified AMMI stability index (Ajay et al., Citation2018). For better identification of superior and stable genotypes from multienvironment data, Olivoto et al. (Citation2019) introduced a novel stability analysis model called WAASB by combining BLUP and AMMI models in a unique index.
The non-parametric stability parameters are estimated based on the mean value and rank of the trait of interest. Unlike parametric statistics, they do not require primary assumptions about the distribution of observed values, and the deletion or addition of new genotypes has little effect on the result (Huehn, Citation1990). They are an excellent alternative in stability analysis and are easy to use for breeders if they are only interested in the existence of an order of difference across environments. Some of the non-parametric methods include Huehn (Citation1979) and Nassar and Huehn (Citation1987) statistics: Si (1), Si (2), Si (3), Si (6), and Thennarasu (Citation1995) statistics: NP (1), NP (2), NP (3), and NP (4). It also suggests a non-parametric superiority measure for general adaptability.
To test the stability of a genotype in different environments, researchers usually measure its degree of interaction with different growing environments. High mean yield should not be the only criterion for the stability of a genotype, unless its high performance is established under different environmental conditions (Sial et al., Citation2000). Therefore, widely adapted genotypes with the ability to produce stable, high yields across diversified environments constitute a major goal for sunflower breeders. Seed yield is a determinant and trait of interest for breeders, agronomists, and farmers. Besides the genetic makeup, agro-climatic differences in specific regions affect yield performance. Understanding the environmental effects and their interaction with genotype performance is a crucial step in cultivar selection for the target environment (Marjanović-Jeromela et al., Citation2011).
Selecting the most suitable analysis model helps increase the efficiency of the breeding program. The choice of methodology depends on the available environment, number of genotypes, environmental variation, stability concept, and mathematical model fit to the data set. One criterion of selection is not sufficient because some of them may not provide an accurate picture of the genotype responses. Besides, some methodologies are alternative, while others are complementary and can be used jointly (Flores et al., Citation1998; Mohammadi & Amri, Citation2008). Therefore, major emphasis should be given to selecting statistical tools to determine the pattern of genotypic responses across diverse environments.
The current study aims to compare parametric (univariate and multivariate AMMI-based) and non-parametric stability parameters, assess their level of association, and identify superior sunflower genotypes with high mean yield and consistent performance across the tested environments.
2. Material and methods
2.1. Plant materials
The best-performing sunflower genotypes were obtained from a sunflower population improvement program executed using the head-to-row selection method for three consecutive years at Holetta. The original parents were introduced to Ethiopia from different sunflower-growing countries. From head-to-row selection, outperforming materials were advanced to the Sunflower Preliminary Variety Trial (PVT) and tested for 1 year at Holetta and Ambo. Promising materials were selected from the PVT experiment and promoted to a multilocation yield trial to identify superior and stable genotypes across multiple environments. The performance of elite sunflower genotypes was compared using the commercially released variety Oissa and the locally adapted cultivar Russian black. The two cultivars are used as standard and local checks, respectively. These two open-pollinated and poor yielding cultivars of sunflower are widely cultivated in most parts of Ethiopia (Misteru & Birhanu, Citation2021). A description of the tested genotype names and codes is presented in Table .
Table 1. Names and codes of 10 sunflower genotypes evaluated across 12 environments in 2017/18 and 2018/19
2.2. Descriptions of experimental sites
The experiment was conducted at six locations for two consecutive years in the 2017/18 and 2018/19 main cropping seasons under rain-fed conditions. These locations represent the varying agroecology of the sunflower-growing areas of Ethiopia. A description of the test locations in terms of geographical position, altitude, climatic conditions, and soil properties is given in Table .
Table 2. Description of the 12 environments used to evaluate sunflower genotypes
2.3. Experimental design and data collection
Eight outstanding sunflower genotypes promoted from preliminary variety trials were tested against the standard and local checks in RCBD with three replications. The gross plot size would be 18 m2 (six rows spaced at 75 cm (4.5 m width) and 4 m length). A seed rate of 10 kg ha−1 and a fertilizer rate of 23/23 kg ha−1 of nitrogen and P2O5 were applied during planting, and other cultural practices were carried out as per the recommendations. The seed yield per plot was obtained by harvesting the four middle rows of each plot with a 12 m2 harvestable area. Data on seed yield were adjusted to 7% moisture content. Seed yield kg ha−1 was determined by converting the seed yields per plot into seed yields per hectare for the statistical analysis.
2.4. statistical data analysis
Combined analyses of variance over years and locations were first performed to estimate the genotype–environment interaction. The F-protected least significant difference (LSD) was calculated at the 0.05 probability level according to Steel and Torrie (1980).
In the present study eight rank-based non-parametric yield stability analyses, including Si (1), Si (2), Si (3), and Si (6) (Huehn (Citation1979) and Nassar and Huehn (Citation1987)); NP (1), NP (2), NP (3), and NP (4) (Thennarasu, Citation1995) also nine univariate parametric measures including Wricke’s Ecovalence (W2) (Wricke, Citation1962), Genotype’s variance (Var) to measure the stability of genotype by environment interaction, Joint Regression model (regression coefficient (bi) and variance deviation (S2di)) (Eberhart & Russell, Citation1966), Shukla’s Stability Variance (σ2) (Shukla, Citation1972), Coefficient of determination (Ri2) (Pinthus, Citation1973), Coefficient of Variance (CV) (Francis & Kannenberg, Citation1978), Superiority Index (Pi) (Lin & Binns, Citation1988) and Geometric adaptability index (Gai) (Mohammadi & Amri, Citation2008) were analyzed.
Twelve AMMI based multivariate stability parameters, such as AMMI-Based Stability Parameter (ASTAB) proposed by Rao and Prabhakaran (Citation2005), Sums of the Averages of the Squared Eigenvector Values (EV) (Zobel, Citation1990), Sums of the Absolute Value of the IPC Scores (SIPC) (Sneller et al., Citation1997), Distance of IPCAs point from origin in space (Zhang’s Dz Parameter) (Zhang et al., Citation1998), AMMI Stability Value (ASV) (Purchase et al., Citation2000), Stability Measure Based on Fitted AMMI Model (FA) (Raju, Citation2002), Genotype Stability Index (GSI) (CitationFarshadfar, Citation2008), Modified AMMI Stability Value (MASV), and Absolute Value of the Relative Contribution of IPCs to the Interaction (Za) proposed by Zali et al. (Citation2012), AMMI Stability Index (ASI) (Jambhulkar et al., Citation2014) and Modified AMMI Stability Index (MASI) (Ajay et al., Citation2018) were analyzed.
In order to identify favorable genotypes, those with stability statistics that were regularly in the top third, genotypes preferred by more than half of the parameters, and genotypes with above-average mean yield were recognized as broadly adapted and stable genotypes.
The Spearman rank correlation coefficient and significance value were computed for each pair of possible pair-wise comparisons of the stability parameters and seed yield (Lehmann & D’Abrera, Citation1998). Even though there is no definitive cutoff point, we use the following cutoff points to interpret the strength of the correlation coefficient: from 0 to ±0.19 negligible correlation, ±0.2 to ±0.39 weak correlation, ±0.40 to ±0.59 moderate correlation, ±0.6 to ±0.79 strong correlation, and ±0.80 to 1.00 very strong correlation. A principal component biplot analysis based on the rank correlation matrix was performed for a better understanding of the relationship among all stability parameters. Data analysis was performed using R software version 4.3.1 Metan package (Olivoto et al., Citation2020).
3. Result and discussion
3.1. Combined analysis of variance
Table displays the findings of the combined analysis of variance for seed yield of the 10 genotypes of sunflowers that were investigated in the 12 environments. According to the results, the genotypes and the environments showed remarkable variations, and the genotype–environment interactions were found to be highly significant (p < 0.0001) for seed yield. The significance of the genotype by environmental interactions indicated that these data can be used for the estimation of stability statistics and correlations. Moreover, the presence of a strong genotype by environmental interactions increases the prospects of establishing regional breeding programs (Kang, Citation1998). Of the total variance, the environment’s main effect accounted for 46.5%, followed by interaction effects with 32.4% of the variance.
Table 3. Analysis of variance of 10 sunflower genotypes tested across 12 environments in 2017 and 2018 cropping season
The result showed that the predominant source of variation accounted by environment, which revealed that tested locations vary in terms of genotypes seed yield. This implies that sunflower genotypes respond differently across environments, as the test locations are highly variable in terms of edaphic and climatic factors (Table ). The result confirms that the significant variation of genotype and genotype by environmental interactions showed that yield performance was affected by interaction and the genetic performance of the genotype. Similar results were reported by Cherinet et al. (Citation2016), Ma’ali et al. (Citation2019), Jocković et al. (Citation2019), and Ansarifard et al. (Citation2020).
The mean seed yield of the test locations ranged from 1560 kg ha−1 (Adadi) to 2028 kg ha−1 (Holetta), with an average of 1805.78 kg ha−1. The genotype average mean performance ranges from 1636.9 kg ha−1 (G10) to 2032.6 kg ha−1 (G8) (Table ). Taking the mean yield as the first parameter for the assessment of sunflower genotypes, G8 gave the best yields, with mean yields of 2032.6 kg ha−1. According to the result, different rank orders were observed across test environments, indicating the effect of substantial differences in genotype responses across test environments. This is in agreement with a previous study conducted on sunflowers (Cherinet et al., Citation2016). The existence of cross-over genotype–environment interaction is the basic cause of the change in genotype ranking and performance over different locations (Hühn et al., Citation1993). For important traits like yield, it is unlikely to expect the same level of performance across environments, except for low-yielding genotypes, which do not mostly benefit from favorable environments.
Table 4. Combined analysis of seed yield (kg/ha) of 10 sunflower genotypes tested at Holetta, Adadi, Meki, Ambo, Ghinchi, and Kulumsa for the year 2017/18 and 2018/19
The masking effect of environmental interactions on genotype performance complicates the selection and recommendation of genotypes for wide adaptation by considering only the mean performance. Hence, besides the mean performance, measuring the magnitude of interaction across environments is very important. Therefore, estimating yield stability using various statistical approaches is a critical procedure in any breeding program to identify the variability across environments.
4. Stability analysis
4.1. Non-parametric stability analysis
The results of eight non-parametric stability statistics are given in Table . Based on this result, G2 had the lowest rank values for S1, N1, N2, and N3, which is regarded as the most stable genotype. According to the S1 and N4 statistics, G4 is revealed to be the most stable genotype. By using S3, S6, and N1 parameters, G6 is considered to be more stable than other genotypes. G8 is the high yielder but less stable for almost all tested parameters. The local check G9 is the lowest yielder and unstable genotypes by S1, S2, S3, S4, N1, and N4 (Huehn 11,979; Nassar & Huehn’s, Citation1987). Statistics were calculated by transforming the mean yield into ranks for each genotype and environment, and the genotypes are considered stable if their ranks are similar and have the lowest value across environments. Thennarasu’s (Citation1995) stability statistics are calculated from the ranks of adjusted grain yield means, and genotypes with the lowest values are identified as more stable. In order to reduce the effect of genotypes by environmental interaction and make precise selections considering both seed yield and stability, the performance of a genotype is very critical.
Table 5. Nonparametric stability statistics for seed yield on 10 sunflower genotypes grown in 12 environments
When we compare the overall mean performance and non-parametric stability measures, G6, followed by G2, and G4, exhibit better stability than other genotypes. Hence, they could be regarded as the most favorable genotypes in terms of adaptability. However, G2 has poor yield performance below the average mean; since stability alone is not the only criterion for selecting genotypes, it is difficult to recommend such genotypes for wide adaptation. The nonparametric measures determine the stability of a genotype over an environment if its rank is similar over other environments, which is associated with the biological concept of stability.
5. Univariate parametric stability analysis
The result of the univariate parametric stability analysis is presented in Table . According to the Wricke´s ecovalence (Wi2), G6 and G4 had the lowest values and were identified as the most stable genotypes. Ecovalence is the contribution of each genotype to the genotype by environment interaction sum of squares and low value showed smaller deviations from the mean across environments and was considered more stable (Wricke, Citation1962). Genotype variance (Var), which helps to measure the stability of genotypes by environmental interaction, identifies G5 and G3 as stable genotypes, though their seed yield rank is not good.
Table 6. Yield and univariate parametric stability statistics for grain yield on 10 sunflower genotypes grown in 12 environments
Based on Eberhart and Russell’s (Citation1966) regression coefficient (bi) and variance deviation from the regression (S2di) model, G7 was identified as a stable genotype because it revealed a low S2di minimum value associated with a bi value near 1. However, the yield performance of G7 is very poor, implying that the genotype indicates poor adaptation to all environments. The genotype G1 with the highest seed yield had the highest bi value, indicating that it was sensitive to environmental changes and suitable for favorable environments, which is recommended for specific adaptability to high-yielding environments. Similarly, the regression coefficient (bi) of G2 and G6 was greater than 1, but G1, G3, G5 (the second yield rank), and G9 had less than one value. Genotypes with low bi indicate that, because of their greater resistance to environmental change, they are responsive and adaptable to low-yielding environments. The result showed that no genotype showed general adaptability, based on Ebert and Russell’s statistics.
According to Shukla, a genotype is considered stable when its stability variance is lower. Thus, G6 and G4 resulted in a low Shukla’s stability variance, which is considered a more stable genotype. Based on Pinthus (Citation1973) stability statistics, the highest value of coefficient of determination (R2) was observed for G6 and G8, which were intended as more stable genotypes. In this method, the variation in mean seed yield was explained by genotype responses across environments.
The coefficient of variation (CV) considered G3 and G5 to be the most stable, with average yield performance. The superiority index (Pi) and geometric adaptability index (Gai) identify G1 and G8 as the high yielder and most stable genotypes. Hence, it is interesting that based on Pi and Gai these genotypes could be regarded as the most favorable genotype in terms of yield and stability. However, G7, G9, and G10 identified as unfavorable genotypes because they show poor stability and low yielder. Both Pi and Gai criteria rank the genotypes based on their yield and stability by evaluating performance and estimating genotype adaptation across a variety of conditions (Lin & Binns, Citation1988; Mohammadi & Amri, Citation2008). By considering the overall value of univariate stability parameters, G9, G10, and G8 are the most unstable genotypes. Similarly, the nonparametric stability parameters identify these genotypes as adapted genotypes.
6. AMMI Based multivariate stability analysis
On the basis of the AMMI stability value, G4, G6, and G1 were identified as the most stable and high yielder genotypes by ASTAB, ASI, ASV, DA, EV, FA, MASI, GSI, and ZA stability concepts. However, DZ, MASV, and SIPC recognize G1, G4, and G5 as stable genotypes. The GSI value also suggested G1, G4, G6, G5, and G8 as the most stable genotypes. GSI is defined as the rank sum of the ASV value plus the rank sum of the genotypic mean across the environment, and genotypes with low GSI values were considered the best across environments (Farshadfar, Citation2008). The GSI recognizes G9 and G10 as low-yielding and unstable genotypes. Unlike the GSI value, most of the parameters identified G8 as the most unstable genotype (Table ).
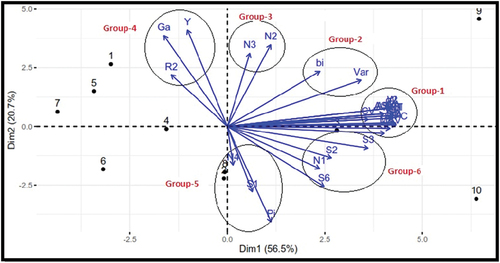
The biplot analysis (Figure ) of stability parameters classified GSI in a separate group from the rest of the AMMI-based stability indices. This might be because the other AMMI-based stability indicators are used to identify stable genotypes based on their mean yield and stability, whereas GSI measures the relative performance of genotypes across environments and incorporates a single selection criterion yield and AMMI value as proposed by Farshadfar (Citation2008). According to most AMMI values, G4, G1, and G6 are identified as suitable for wide adaptabilities and high yields, the result somehow coinciding with the nonparametric and univariate measures. However, the AMMI model identifies G8, G9, and G2 as unfavorable genotypes for wide recommendation. The present results demonstrate that most of the AMMI statistics are suitable for the identification of stable genotypes. Similar results were reported by Salem et al. (Citation2012) and Sabaghnia et al. (Citation2008).
Figure 1. Biplot analysis of parametric and non-parametric indicators of phenotypic stability in sunflower genotypes over 12 environments.
A stable genotype will be more desirable when it has a mean yield greater than the average yield of all genotypes. Yield stability metrics can be used to find those with high and consistent performance across a range of environments. For a better understanding of the interaction and to improve estimation accuracy, it is crucial to comprehend the relevance of and how to use AMMI values for genotype by environment data. The AMMI model allows for better identification of stable genotypes using missing data and offers simple findings and interpretations (Gauch et al., Citation2008).
6.1. Association among parametric and nonparametric stability statistics
The results of the Spearman’s rank correlation coefficient among the 29 parametric and non-parametric stability statistics and mean seed yield are presented in Tables . The mean seed yield performance across environments was significantly and positively correlated (P < 0.001) with univariate parametric measures (CV, Var, σ2, and Wi2); but a negative significant correlation was observed for the regression coefficient (bi) and deviation from regression (Sij). A similar negative correlation was reported for Sij and mean yield (Mohammadi & Amri, Citation2008). The superiority index (Pi), coefficient of determination (R2) and geometric adaptability index (Gai) show a non-significant relationship with seed yield. All AMMI stability measures except GSI revealed a positive and highly significant (p < 0.001) association with seed yield.
Table 7. AMMI-based stability statistics and ranking for grain yield of 10 sunflower genotypes grown in 12 environments
Table 8. Spearman rank correlation between stability measures for 10 sunflower genotypes across 12 environments
Table 9. Spearman rank correlation between stability measures for 10 sunflower genotypes across 12 environments (continued …)
A positive but statistically non-significant correlation between seed yield was observed for the S3 and S6 parameters. However, other non-parametric statistics exhibit a negative, non-significant correlation (p < 0.05) with seed yield, except N3. This study confirms that no significant association was observed between most of the non-parametric statistics and seed yield. Thus, since these methods represent static or biological stability concepts, they are not so useful for identifying the most stable and high-yield genotypes.
The negative correlation between seed yield and stability measures suggests that the selection of stable genotypes based on these statistics should be seriously considered, along with genotype mean yield. Stability statistics offer information that cannot be obtained from average yield alone whenever there is a non-significant association between mean seed yield and stability measures.
The association of parametric measures CV, Var, σ2, and W2 had observed highly significant positive correlation (p < 0.001) ranging from moderate to very high correlation with non- parametric measure; it means that these measures are positively correlated and that they both provide similar information about the stability of genotypes across environments. However, the regression coefficient (bi) showed highly significant but weak negative correlation. Most of the non-parametric correlation coefficients with univariate measures range from very low to moderate correlation value. Weak correlation coefficient indicates that there is little to no association between the variables.
The correlations between AMMI and other parametric statistics show a strong positive association with CV, Var, σ2, Wi2 and a significant positive moderate relationship with Sij. Significant and positive correlations between σ2, Wi2, and ASV were reported by Mulugeta et al. (Citation2014). Considering this study, it was shown that Sij and R2 had a positive, though low to somewhat moderate, association with AMMI values. This shows that while these parameters do tend to increase in response to one another, the correlation is not very significant. Gai and Pi showed a very strong relationship with the GSI value that was very significant (P < 0.001). However, for other AMMI stability statistics, there is a moderately non-significant (P < 0.05) association between these two univariate measures. The non-parametric indices S1 show a very low, non-significant positive correlation coefficient with all tasted AMMI-based stability statistics. However, S2, S2, S3, S6, and N1 showed a highly significant and moderately positive correlation value.
The Spearman rank correlation defines the monotonic relationship between two variables by using the rank values of the variables instead of their actual values (Lehmann & D’Abrera, Citation1998). The correlation value ranges from −1 to +1, which indicates the strength and direction of the relationships between the variables.
The strong positive correlation among stability measures indicates that they measure similar aspects of stability. Therefore, it is possible to use only one of them as a measure of genotype stability. The present study determines a significant positive and very strong correlation between AMMI stability statistics and univariate values CV, Var, σ2, and wi2; which suggests using one of these parameters interchangeably to provide similar results to evaluate the stability of sunflower genotypes. This finding also supports the use of either the GSI value from the AMMI model or Gai and Pi alone to pinpoint stable genotypes. Despite the fact that there is no ideal statistical tool that aids in drawing conclusions separately, the strong positive association of S1 with AMMI stability models justifies the use of one of them for future genotype by environment interaction stability studies. The strong and significant positive correlations between S6 and GSI, N1 and the Huehn’s and Nassar’s statistics (S2, S3, and S6), N4 and S1, and S6 and GSI suggest that one of them should be employed alternatively to estimate genotype stability in sunflowers.
7. Study area Geolocation informations
8. Principal Component Analysis (PCA)
Each of the stability methods produced a unique genotype ranking; therefore, to better understand the relationships among these methods, a principal component analysis (PCA) based on the rank correlation matrix was performed. The relationships among the different stability statistics are graphically displayed in a biplot of PCA1 and PCA2 (Figure ). The first five PCs with eigenvalues greater than one accounted 98.10% 0f the total variation among seed yields and stability measures (Table ). However, the first and the second principal components (PCs) of the rank correlations explained 56.50% and 20.70%, respectively, making a total of 77.2% of the total variation. Even though there is no clear boundary regarding the number of explained PCs, as a rule of thumb, more than 70% of the explained variations in a data set are considered sufficient in the biplot analysis to determine the number of PCs (Kohler & Luniak, Citation2005). Therefore, in the present study, the two principal components are adequate to express the relationship between the tested parametric and non-parametric stability measures. Ullah et al. (Citation2007), Mohammadi and Amri (Citation2008), Farshadfar et al. (Citation2012), Dehghani et al. (Citation2016) and Shahbazi (Citation2019) were reported similar findings in sunflower; wheat, chickpea, tall fescue, and nigella sativa, respectively.
Table 10. Values of principal component analysis of stability statistics and 10 sunflower genotypes grown in 12 environments
The principal component analysis distinguished six different groups. All AMMI-based stability parameters and four univariate parametric statistics (i.e., CV, Shukla’s stability variance, ecovalence, and deviation from regression) were clustered together in Group 1. A very tight positive relationship and several overlaps were observed between these parameters. There is a negligible angle between the vectors; this result suggests that any one of the parameters belonging to group 1 would be satisfactory for selecting desirable stable genotypes (Kohler & Luniak, Citation2005; Kroonenberg, Citation2007).
The coefficient of determination (R2) and geometric adaptability index (Gai) grouped in the fourth group together with seed yield show that these two indices have a strong association with seed yield and are simultaneously influenced by both mean yield and stability. Hence, they represent a dynamic concept of stability. Gai value is attempting to integrate both yield performance and adaptability. It was true that the highest-yielding genotypes, G1, G8, and G4 were marked as the most stable and high-yielding genotypes based on these parameters (Table ). In order to exploit the genotype by environmental interaction and to conduct robust genotype selection considering both yield and stability simultaneously is very critical (Kang, Citation1993). Therefore, based on R2 and Gai selection, seed yield is favored and is related to the dynamic concept of stability. These parameters can be used to recommend sunflower genotypes adapted to favorable environments.
The cosine of the angle in the biplot between the vectors of the two indices approximates the correlation coefficient between them. In the biplot vectors, measures expressed as acute angles would be positively correlated, whereas those achieved as obtuse or straight-line angles would be negatively correlated. Independent types of relationships are expressed by right angles between vectors. A small angle between vectors of parameters suggests similarity between them. When the various methods were compared using a PCA, the distribution of the methods on the first two PCs suggested that the stability parameters could be divided into distinct classes based on the two different concepts of stability.
To better reveal associations among genotypes based on different stability statistics, the two-way dataset of genotypes was analyzed further using a clustering procedure. Ward’s hierarchical clustering procedure using Euclidean distance indicates that 10 sunflower genotypes could be divided into three major distinct groups observed based on mean yield performance and stability properties (Figure ).
Figure 2. Dendrogram showing hierarchical classification of 10 sunflower genotypes and 12 testing environments based on ranks of mean yields, parametric and non-parametric statistics.
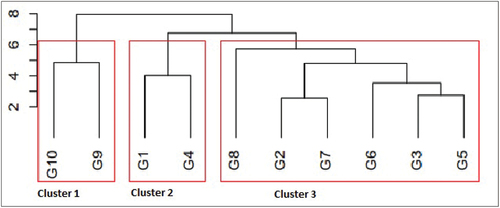
Cluster 1 includes genotypes G9 and G10, which were low yielders as well as having low stability characteristics in most of the parameters. The second cluster includes G1 and G4; they are characterized by higher mean-yielding genotypes and better stability values for most of the univariate and AMMI parameters. The third cluster includes six genotypes, which are characterized by a top yielder (G8), a low to moderate mean yield (G3, G5, G6, and G7), and a moderate to poor rank for most of the stability parameters. Therefore, due to mean seed yield and most of the stability statistics, genotypes G1, G4, and G6 could be considered the most favorable and acceptable genotypes over a wide range of environmental conditions. Hence, the identification or development of stable and high-yielding genotypes will reduce the necessity of establishing regional breeding programs, which helps to improve effective and efficient utilizations of limited resources (Kang, Citation1998). In order to recommend cultivars for the major production niches, breeders need some reliable measure of yield stability. However, simultaneously considering both stability and yield must be regarded as a critical strategy. Lu´quez et al. (Citation2002), Ali et al. (Citation2006), Salem et al. (Citation2012), Jocković et al. (Citation2019) and Dudhe et al. (Citation2023) reported the usefulness of stability statistics for simultaneously selecting high-yield and adaptable sunflower genotypes.
Genotype–environment interaction (GEI) analysis is essential for exploiting the efficiency of the genotype when picking superior genotypes for the next stage. Economically important traits can be affected by interaction, and genotype performance changes with environmental variations, which makes the selection and recommendation of new cultivars very difficult (Da Silva et al., Citation2016). The non-parametric, univariate statistics and multivariate stability values enable interpretations of genotype, environment, and GEI effects to identify the most stable and high-yielding genotype across the production environments. Handling genotype by environment interaction and selecting the proper parameters to assess the stability of genotypes across environments is very important in any breeding program, including sunflowers.
The stability analysis used in this study allowed the identification of promising genotypes with wide and specific adaptations. Most stability parameters were closely similar in sorting out the relative stability of the genotypes. The Spearman correlation matrix shows that some parameters are highly and significantly intercorrelated (P < 0.01), indicating that one can be used as a good alternative for the other in any genotype by environment interaction analysis (Pour-Aboughadareh et al., Citation2022; Roostaei et al., Citation2014).
This experiment also tries to demonstrate the advantages of adding PCA and cluster methods in comparing the effectiveness and avoiding redundancy of stability parameters in evaluating genotype performance and stability. Simultaneous assessment of parametric and non-parametric measures with correlation and PCA facilitates the interpretation of stability parameters for the identification of superior genotypes both in yield and stability.
Thus, it is concluded that for reliable decisions and effective selection of desirable genotypes, it is better to evaluate multienvironment experiments through different aspects of stability parameters and graphical display. In sunflower breeding, identification of superior genotypes with high yielding and stable performance across environments is imperative. Hence, to maximize the returns from multienvironment trials conducted in Ethiopia, selecting and utilizing more robust and informative stability parameters by avoiding redundant methods is very crucial.
Author contribution statement
All the authors listed have significantly contributed to executing the experiment, data analysis, and writing this article.
Acknowledgments
The authors acknowledge the financial support of the Ethiopian Institute of Agricultural Research (EIAR). They are also grateful to the High and Midland Oilseeds Improvement Program staff members for their contribution in trial management and data collection.
Disclosure statement
No potential conflict of interest was reported by the author(s).
Additional information
Funding
Notes on contributors

Birhanu Mengistu
Birhanu Mengistu Aboye is a researcher at the Ethiopian Institute of Agricultural Research based at Holetta Research Center. I received my BSc. degree in Plant Science from Wollo University and MSc degree in Plant Biotechnology from Jimma University. My research interest is in crop productivity, agricultural extension, and commercialization to improve food and nutrition Security. I conducted research in the area of edible oil crops improvement activities and contributed to the release and registration of 16 oilseeds varieties and technologies. I coordinate the National High and Midland Oilseeds Research Program from May 1, 2019, to August 30, 2022. I also participated in many national research conferences and published 14 journal articles and proceeding papers.
References
- Ajay, B. C., Aravind, J., Abdul Fiyaz, R., Bera, S. K., Narendra, K., Gangadhar, K., & Kona, P. (2018). Modified AMMI stability index (MASI) for stability analysis. Ground Newsletters, 18, 4–21.
- Ali, S. S., Manzoor, Z., Awan, T. H., & Mehdi, S. S. (2006). Evaluation of performance and stability of sunflower genotypes against salinity stress. Journal of Animal and Plant Sciences, 16, 47–51.
- Ansarifard, I., Mostafavi, K., Khosroshahli, M., Reza Bihamta, M., & Ramshini, H. (2020). A study on genotype–environment interaction based on GGE biplot graphical method in sunflower genotypes (Helianthus annuus L.). Food Science & Nutrition, 8(7), 3327–3334. https://doi.org/10.1002/fsn3.1610
- Cherinet, A., Abebe, W., Molla, M., Tazebachew, A., Desalew, F., Esmelealem, M., & Jemal, E. (2016). GGE stability analysis of seed yield in sunflower genotypes (Helianthus annuus L.) in Western Amhara region, Ethiopia. International Journal of Plant Breeding and Genetics, 10(2), 104–109. https://doi.org/10.3923/ijpbg.2016.104.109
- Da Silva, D. O. M., Santos, C. A. F., & Boiteux, L. S. (2016). Adaptability and stability parameters of total seed yield and protein content in cowpea (‘Vigna unguiculata’) genotypes subjected to semi-arid conditions. Australian Journal of Crop Science, 10(8), 1164–1169. https://doi.org/10.21475/ajcs.2016.10.08.p7828
- Dehghani, M. R., Majidi, M. M., Mirlohi, A., & Saeidi, G. (2016). Integrating parametric and non-parametric measures to investigate genotype× environment interactions in tall fescue. Euphytica, 208(3), 583–596. https://doi.org/10.1007/s10681-015-1611-0
- Dudhe, M. Y., Jadhav, M. V., Sujatha, M., Meena, H. P., Rajguru, A. B., Gahukar, S. J., & Ghodke, M. K. (2023). WAASB-based stability analysis and validation of sources resistant to plasmopara halstedii race-100 from the sunflower working germplasm for the semiarid regions of India. Genetic Resources and Crop Evolution. https://doi.org/10.1007/s10722-023-01698-2
- Eberhart, S. T., & Russell, W. A. (1966). Stability parameters for comparing varieties 1. Crop Science, 6(1), 36–40. https://doi.org/10.2135/cropsci1966.0011183X000600010011x
- Farshadfar, E. (2008). Incorporation of AMMI stability value and grain yield in a single non-parametric index (GSI) in bread wheat. Pakistan Journal of Biological Sciences, 11(14), 1791. https://doi.org/10.3923/pjbs.2008.1791.1796
- Farshadfar, E., Sabaghpour, S. H., & Zali, H. (2012). Comparison of parametric and non-parametric stability statistics for selecting stable chickpea (‘Cicer arietinum’L.) genotypes under diverse environments. Australian Journal of Crop Science, 6(3), 514–524. http://www.cropj.com/farshadfar_6_3_2012_514_524.pdf(cropj.com)
- Finlay, K. W., & Wilkinson, G. N. (1963). The analysis of adaptation in a plant-breeding programme. Australian Journal of Agricultural Research, 14(6), 742–754. https://doi.org/10.1071/AR9630742
- Flores, F., Moreno, M. T., & Cubero, J. I. (1998). A comparison of univariate and multivariate methods to analyze G× E interaction. Field Crops Research, 56(3), 271–286. https://doi.org/10.1016/S0378-4290(97)00095-6
- Francis, T. R., & Kannenberg, L. W. (1978). Yield stability studies in short-season maize. I. A descriptive method for grouping genotypes. Canadian Journal of Plant Science, 58(4), 1029–1034. https://doi.org/10.4141/cjps78-157
- Gauch, H. G., Jr., Piepho, H. P., & Annicchiarico, P. (2008). Statistical analysis of yield trials by AMMI and GGE: Further considerations. Crop Science, 48(3), 866–889. https://doi.org/10.2135/cropsci2007.09.0513
- Huehn, M. (1979). Beitrage zur erfassung der phanotypischen stabilitat. EDV Med. Biol, 10, 112–117.
- Huehn, M. (1990). Nonparametric measures of phenotypic stability. Part 1: Theory. Euphytica, 47(3), 189–194. https://doi.org/10.1007/BF00024241
- Hühn, M., Lotito, S., & Piepho, H. P. (1993). Relationships between genotype x environment interactions and rank orders for a set of genotypes tested in different environments. Theoretical and Applied Genetics, 86(8), 943–950. https://doi.org/10.1007/BF00211045
- Jambhulkar, N. N., Bose, L. K., & Singh, O. N. (2014). AMMI stability index for stability analysis. Central Rice Research Institute, Cuttack, Orissa, 35, 15–15.
- Jocković, M., Cvejić, S., Jocić, S., Marjanović-Jeromela, A., Miladinović, D., Jocković, B., Miklič, V., & Radić, V. (2019). Evaluation of sunflower hybrids in multi-environment trial (MET). Turkish Journal of Field Crops, 24(2), 202–210. https://doi.org/10.17557/tjfc.645276
- Kang, M. S. (1993). Simultaneous selection for yield and stability in crop performance trials: Consequences for growers. Agronomy Journal, 85(3), 754–757. https://doi.org/10.2134/agronj1993.00021962008500030042x
- Kang, M. S. (1998). Using genotype-by-environment interaction for crop cultivar development. Advances in Agronomy, 62, 199–252. https://doi.org/10.1016/S0065-2113(08)60569-6
- Kohler, U., & Luniak, M. (2005). Data inspection using biplots. The Stata Journal, 5(2), 208–223. https://doi.org/10.1177/1536867X0500500206
- Kroonenberg, P. M. (2007). Biplots and their interpretation applied multiway data analysis. Wiley. https://doi.org/10.1002/9780470238004.app2
- Lai, W. T., Khong, N. M., Lim, S. S., Hee, Y. Y., Sim, B. I., Lau, K. Y., & Lai, O. M. (2017). A review: Modified agricultural by-products for the development and fortification of food products and nutraceuticals. Trends in Food Science & Technology, 59, 148–160. https://doi.org/10.1016/j.tifs.2016.11.014
- Lehmann, E. L., & D’Abrera, H. J. M. (1998). Nonparametrics: Statistical methods based on ranks (rev ed.). prentice-hall. 292, p.23.
- Léon, J., 1985. Beiträge zur Erfassung der phänotypischen Stabilität unter besonderer Berücksichtigung unterschiedlicher Heterogenitäts-und Heterozygotiegrade sowie einer zusammenfassenden Beurteilung von Ertragshöhe und Ertragssicherheit.
- Lin, C. S., & Binns, M. R. (1988). A superiority measure of cultivar performance for cultivar× location data. Canadian Journal of Plant Science, 68(1), 193–198. https://doi.org/10.4141/cjps88-018
- Lu´quez, J. E., Aguirrezabal, L. A. N., Agüero, M. E., & Pereyra, V. R. (2002). Stability and adaptability of cultivars in non‐balanced yield trials. comparison of methods for selecting ‘high oleic’sunflower hybrids for grain yield and quality. Journal of Agronomy and Crop Science, 188(4), 225–234. https://doi.org/10.1046/j.1439-037X.2002.00562.x
- Ma’ali, S., Makgoga, W., Erasmus, J., & Swanepoel, S. (2019). Genotype-by-environment interaction and yield stability of sunflower hybrids across production environments in South Africa. South African Journal of Plant and Soil, 36(4), 271–278. https://doi.org/10.1080/02571862.2018.1558461
- Marjanović-Jeromela, A., Nagl, N., Gvozdanović-Varga, J., Hristov, N., Kondić-Špika, A., & Marinković, M. V. R. (2011). Genotype by environment interaction for seed yield per plant in rapeseed using AMMI model. Pesquisa Agropecuária Brasileira, 46(2), 174–181. https://doi.org/10.1590/S0100-204X2011000200009
- Misteru, T., & Birhanu, M. (2021). Sunflower research: Current status and future prospects in Ethiopia. International Journal of Agriculture Innovations and Research, 9(5), 335–345. .
- Mohammadi, R., & Amri, A. (2008). Comparison of parametric and non-parametric methods for selecting stable and adapted durum wheat genotypes in variable environments. Euphytica, 159(3), 419–432. https://doi.org/10.1007/s10681-007-9600-6
- Mulugeta, G., Dessalegn, Y., & Genet, T. (2014). Genotype-environment interaction and correlation of some stability parameters of total starch yield in potato in Amhara region, Ethiopia. Journal of Plant Breeding and Crop Science, 6(2), 31–40. https://doi.org/10.5897/JPBCS2013.0426
- Nassar, R., & Huehn, M. (1987). Studies on estimation of phenotypic stability: Tests of significance for nonparametric measures of phenotypic stability. Biometrics, 43(1), 45–53. https://doi.org/10.2307/2531947
- Olivoto, T., Lúcio, A. D., da Silva, J. A., Marchioro, V. S., de Souza, V. Q., & Jost, E. (2019). Mean performance and stability in multi‐environment trials I: Combining features of AMMI and BLUP techniques. Agronomy Journal, 111(6), 2949–2960. https://doi.org/10.2134/agronj2019.03.0220
- Olivoto, T., Lúcio, A. D. C., & Jarman, S. (2020). Metan: An R package for multi‐environment trial analysis. Methods in Ecology and Evolution, 11(6), 783–789. https://doi.org/10.1111/2041-210X.13384
- Pal, U. S., Patra, R. K., Sahoo, N. R., Bakhara, C. K., & Panda, M. K. (2015). Effect of refining on quality and composition of sunflower oil. Journal of Food Science and Technology, 52(7), 4613–4618. https://doi.org/10.1007/s13197-014-1461-0
- Pinthus, M. J. (1973). Estimate of genotypic value: A proposed method. Euphytica, 22(1), 121–123. https://doi.org/10.1007/BF00021563
- Plaisted, R. L. (1960). A shorter method for evaluating the ability of selections to yield consistently over locations. American Potato Journal, 37(5), 166–172. https://doi.org/10.1007/BF02855271
- Pour-Aboughadareh, A., Barati, A., Koohkan, S. A., Jabari, M., Marzoghian, A., Gholipoor, A., Shahbazi-Homonloo, K., Zali, H., Poodineh, O., & Kheirgo, M. (2022). Dissection of genotype-by-environment interaction and yield stability analysis in barley using AMMI model and stability statistics. Bulletin of the National Research Centre, 46(1), 19. https://doi.org/10.1186/s42269-022-00703-5
- Pour-Aboughadareh, A., Khalili, M., Poczai, P., & Olivoto, T. (2022). Stability indices to deciphering the Genotype-by-Environment Interaction (GEI) effect: An applicable review for use in plant breeding programs. Plants, 11(3), 414. https://doi.org/10.3390/plants11030414
- Purchase, J. L., Hatting, H., & Van Deventer, C. S. (2000). Genotype× environment interaction of winter wheat (Triticum aestivum L.) in South Africa: II. Stability analysis of yield performance. South African Journal of Plant and Soil, 17(3), 101–107. https://doi.org/10.1080/02571862.2000.10634878
- Raju, B. M. K. (2002). A study on AMMI model and its biplots. Journal of the Indian Society of Agricultural Statistics, 55(3), 297–322.
- Rao, A. R., & Prabhakaran, V. T. (2005). Use ofAMMI in Simultaneous selection of genotypes for yield and stability.
- Roostaei, M., Mohammadi, R., & Amri, A. (2014). Rank correlation among different statistical models in ranking of winter wheat genotypes. The Crop Journal, 2(2–3), 154–163. https://doi.org/10.1016/j.cj.2014.02.002
- Sabaghnia, N., Dehghani, H., & Sabaghpour, S. H. (2008). Graphic analysis of genotype by environment interaction for lentil yield in Iran. Agronomy Journal, 100(3), 760–764. https://doi.org/10.2134/agronj2006.0282
- Salem, A. H., Awaad, H. A., Ali, M. M. A., Omar, A. E. A., & Kamal, K. Y. (2012). Some stability parameters in sunflower (Helianthus annuus L.) genotypes at various environments. Egyptian Journal of Agronomy, 34(2), 141–153. https://doi.org/10.21608/AGRO.2012.97
- Shahbazi, E. (2019). Genotype selection and stability analysis for seed yield of Nigella sativa using parametric and non-parametric statistics. Scientia Horticulturae, 253, 172–179. https://doi.org/10.1016/j.scienta.2019.04.047
- Shukla, G. K. (1972). Some statistical aspects of partitioning genotype-environmental components of variability. Heredity, 29(2), 237–245. https://doi.org/10.1038/hdy.1972.87
- Sial, M. A., Arain, M. A., & Ahmad, M. (2000). Genotype× environment interaction on bread wheat grown over multiple sites and years in Pakistan. Pakistan Journal of Botany, 32(1), 85–91.
- Sneller, C. H., Kilgore‐Norquest, L., & Dombek, D. (1997). Repeatability of yield stability statistics in soybean. Crop Science, 37(2), 383–390. https://doi.org/10.2135/cropsci1997.0011183X003700020013x
- Thennarasu, K., 1995. On Certain Non-parametric procedures for studying genotype-environment interactions and yield stability ( Doctoral dissertation, IARI, Division of Agricultural Statistics).
- Ullah, I., Ayub, M., Khan, M. R., Ashraf, M., Mirza, M. Y., & Yousaf, M. (2007). Graphical analysis of multi-environment trial (MET) data in sunflower (Helianthus annuus L.) through clustering and GGE biplot technique. Pakistan Journal of Botany, 39(5), 1639–1646. Microsoft Word - 26-06-162.doc (pakbs.org).
- Wricke, G. (1962). Uber eine methode zur erfassung der okologischen streubreite in feldversucen. Z Pflanzenzuchtung, 47, 92–96.
- Yegorov, B., Turpurova, Т., Sharabaeva, E., & Bondar, Y. (2019). Prospects of using by-products of sunflower oil production in compound feed industry. https://doi.org/10.15673/fst.v13i1.1337
- Zali, H., Farshadfar, E., Sabaghpour, S. H., & Karimizadeh, R. (2012). Evaluation of genotype× environment interaction in chickpea using measures of stability from AMMI model. Annals of Biological Research, 3(7), 3126–3136.
- Zhang, Z., Lu, C., & Xiang, Z. H. (1998). Stability analysis for varieties by AMMI model. Acta Agronomica Sinica, 24, 304–309. https://zwxb.chinacrops.org/EN/Y1998/V24/I03/304
- Zobel, R. W. (1990). A powerful statistical model for understanding genotype-by-environment interaction. In M. S., Kang (Ed.), Genotype-By-Enviornment Interaction and Plant Breeding (126–140). Louisana Sate University, Baton Rouge.