
 ?Mathematical formulae have been encoded as MathML and are displayed in this HTML version using MathJax in order to improve their display. Uncheck the box to turn MathJax off. This feature requires Javascript. Click on a formula to zoom.
Abstract
Crop diversification is the cultivation of more than one variety of crops belonging to the same or different species in a given area to develop a resilient agricultural system. In Ethiopia, crop diversification is recognized as a strategy to improve nutrition and climate risk coping mechanisms. Despite the national aspiration to use crop diversification as a mechanism to ensure nutritional security and increase agricultural production, this effort has not been investigated in the central and southern Oroima where cereal production is dominating. The area is commonly known as the wheat belt of Ethiopia. Accordingly, this study was initiated to estimate the crop diversification level and identify the core drivers. The research was conducted in the central and northern Oromia region, Ethiopia. Four districts were selected from which a total of 390 household respondents were selected randomly. Simpson Diversification Index (SDI) was employed to estimate the crop diversification level, while ordered logit was employed to identify its determinants. Accordingly, about 25, 44, and 31% of the households were low, medium, and high diversifiers, respectively. Mitigating market and price risk (73%) and risk of crop failure (62%), food self-sufficiency (63%), and diversifying labor pressure during peak agricultural seasons (17%) were significant reasons for diversification. Family size, landholding, level of farm mechanization, land fragmentation, and spatial location strongly determine crop diversification levels. Improving access to farm mechanization, including irrigation technologies, and availing of alternative crop varieties by agricultural research institutes shall be given emphasis to improve crop diversification level.
1. Introduction
Crop diversification is cultivation of more than one variety of crops belonging to the same or different species in a given area to develop a resilient agricultural system, especially in agriculture dependent community and economy (Makate et al., Citation2016b; Njeru, Citation2013). It is considered as the re-allocation of some productive farm resources, such as land, capital, labor, and farm equipment, into new farm activities. It is usually viewed as a shift from traditionally grown, less profitable crops to newer, more profitable crops (Pal and Kar, Citation2012). Pingali and Rosegrant (Citation1995) also defined crop diversification as “change in product (or enterprise) choice and input use decisions based on market forces and the principles of profit maximization”. Concepts and importance of crop diversification are arguable where some emphasized that it is a practice at the first stage of agricultural transformation to be avoided at modern farm mainly practiced in the subsistence and non-market-oriented farming (Timmer, Citation1997). Contrary to this, others argued that crop diversification has to be practiced at the regional or national level for different purposes. To this end, an immense number of scholars argue that crop diversification can be seen as a means to mitigate shortcomings of mono-cropping while others considered that diversification as a dynamism of crop portfolio toward the high value crops like fruits and vegetables. At an individual level, it is practiced with a main objective of food and income security, increasing farm income, risk management, and food self-sufficiency (Abro, Citation2012). It is also a strategy that is used to maximize the use of land, water, and other resources for the overall agricultural development in a country. The crop diversification practice also enhances biodiversity conservation which includes support and regulation of ecosystem services like water quality, pest and disease control, and soil quality (Beillouin et al., Citation2021; Hufnagel et al., Citation2020) and as a means to overcome poverty (Feliciano, Citation2019). In a nutshell, crop diversification is considered as a major economic decision that has a strong bearing on the farmer’s income level, higher production, food security, and ensures sustainability of the national crop production system (Davis et al., Citation2012; Pope & Prescott, Citation1980; Renard & Tilman, Citation2019).
There are different drivers of crop diversification at a household level, wherein household mainly diversifies their crop production to improve livelihoods. Crop diversification can increase household level profit and reduces income variability. In a diversified crop production system, productivity increases due to facilitated pollination, reduced pests, and the outbreaks of weed (Karp et al., Citation2013; Li et al., Citation2009, Citation2021, Citation2007). Hence, the increase in household income could be due to the ecosystem services that can result from diversification. Farmers also deal with diversified crops to reduce adverse effect of climatic shocks like shortage of rainfall, early cease and late start of rain, flood, drought and etc (Cutforth et al., Citation2001; Garibaldi et al., Citation2013; Lin, Citation2011). Crop diversification can also be a coping strategy for price and market risk, since, farmers are producing different crops to search for better price and market in this uncertain world (Schneider, Citation2011). Other benefits for which farmers are practicing crop diversification may be to reduce labor pressure that they may face during peak agricultural production seasons. This could be explained by the fact that some crops have longer growing periods than the other one and it diversifies labor requirement of farmers (Kasem & Thapa, Citation2011).
Therefore, what crop to produce and cropland allocation (level of crop diversification) are simultaneous decisions to be made by farm households within incomplete market situation (Hua et al., Citation2005). These decisions can be influenced by both farm household characteristics and government policies such as the subsidy program (DiFalco & Perrings, Citation2005; Westcott & Young, Citation2004; Wu & Brorsen, Citation1995). Similarly, crop choice and cropland allocation decisions determine agricultural production levels, moreover it affects land resource conditions, crop diversification, farm income and household welfare. As a result, these decisions are becoming current issues of concern for both smallholder farmers and policy makers (Hua et al., Citation2005; Wu et al., Citation2014). Farm households made crop choice and cropland allocation decisions within their own production risk and uncertainty management strategies, income diversification strategies, and market access constraints (Chavas & Holt, Citation1990; Kurdy´s-Kujawska et al., Citation2021; Waha et al., Citation2018; Zeller et al., Citation1998; Zerssa et al., Citation2021).
There are different types of practices that are considered and adopted as crop diversification. The most common crop diversification measures that are used in different countries were crop rotation, intercropping, companion crops, mixed cropping, catch crops, bee plants, and double crops (Hufnagel et al., Citation2020). Renard and Tilman (Citation2019) considered diverse crops growing at a season, while crop rotations were considered by Reckling et al. (Citation2016). Intercropping and mixed cropping (Bedoussac et al., Citation2015; Malézieux et al., Citation2009; Raseduzzaman & Jensen, Citation2017), cultivation of grain legumes in otherwise cereal dominated systems (Watson et al., Citation2017), multi-species (species richness) of farming system in well-managed grassland-based farming (Haughey et al., Citation2018; Phelan et al., Citation2015; Weißhuhn et al., Citation2017) were also another crop diversification types. There are also other practices that have the potential to make cropping system more diverse in space, time and genetics. For instance, temporal diversification or diversified rotation (Liu et al., Citation2019; Meynard et al., Citation2018; Rosa-Schleich et al., Citation2019) and national level diversification of crops are some of the practices (Renard & Tilman, Citation2019).
Agricultural production in Ethiopia is nature-dependent and smallholder farmers are operating under the risk and uncertainty of price, weather conditions like rainfall, drought, flood, pests, and diseases, which are the result of biophysical, socioeconomic and external wider national economic factors i.e., all factors that affect the national macroeconomic (Dercon, Citation2002). Crop diversification increases agricultural production, enhances nutrition security, and aids sustainable agricultural transformation (Makate et al., Citation2016a). It was also recognized as a strategy to improve nutrition and climate risk coping mechanism by the government of Ethiopia (Wondimagegn, Citation2021). Hence, crop diversification practice is important to develop a resilient agricultural production system in Ethiopia. However, in spite of the national aspiration of nutritional security and agricultural production increment through crop diversification, the study area is specialized in cereal crops and commonly known as the wheat belt of the country (Berhane et al., Citation2017). There is a dearth of studies on level of crop diversification and its demographic and socioeconomic characteristics that determinants that can be used as an input for development practitioners and policy makers. Hence, there is a need to articulate the challenges for crop diversification and estimate the level of diversification in the study area. Thus, the focus of this study is to analyze level and drivers of crop diversification at household level with specific objectives of estimating crop diversification levels and identifying driving factors of crop diversification in the study area.
2. Methodology of the research
2.1. Study area description
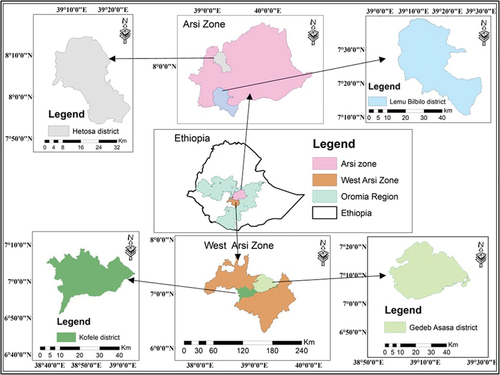
This research was conducted in central and southern Oromia regional state of Ethiopia (Figure ). The area is known for crop-livestock mixed farming system with major in cereal production mainly wheat and barley crops. The research focus area was on Arsi from central and West Arsi from southern part of Oromia region. The two zones are among the main wheat and barley producers within the regional state as well as the nation at large. For instance, according to the CSA (Citation2021a) data cereal crops account for 83.26% of the total crop areas out of which wheat and barley only account for 47.97% of the cereal land area in Arsi zone. This data may indicate that there is crop production specialization in the area towards cereals. Similarly, in West Arsi zone cereal crops covered 76.13% of the cropland allocated for major crops, wherein barley and wheat together take the lion’s share of the land (67%) for cereal production. Teff and maize are the other two important crops produced in the study area, especially in the lowland areas, wherein the two crops covered 32.24% of total cereal crops together.
Figure 1. Geographical location of the study area (Arsi and West Arsi zones).
Similarly, livestock production is the most important agricultural practice in the study areas. CSA (2021b) reported that there are around 4.7 million cattle, 4.6 million sheep and goats, 3.62 million of pack animals (horses, mules, and donkeys), 2.54 poultry, and 126,956 beehives in the study area. These values revealed that the two zones alone account for 18.58, 19.92, 24.62, 13.28, and 3.37% of cattle, sheep and goats, pack animals, poultry birds, and beehives of Oromia region, respectively. This shows that the study area is also known in livestock production.
2.2. Sample size and sampling methods
A three-stage sampling procedure was employed in this study. Arsi and West Arsi zones were purposively selected for this study because of accessibility, the suspected problem of mono-cropping which will lead us to the representativeness for addressing target of the study. First, highland and mid-highland Agroecological zone (AEZs) districts were identified based on discussions held with zones’ officials. For each of the two administrative zones, two districts were selected randomly from the listed districts of respective AEZ. The two districts selected from each zone were one from highland and the other from mid-highland AEZs. At the second stage, from each district two representative kebeles were selected, and finally at the third stage, respondent households were selected based on probability proportional to size (PPS) sampling method to undertake interview using structured questionnaire. Accordingly, Kofele and Lemu-Bilbilo districts were selected from West Arsi and Arsi zones, respectively, representing highland AEZ while Gedeb-Asasa and Hetosa were from mid-highland AEZ of the two zones respectively. Finally, a total of 385 households were randomly selected and interviewed based on Kothari (Citation2004) which will provide a representative size to ensure the desired precision (EquationEquation 1(1)
(1) ).
Where, N is the desired sample size; Z is the standard cumulative distribution that corresponds to the level of confidence with the value of 1.96; e is desired level of precision; p is the estimated proportion of an attribute present in the population with the value of 0.5 as suggested by Israel (Citation1992) to get the desired minimum sample size of households at 95% confidence level and ± 5% precision; q = 1-p. The number of respondents from each district and kebele was determined based on PPS as explained above (Table ). Cross-sectional household level data were collected. However, 12 observations, four from each district, were added for contingency purposes while seven observations were excluded due to the missing of data after data cleaning.
Table 1. Distribution of the sample in districts, Kebeles and households
Structured questionnaire was developed and pre-tested before final survey. The data collected includes the demographic and socioeconomic characteristics of the households, resource endowments like landholding and livestock possession, crop types grown and size land allocation for each crop, the number of plots, infrastructural and institutional facilities for households, and others. In addition, production system and inputs with their costs like farm mechanization types, pests and disease protection chemicals, fertilizer types, and oxen and human labor used along their associated cost were collected. The data were collected by face-to-face interview using trained and experienced enumerators from Asella agricultural engineering research center by using CSPro software. Moreover, to substantiate the facts from quantitative data that were collected through a formal survey, focus group discussions (FGD), and key informant interviews (KII) were conducted at each kebele.
2.3. Methods of data analysis
Both descriptive statistics and econometric model were employed in this study to precisely address the predefined objectives. Literatures revealed that different diversity measuring indices have been employed to measure crop diversification. Several methods can be used to examine the extent of crop diversification at a given point in time such as: Entropy Index (EI), Modified Entropy Index (MEI), Herfindahl Index (HI), Transformed Herfindahl Index (THI), Margalef index (MI), and Simpson Index (SI) methods (Pal and Kar, Citation2012). It is assumed that, as a rational decision-maker, a household should always select a portfolio of crop enterprises that fulfill certain criteria like high yielding, provides food security, reduce/minimize risk of crop failure, having good market demand based on their local conditions.
Hence, the choice of crop diversification level will follow a utility maximization theory based on certain features of crops. A household can maximize its utility by increasing household income, secure food security, maximize leisure time, minimizes risk of crop failure due to different diseases and climatic conditions, etc. (Inoni et al., Citation2021)., A household may choose and decides to grow a given combination of crops (bundles) measured by Crop Diversification Index (CDI) if the perceived utility is greater than the utility, he/she generate from other portfolio choices (CDI) available. Let Uj and Uk represent utility from two crop diversification indices (j and k), where “j” < “k”, then the random utility models for household can be given by:
where Xi is a vector of explanatory variables that determine CDI; βj, βk - represent parameters to be estimated and εj and εk – are error terms. Thus, the household will decide to adopt CDIj if perceived utility (Uij) is greater than other cropping options or CDIk (Uik).
Based on this premise, to analyze the determinants of crop diversification, in the first instance, the households-level crop diversification was estimated using indices, which measures the evenness (equitability). For this purpose, Simpson Diversification Index (SDI) was selected due to its simplicity for computation (Khatun & Roy, Citation2012), robustness (Sahal & Baha, Citation2010) and its wider applicability by other researchers to measure crop diversification (e.g., Aneani et al., Citation2011; Nagpure et al., Citation2017, Uddin, Citation2019; Vani & Pavithra, Citation2021). SDI is the difference between one and the sum of squares of all the proportion of a particular crop involved in a particular household represented as given in equations (1) and (2):
The crop diversification can be defined as:
Where ai = amount of land involved in a particular crop item produced by household i in a given time period, and A= total land owned by household i. Value of SDI ranges from zero to one, where value near to zero means the household is specialized while one means fully diversified household. Then, the diversification status of the households was categorized based on the rating given by Sahal and Baha (Citation2010) low (0 to 0.38), medium (0.39 to 0.63) and high (above 0.63). To identify the determinant factors, the level of diversification ordered logit model is employed.
The central idea in ordered logit is that there is a latent continuous metric underlying the ordinal responses observed by the analyst. Thresholds partition the real line into a series of regions corresponding to the various ordinal categories. The latent continuous variable, y* is a linear combination of some predictors, x, plus a disturbance term that has a standard Normal distribution. The dependent variable was SDI value labeled 1, 2, and 3 representing low, medium, and highly diversified respectively where the model is specified as EquationEquation 3(3)
(3) and estimated using Maximum Likelihood Estimation (MLE) method.
Where yi, the observed ordinal variable, takes on values 1 to 3 according to the following EquationEquation 4(4)
(4) :
The probability that a household “i” will fall in an alternative j is explained in EquationEquation 5(5)
(5) :
For the ordered logit, F is the logistic cumulative distribution function . The interpretation of coefficient in ordered logit is similar to normal logit model where the sign of the coefficients shows whether the latent variable y* increases with the regressor. The magnitude of the coefficients has no meaning and marginal effect value is important to estimate the likelihood of a given observation to be in a certain category such as low, medium, or higher. The marginal effect of an increase in a regressor xr on the probability of selecting alternative j is shown in (6):
Where the marginal effects of each variable on the different alternatives sum up to zero. While marginal effects interpretation follows: each unit increase in the independent variable increases/decreases the probability of selecting alternative j by the marginal effect expressed as a percent. For the analysis of the data a STATA-software package version-17.0 was employed.
Furthermore, level of farm mechanization was computed following Singh (Citation2006) based on the matrix of use of animate and mechanical energy inputs incorporating cost factors as in Equation Equation7(7)
(7) .
Where MI is mechanization index; CMi, CHi, and CAi are the costs of using machinery, human labor and animal power by ith household per hectare, respectively. Similarly, size of livestock possessed by a household was converted into tropical livestock units (TLU) based on Storck et al. (Citation1991).
2.4. Definition and hypothesis of variables included in the model
Based on previous research outputs, a total of 14 explanatory variables like socioeconomic conditions, household demographics, farmer experiences, and community-level characteristics (Degrande et al., Citation2006; Jarvis & Hodgkin, Citation2000; Mussema et al., Citation2013; Neill & Lee, Citation2001; Ryan et al., Citation2003) that are expected to have significant effects on crop diversification level at a household level were included in the model. Table below showed their definition and expected sign (hypothesis of the effect of the variable) on the dependent variable.
Table 2. Variables included in the model along with their expected signs
3. Result and discussion
3.1. Results
3.1.1. Probability of diversification and potential reasons
The mean landholding of a household was around 1.94 ha. The survey result depicted that on average a household allocated 50% of its landholding for wheat production (Table ). Barley is the second widely produced crop followed by faba bean each covering around 22 and 12% of the total farmland of a household. Other crops grown in the area include field peas, teff, vegetables (which include Ethiopian cabbage, head cabbage and red pepper), potatoes, oilseed (that include linseed and rapeseed), lentils, and chickpea.
Table 3. Crop types grown and mean farm land allocation (ha)
According to the survey result, more than 81.5% of the respondents perceive that they are diversified while around 18.5% of them assume that they specialize on certain crops (Table ). The result further showed that diversification is used as the main mitigation strategy of market and price fluctuation and means of food security and self-sufficiency. Mitigation strategy for risk of crop failures was the third reason, whereas labor diversification to reduce the pressure that can be occurred during peak agricultural seasons was the fourth reason for diversification of crop enterprises. However, as it can be seen from the result, most of the farmers are focusing more towards specialization. The FGD and KII results revealed that most farmers prefer to produce cereals (mostly wheat and barley) due to ease of production and availability of inputs. In most cases, mechanization technologies like harvesting and threshing are available for cereals only. Improved seed for alternative crops like pulses, fruit and vegetables are hardly available due to the absence of seed producers. The perishability of root crops like potato, carrot, beetroots, and fruits and vegetables was also another obstacle that was raised by farmers. Finally, land availability was raised as one of the lock-in constraints to diversify their production as the farmers consider cereals important for food self-sufficiency and prefer its production.
Table 4. Farmers’ perception on their crop production system
3.1.2. Level of crop diversification in the study area
The result revealed that mean household crop diversification level was 0.48 (Table ). Based on Sahal and Baha (Citation2010) classification, the result further showed that around 25% of the households are low diversified while around 44% and 32% are producing medium and highly diversified crop portfolios (bundles of crops), respectively.
Table 5. Household distribution by level of crop diversification index (CDI)
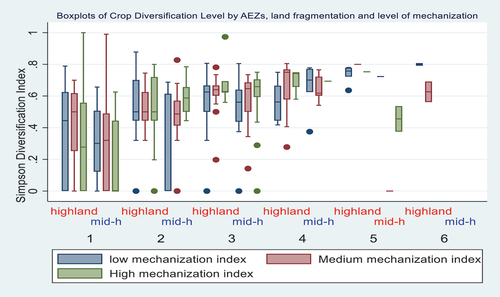
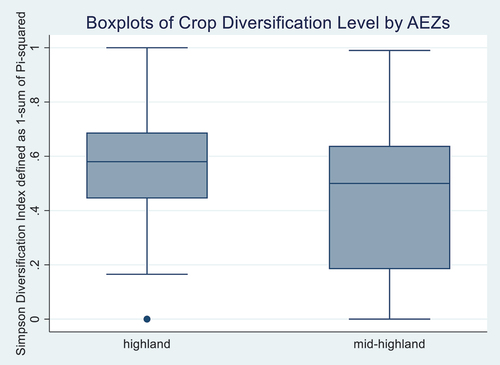
The boxplot graph was used to compare the Simpson diversification index of crop diversification along three variables: agroecological zones (highland vis-à-vis mid-highlands), land fragmentation (number of plots of land owned) and the level of farm mechanization. The figure illustrated the overall distribution of CDI by those above-mentioned variables. The figure showed that households having a smaller number of land plots (less fragmented), in mid-highland areas present low CDI (<0.4) while in the case where number of plots were greater than 2, the CDI ranges between 0.4 and 0.6. The figure further unveiled that the number of plots in mid-highland areas was not more than 5 (Figure ). Boxplots (Annex 1) also showed that households in highland AEZs have higher median of CDI with less dispersion while the mid-highland households have lower median with more dispersion of CDI distribution.
Figure 2. Boxplots of CDI by AEZs, land fragmentation and mechanization level.
3.1.3. Determinants of crop diversification
Before embarking on an analysis of crop diversification, the crop diversification level should be estimated first using the SDI and then categorized the households as low, medium and high based on Sahal and Baha (Citation2010) index wherein low (0 to 38%), medium (39% to 63%) and high (above 63%). Then, ordered logistic regression model was used to identify the determinants of the crop diversification level in the study area.
Prior to running ordered probit, multicollinearity test was done for explanatory variables using a “Collin” command and all the variables have a Variance Inflation Factors (VIF) of less than two and the mean value was 1.26 (Table ), which implies that the problem is not there among explanatory variables. After running the model, the central assumption of the ordered logit model commonly known as proportional odds assumption was tested. This assumption says that the gaps among the various scales of the ordering are equidistant to each other or the effect of each predictor across the categories of the ordinal dependent variable is the same. This assumption was tested by running postestimation test called Brant Wald’s test (Brant, Citation1990). Brant test of parallel regression assumption revealed that the effect of each explanatory variable does not vary across different cutting points of the ordered outcome variable (Table ); hence, the ordered logit model is the appropriate to address the problem.
Table 6. Model fitness test (parallel regression assumption and collinearity diagnosis)
The Chi2-test for LR (14) of 157.83 with a probability of less than 1% is highly significant, indicating that the overall model significance is very good for the data used in the analysis. The Pseudo R2 value also indicates that 20.14% of the variation in the outcome variable (level of crop diversification) is explained by those explanatory variables included in the model. A total of 14 explanatory variables was included in the model, wherein 5 of them were found statistically significant in determining the level of crop diversification. The significant variables are family size, total farm landholding, level of farm mechanization (index), level of land fragmentation (number of plots) and spatial location (AEZs) of the farming households.
The result from odd ratios (Table ) revealed that family size of a household is positively and significantly affecting the level of crop diversification, implying the increase in family size of the household will increase the probability of being categorized as higher crop diversification. Size of farm landholding is also a variable that has a positive and significant effect on the household’s crop diversification level. The result shows that higher landholding leads to higher likely to be in the high category of crop diversification status. The level of farm mechanization was also another variable that affect probability of being in a higher crop diversification index. This implies that the higher the level of farm mechanization, the higher will be the probability of a household to diversifying its crop production system. Land fragmentation measure in terms of the number of farm plots is one of the important variables that affect probability of households’ level of crop diversification positively and significantly as it was hypothesized. Agroecological zone is an important factor that determines crop type to be grown by a farmer. According to the result, being in the highland agroecological zone increases the probability of being in high diversification level status significantly. The marginal effects of each significant variable on level of crop diversification for each category (low, medium, and high diversification level) was also reported (Table ).
Table 7. Odds ratios for ordered logit model estimation
Table 8. Marginal effects estimate for crop diversification level after ologit
3.2. Discussion
Even though most households considered themselves as diversified, the result of SDI showed that the diversification level in the study area is very low even compared to other locations in Ethiopia. For instance, the study done in the northern part of Ethiopia, showed that the majority of the households are high level crop diversifiers (46%) and 11% of them are very high diversifiers with CDI of 46 to 60% and 61 to 75%, respectively (Ejigu Berhie, Citation2019). Hence, this can justify that crop diversification in the study area is low compared to other parts of Ethiopia as expected. The main lock-in constraints to diversify were lack of improved varieties of alternative crops, lack of mechanization technologies, inputs like pesticides and land unavailability which are similar with other findings in some parts of Europe (Meynard et al., Citation2018).
According to the result, for one unit increase in family size, the odds ratio of higher level of crop diversification index versus the combination of medium and low diversification categories are 1.05 times greater, given that all other variables in the model are kept constant. The marginal effect’s value also shows that a one unit increase in family size of the household will associate with the 0.7% less likely to be in the lower level of crop diversification status and 0.93% more likely to be at the higher level of crop diversification status. The logical justification for this could be that as a household has more family member, it will be more concerned about food self-sufficiency and tried to be secured by diversifying its production. On the other hands, households with larger family size can supply more family labor for farm work and no problem of labor shortage to work on different fields at a time, which could enhance the probability of having higher crop diversification. This result is also similar with other authors (Baba & Abdulai, Citation2020; Culas, Citation2006; Derso et al., Citation2022; Rahman, Citation2008; Rahman & Kazal, Citation2015), who revealed that availability of labor and large family size could increase crop diversification.
The result also showed that higher landholding leads to higher likely to be in the high category of crop diversification status. The possible reason could be that if a household has less farm size, it may be limited to certain crops that are considered to be pertinent to household food security or larger landholding positively associated with higher levels of farm mechanization which positively affects the level of crop diversification (Annex 1). The odds ratio of the ordered logit model showed that for one unit increase in landholding, the odds of higher crop diversification level (measured in index) versus the combined medium and low categories are 1.9286 times greater, given other variables constant. Similarly, the odds of the combined medium and high categories versus low diversification are 1.93 times greater than fixing other variables constant in the model. As to the marginal effects, a one unit increase in the farmland size will be associated with the 9.84% and 3.37% less likely to be in a low crop diversification status and a medium crop diversification status respectively, while it is 13.21% more likely to be in a higher crop diversification status. Other studies also revealed that landholding has a positive relationship with crop diversification in Ethiopia and somewhere in the world (Amine & Fatima, Citation2016; Ashfaq et al., Citation2008; Baba & Abdulai, Citation2020; Benin et al., Citation2004; Engle Warnick et al., Citation2011; Ibrahim et al., Citation2009; Lawin & Tamini, Citation2019; Li et al., Citation2021, Mekonnen, Citation2019; Sichoongwe et al., Citation2014).
There were two arguments about the effects of level of farm mechanization on crop diversification (Daum, Citation2023). The first hypothesis was that farm mechanization leads to crop enterprise specialization at least at household level since farmers may prefer crops for which mechanization technologies are available. The second hypothesis was that highly mechanized farmers may diversify more because the mechanization will solve problem of labor shortage. For instance, some study supported that farm mechanization facilitates crop diversification as it facilitates the operation of labor intensive and drudgery activities (Dahlin & Rusinamhodzi, Citation2019; Daum et al., Citation2022). Similarly, at an early stage of mechanization, households may shift to easily mechanized crops as it was the case in Ghana and Ethiopia (Kansanga et al., Citation2018). Hence, the second hypothesis held true in this research. According to the odds ratio of the model, a one unit increase in the farm mechanization level will increase the odds of higher crop diversification level versus the combined medium and low categories by 2.65 times given that all of the other variables in the model remain constant. Likewise, the odds of the combined medium and high diversification versus low category of diversification are 2.65 times greater when other variables are constant. The marginal effects result also showed that a one unit increase in farm mechanization level increases the less likeliness of a household to be in low and medium level of crop diversification by 14.58% and 4.99%, respectively, and increases the more likeliness of a household in higher crop enterprise diversification status by 19.57%. This result is also in conformity with the findings of different studies in Ethiopia and others countries (Abro, Citation2012; Ashfaq et al., Citation2008; Wondimagegn Mesfin & Haji, Citation2011).
The result further showed that for a unit increase in the number of farm plots, the odds ratios of higher crop diversification level versus the combined medium and low categories are 2.72 times greater, keeping other variables constant. In the same manner, the odds of the combined medium and high crop diversification categories compared to lower diversification is 2.72 times greater given all other variables constant. The marginal effect results also revealed that a unit increase of the number of plots will associate with less probability to be at a low and medium crop diversification level by 14.97% and 5.12%, respectively. On the other hands the household will be 20.09% more likely to be at a high level of crop diversification which is similar to the findings of Lawin and Tamini (Citation2019).
According to the result, being in the highland agroecological zone increases the probability of being in high diversification level status significantly. For one unit increase in agroecological zone (shift from 0 to 1/from highland to mid-highland), the odds of high crop diversification level versus the combined medium and low categories are 0.45 times greater, ceteris paribus. Likewise, the odds of the combined medium and high categories versus low diversification are 0.45 times greater given that all other variables in the model are held constant. The result of marginal effects values also revealed that a shift from highland agroecological zone to mid highland will associate with a 12% and 4.12% more likely to be at a low and medium level of crop diversification. However, this shift from highland to mid-highland will be associated with the 16.10% less likely being at a high level of crop diversification status. In general, highland dwellers have more probability for higher diversification. Studies also evidenced that crop diversification level varies across locations (Sichoongwe et al., Citation2014; Rahman & Kazal, Citation2015).
4. Conclusion and recommendation
The majority of the respondents (81%) considered themselves as if they are producing diversified crops, and the main reason for diversification were mitigation strategy for crop failure and price fluctuation. Moreover, crop diversification is the way farmers are ensuring their families’ food security and self-sufficiency, and this implies that most of the farmers are well-aware of the importance of crop diversification at the household level. This helps them to be nutritionally better off and mitigate risk and contribute in solving monocropping problem. Crop diversification was measured by the Simpson Diversification Index method. Accordingly, the mean crop diversification index was 0.48. The diversification index result was categorized into three as low (0 to 38%), medium (39 to 63%), and high (above 63%) level of diversification index. The result revealed that around 25, 44, and 31% of the respondents are low, medium, and high diversifiers, respectively, which implies that the majority are medium level diversifiers. The ordered logit model was employed to identify determinants of crop enterprise diversification and a total of 14 explanatory variables was included in the model. Family size, landholding size, level of farm mechanization, level of land fragmentation (number of plots), and agroecological zone were variables that significantly affect the probability of being in higher crop diversification level. Those significant variables (landholding and land fragmentation) are both related to landholding, while family size and level of mechanization are related to labor availability. Hence, land and labor are the most important issues to be focused on the enhancement of crop diversification.
It is clear that crop diversification is an important farm practice that can improve biodiversity, reduce risk of farmers to loss as a result of crop failure, improves nutritional diversity of a household and in general improves household livelihoods. The study revealed that labor availability and farm machinery use status are the most important factors in determining the level of crop diversification. Hence, in order to enhance crop diversification in the study area, improving farm machinery access to reduce labor problem should be given due attention to improve crop diversification. The use of land augmenting technologies especially, irrigation should also be one of the important policy agenda to increase land access with increasing cropping intensity.
Agroecological zone is the main base for crop diversification as choice of crop to grow by a farmer is determined mainly by its agroecological adaptability. According to these findings, farmers of mid-highland areas are tending to practice mono-cropping. And from the researchers’ observation, wheat is the most widely grown crop in the area. This is may be due to the absence of alternative crop or some other reasons to diversify. Hence, further research to identify determinants of crop choice in the study areas should be conducted based on AEZs. Furthermore, agricultural research institutes and extension should give attention in introducing new competitive crops that can best perform in the area. The main limitation of this study was also its dependency on cross sectional household level data and hence, a study based on regional level data may give more concrete and consolidated results especially to give a larger national image.
Disclosure statement
No potential conflict of interest was reported by the author(s).
Additional information
Funding
References
- Abro, A. A. (2012). Determinants of crop diversification towards high value crops in Pakistan. International Journal of Business Management & Economic Research, 3(3), 536–19.
- Amine, B. M., & Fatima, B. (2016). Determinants of on-farm diversification among Rural households: Empirical evidence from northern Algeria. International Journal of Food and Agricultural Economics, 4(2), 87–99. https://ageconsearch.umn.edu/record/234912/files/vol4.no2.pp87.pdf
- Aneani, F., Anchirinah, V. M., Owusu-Ansah, F., & Asamoah, M. (2011). An analysis of the extent and determinants of crop diversification by cocoa (theobroma cacao) farmers in Ghana. African Journal of Agricultural Research, 6(18), 4277–4287.
- Ashfaq, M., Hassan, S., Naseer, Z. M., Baig, A., & Asma, J. (2008). Factors affecting farm diversification in rice–wheat. Pakistan Journal of Agricultural Sciences, 45(3), 45–47.
- Baba, A. R. and Abdulai, A. (2020). Determinants of crop diversification and its effects on household food security in northern Ghana. Journal of Economic Theory and Practice, 20(2), 227–245. https://doi.org/10.1177/0976747920936818
- Bedoussac, L., Journet, E.-P., Hauggaard-Nielsen, H., Naudin, C., Corre-Hellou, G., Steen Jensen, E., Prieur, L., & Justes, E. (2015). Ecological principles underlying the increase of productivity achieved by cereal-grain legume intercrops in organic farming. A review. Agronomy for Sustainable Development, 35(3), 911–935. https://doi.org/10.1007/s13593-014-0277-7
- Beillouin, D., Ben‐Ari, T., Malézieux, E., Seufert, V., & Makowski, D. (2021). Positive but variable effects of crop diversification on biodiversity and ecosystem services. Global Change Biology, 27(19), 4697–4710. https://doi.org/10.1111/gcb.15747
- Benin, S., Smale, M., Pender, J., Gebremedhin, B., & Ehui, S. (2004). The economic determinants of cereal crop diversity on farms in the Ethiopian highlands. Agricultural Economics, 31(2–3), 197–208. https://doi.org/10.1111/j.1574-0862.2004.tb00257.x
- Berhane, G., Dereje, M., Minten, B., & Tamru, S. (2017). The rapid–but from a low base–uptake of agricultural mechanization in Ethiopia: Patterns, implications and challenges (Vol. 105). Intl Food Policy Res Inst.
- Brant, R. (1990). Assessing proportionality in the proportional odds model for ordinal logistic regression. Biometrics, 46(4), 1171–1178. https://doi.org/10.2307/2532457
- Chavas, J., & Holt, M. (1990). Acreage decisions under risk: The case of corn and soybeans. American Journal of Agricultural Economics, 72(3), 529–538. https://doi.org/10.2307/1243021
- CSA (The Federal Democratic Republic of Ethiopia Central Statistical Agency). (2021a). Agricultural Sample Survey 2020 / 2021 (2013 E.C.) (September – September 2021) volume vii report on area and production of major crops (private peasant holdings, Meher season).
- Culas, R. J. (2006). Causes of farm diversification over time: An Australian perspective on an eastern Norway model. Australian Farm Business Management Journal, 3, 1–9. https://doi.org/10.22004/ag.econ.122238
- Cutforth, L. B., Francis, C. A., Lynne, G. D., Mortensen, D. A., & Eskridge, K. M. (2001). Factors affecting farmers’ crop diversity decisions: An integrated approach. American Journal of Alternative Agriculture, 16(4), 168–176. https://doi.org/10.1017/S0889189300009164
- Dahlin, A. S., & Rusinamhodzi, L. (2019). Yield and labor relations of sustainable intensification options for smallholder farmers in sub-saharan africa. A meta-analysis. Agronomy for Sustainable Development, 39(3), 1–18. https://doi.org/10.1007/s13593-019-0575-1
- Daum, T. (2023). Mechanization and sustainable agri-food system transformation in the Global south. A review. Agronomy for Sustainable Development, 43(1), 16. https://doi.org/10.1007/s13593-023-00868-x
- Daum, T., Baudron, F., Birner, R., Guimarães, R. F., & McManus, C. M. (2022). Addressing agricultural labour issues is key to biodiversity-smart farming. Regional Environmental Change, 17(2), 411. Unpublished Manuscript de Oliveira SN, de Carvalho Júnior OA, Gomes RAT et al (2017) Landscape-fragmentation change due to recent agricultural expansion in the Brazilian Savanna, Western Bahia https://doi.org/10.1007/s10113-016-0960-0
- Davis, A. S., Hill, J. D., Chase, C. A., Johanns, A. M., & Liebman, M. (2012). Increasing cropping system diversity balances productivity, profit- ability and environmental health. PLoS One, 7(10), e47149. https://doi.org/10.1371/journal.pone.0047149
- Degrande, A., Schreckenberg, K., Mbosso, C., Anegbeh, P., Okafor, V., & Kanmegne, J. (2006). Farmers’ fruit tree-growing strategies in the humid forest zone of Cameroon and Nigeria. Agroforestry Systems, 67(2), 159–175. https://doi.org/10.1007/s10457-005-2649-0
- Dercon. (2002). Income risk, coping strategies and safety nets. The World Bank Research Observer, 17(2), 141. https://doi.org/10.1093/wbro/17.2.141
- Derso, D., Tolossa, D., & Seyoum, A. (2022). A double hurdle estimation of crop diversification decisions by smallholder wheat farmers in Sinana district, Bale zone, Ethiopia. CABI Agriculture and Bioscience, 3(1), 25. https://doi.org/10.1186/s43170-022-00098-3
- DiFalco, S., & Perrings, C. (2005). Crop biodiversity, risk management and the implications of agricultural assistance. Ecological Economics, 55(4), 459–466. https://doi.org/10.1016/j.ecolecon.2004.12.005
- Ejigu Berhie, C. 2019. The Role of Crop Diversification to Household Food Security: The Case of Enderta Woreda, Tigray, Ethiopia. MSC ThesisSubmitted to Addis Ababa University College of Development Studies Center for Food Security Studies
- Engle Warnick, J. C., Escobal, J., & Laszlo, S. C. (2011). Ambiguity aversion and portfolio choice in small-scale Peruvian farming. The B.E. Journal of Economic Analysis &policy, 11(1), 1–56. https://doi.org/10.2202/1935-1682.2331
- Feliciano, D. (2019). A review on the contribution of crop diversification to Sustainable Development goal 1 “no poverty” in different world regions. Sustainable Development, 27(4), 795–808. https://doi.org/10.1002/sd.1923
- Garibaldi, L. A., Steffan-Dewenter, I., Winfree, R., Aizen, M. A., Bommarco, R., Cunningham, S. A., Kremen, C., Carvalheiro, L. G., Harder, L. D., Afik, O., Bartomeus, I., Benjamin, F., Boreux, V., Cariveau, D., Chacoff, N. P., Dudenhoffer, J. H., Freitas, B. M., Ghazoul, J. … Williams, N. (2013). Wild pollinators enhance fruit set of crops regardless of honey bee abundance. Science, 339(6127), 1608–1611. https://doi.org/10.1126/science.1230200
- Haughey, E., Suter, M., Hofer, D., Hoekstra, N. J., McElwain, J. C., Lüscher, A., & Finn, J. A. (2018). Higher species richness enhances yield stability in intensively managed grasslands with experimental disturbance. Scientific Reports, 8(1), 15047. https://doi.org/10.1038/s41598-018-33262-9
- Hufnagel, J., Reckling, M., & Ewert, F. (2020). Diverse approaches to crop diversification in agricultural research. A review. Agronomy for Sustainable Development, 40(2), 14. https://doi.org/10.1007/s13593-020-00617-4
- Hua, W., Sohngen, B., & Hite, D. (2005). Assessing the relationship between crop choice and land use change using a Markov model (No. 378-2016-21462).
- Ibrahim, H., Rahman, S., Envulus, E., & Oyewole, S. (2009). Income and crop diversification among farming households in a rural area of North central Nigeria. Agro-Science: Journal of Tropical Agriculture, Food, Environment and Extension, 8(2), 84–89. https://doi.org/10.4314/as.v8i2.51102
- Inoni, O. E., Gani, B. S., & Sabo, E. (2021). Drivers of Crop Diversification: Evidence from Smallholder Farmers in Delta State Nigeria. Acta Universitatis Agriculturae et Silviculturae Mendelianae Brunensis, 69(1), 59–70. https://doi.org/10.11118/actaun.2021.006
- Israel, G. D. (1992). Sampling the evidence of extension program impact. University of Florida Cooperative Extension Service, Institute of Food and Agriculture Sciences, EDIS.
- Jarvis, D., & Hodgkin, T. (2000). Farmer decision making and genetic diversity: Linking multidisciplinary research to implementation on-farm. Genes in the Field: On-Farm Conservation of Crop Diversity, 261–278.
- Kansanga, M., Andersen, P., Kpienbaareh, D., Mason-Renton, S., Atuoye, K., Sano, Y., Antabe, R., & Luginaah, I. (2018). Traditional agriculture in transition: Examining the impacts of agricultural modernization on smallholder farming in Ghana under the new Green Revolution. International Journal of Sustainable Development & World Ecology. https://doi.org/10.1080/13504509.2018.1491429
- Karp, D. S., Mendenhall, C. D., Sandi, R. F., Chaumont, N., Ehrlich, P. R., Hadly, E. A., & Daily, G. C. (2013). Forest bolsters bird abundance, pest control and coffee yield. Ecology Letters, 16(11), 1339–1347. CrossRef https://doi.org/10.1111/ele.12173
- Kasem, S., & Thapa, G. B. (2011). Crop diversification in Thailand: Status, determinants, and effects on income and use of inputs. Land Use Policy, 28(3), 618–628. https://doi.org/10.1016/j.landusepol.2010.12.001
- Khatun, D., & Roy, B. C. (2012). Rural livelihood diversification in West Bengal: Determinants and constraints. Agricultural Economics Research Review, 25(No.1), 115–124.
- Kothari, C. R. (2004). Research Methodology: Methods and techniques (2nd ed.). New Age International.
- Kurdy´s-Kujawska, A., Strzelecka, A., & Zawadzka, D. (2021). The impact of crop diversification on the economic efficiency of small farms in Poland. Agriculture, 11(3), 250. https://doi.org/10.3390/agriculture11030250
- Lawin, K. G., & Tamini, L. D. 2019. Determinants of crop diversification in Burkina Faso What is the impact of risk preference? Available at Retrieved July 18, 2023. https://cirano.qc.ca/files/publications/2019s-07.pdf
- Li, C., Chen, X., Jiang, A., Lee, M.-B., Mammides, C., & Goodale, E. (2021). Socioeconomic determinants of crop diversity and its effect on farmer income in Guangxi, southern China. Agriculture, 11(4), 336. https://doi.org/10.3390/agriculture11040336
- Li, C., Fuller, D. Q., He, X., Zhu, S., Zhou, H., Wang, Y., Li, Y., Fan, J., Yang, J., & Yang, J. (2009). Crop diversity for yield increase. PLoS ONE 2009, 4(11), e8049. [CrossRef] [PubMed] https://doi.org/10.1371/journal.pone.0008049
- Li, L., Li, S. M., Sun, J. H., Zhou, L. L., Bao, X. G., Zhang, H. G., & Zhang, F. S. (2007). Diversity enhances agricultural productivity via rhizosphere phosphorus facilitation on phosphorus-deficient soils. Proceedings of the National Academy of Sciences of the United States of America, 104(27), 11192–11196. https://doi.org/10.1073/pnas.0704591104
- Lin, B. B. (2011). Resilience in agriculture through crop diversification: Adaptive management for environmental change. BioScience, 61(3), 183–193. https://doi.org/10.1525/bio.2011.61.3.4
- Liu, K., Johnson, E. N., Blackshaw, R. E., Hossain, Z., & Gan, Y. (2019). Improving the productivity and stability of oilseed cropping systems through crop diversification. Field Crops Research, 237, 65–73. https://doi.org/10.1016/j.fcr.2019.03.020
- Makate, C., Wang, R., Makate, M., & Mango, N. (2016a). Crop diversifcation and liveli- hoods of smallholder farmers in Zimbabwe: Adaptive management for environmental change. SpringerPlus, 5(1), 1–18. https://doi.org/10.1186/s40064-016-2802-4
- Makate, C., Wang, R., Makate, M., & Mango, N. (2016b). Crop diversification and livelihoods of smallholder farmers in Zimbabwe: adaptive management for environmental change. SpringerPlus, 5(1), 1135. https://doi.org/10.1186/s40064-016-2802-4
- Malézieux, E., Crozat, Y., Dupraz, C., Laurans, M., Makowski, D., Ozier-Lafontaine, H., Rapidel, B., De Tourdonnet, S., & Valantin-Morison, M. (2009). Mixing plant species in cropping systems: Concepts, tools and models: A review. In Sustainable agriculture (pp. 329–353). Springer Netherlands. https://doi.org/10.1007/978-90-481-2666-8_22
- Meynard, J. M., Charrier, F., Fares, M., Le Bail, M., Magrini, M. B., Charlier, A., & Messéan, A. (2018). Socio-technical lock-in hinders crop diversification in France. Agronomy for Sustainable Development, 38(5), 54. https://doi.org/10.1007/s13593-018-0535-1
- Mussema, R., Kassa, B., Dawit, A., & Rashid, S. (2013). Factors affecting farmers’ crops diversification: Evidence from SNNPR, Ethiopia. International Journal of Agricultural Science,s, 3(6), 558–565.
- Nagpure, S. C., Deshmukh, R. G., Sharma, P. K., & Ingole, D. N. (2017). Pattern of crop concentration and crop diversification– an economic analysis. Maharashtra Journal of Agricultural Economics, 20(2), 128–132.
- Neill, S. P., & Lee, D. R. (2001). Explaining the adoption and disadoption of sustainable agriculture: The case of cover crops in northern Honduras. Economic Development & Cultural Change, 49(4), 793–820. https://doi.org/10.1086/452525
- Njeru, E. M. (2013). Crop diversification: A potential strategy to mitigate food insecurity by smallholders in sub-saharan africa. Journal of Agriculture, Food Systems, and Community Development, 3(4), 63–69. https://doi.org/10.5304/jafscd.2013.034.006
- Pal, S. and Kar, S. (2012). Implications of the methods of agricultural diversification in reference with Malda District: Drawback and rationale. International Journal of Food, Agriculture and Veterinary Science, 2(2), 97–105. http://www.cibtech.org/jfav.htm
- Phelan, P., Moloney, A. P., McGeough, E. J., Humphreys, J., Bertilsson, J., O’Riordan, E., & O’Kiely, P. (2015). Forage legumes for grazing and conserving in ruminant production systems. Critical Reviews in Plant Sciences, 34(1–3), 281–326. https://doi.org/10.1080/07352689.2014.898455
- Pingali, P., & Rosegrant, M. (1995). Agricultural commercialization and diversification: Processes and policies. Food Policy, 20(3), 171–185. https://doi.org/10.1016/0306-9192(95)00012-4
- Pope, R., & Prescott, R. (1980). Diversification in relation to farm size and other socioeconomic characteristics. American Journal of Agricultural Economics, 62(3), 554–559. https://doi.org/10.2307/1240214
- Rahman, S. (2008). Determinants of crop choices by Bangladeshi farmers: A bivariate probit analysis. Asian Journal of Agriculture and Development, 5(1), 29–41. https://doi.org/10.37801/ajad2008.5.1.2
- Rahman, S., & Kazal, M. M. H. (2015). Determinants of crop diversity in the regions of Bangladesh (1990–2008). Singapore Journal of Tropical Geography, 36(2015), 83–97. https://doi.org/10.1111/sjtg.12086
- Raseduzzaman, M., & Jensen, E. S. (2017). Does intercropping enhance yield stability in arable crop production? ameta-analysis. The European Journal of Agronomy, 91, 25–33. https://doi.org/10.1016/j.eja.2017.09.009
- Renard, D., & Tilman, D. (2019). National food production stabilized by crop diversity. Nature, 571(7764), 257–260. https://doi.org/10.1038/s41586-019-1316-y
- Rosa-Schleich, J., Loos, J., Mußhoff, O., & Tscharntke, T. (2019). Ecological economic trade-offs of diversified farming systems – a review. Ecological Economics: The Journal of the International Society for Ecological Economics, 160, 251–263. https://doi.org/10.1016/j.ecolecon.2019.03.002
- Ryan, R. L., Erickson, D. L., & De Young, R. (2003). Farmers’ motivations for adopt- ing conservation practices along riparian zones in a mid-Western agricultural watershed. Journal of Environmental Planning and Management, 46(1), 19–37. https://doi.org/10.1080/713676702
- Sahal, B., & Baha, R. (2010). Livelihood diversification pursued by farmers in West Bengal. Indian Research Journal of Extension Education, 10(2), 2.
- Schneider, L. (2011). Bearing risk is hard to do: Crop price risk transfer for poor farmers and low-income countries. Development in Practice, 21(4–5), 536–549. https://doi.org/10.1080/09614524.2011.561289
- Sichoongwe, K., Mapemba, L., Ng’ong’ola, D., & Tembo, G. 2014. The determinants and extent of crop diversification among smallholder farmers: A case study of southern province, Zambia. Malawi strategic support program; Working Paper (05). International Food Policy Research Institute (IFPRI). https://pdfs.semanticscholar.org/b6c7/c157bf2cf8de018e47d2519e9e7536ed2261.pdf.
- Sime Kidane, M. 2019. The nexus of crop and income diversification, commercialisation and household welfare: empirical evidence from Ethiopia. [ Doctoral dissertation]. University of KwaZulu-Natal.
- Singh, G. (2006). Estimation of a Mechanisation index and its impact on production and economic factors-a case study in India. Biosystems Engineering, 93(1), 99–106. https://doi.org/10.1016/j.biosystemseng.2005.08.003
- Storck, H., Bezabeh, E., Berhanu, A., Borowiecki, A., & Shimeles, W. H. (1991). Farming systems and farm management practices of the 149 smallholders in the Hararghe highlands: A baseline survey. Farming Systems and Resource Economics in the Tropics, 11, 1991–195.
- Tesfaye, W. (2021). Crop diversification increases household diets and improves child growth in Ethiopia. African Economic Research Consortium, Policy Brief No. TR007.
- Timmer, C. (1997). Farmers and markets: The political economy of new paradigms. American Journal of Agricultural Economics, 79(2), 621–627. https://doi.org/10.2307/1244161
- Uddin, M. R. (2019). Crop diversification for dietary diversity and nutrition: Evidence from Bangladeshi farm households. Bangladesh Institute of Development Studies.
- Vani, N. R., & Pavithra, R. H. (2021). Trends and determinants of crop diversification in Chikkaballapur district of Karnataka: An economic analysis. Journal of Research in Agriculture and Animal Science, 8(10), 16–21.
- Waha, K., van Wijk, M. T., Fritz, S., See, L., Thornton, P. K., Wichern, J., & Herrero, M. (2018). Agricultural diversification as an important strategy for achieving food security in Africa. Global Change Biology, 24(8), 3390–3400. https://doi.org/10.1111/gcb.14158
- Watson, C., Reckling, M., Preissel, S., Bachinger, J., Bergkvist, G., Kuhlman, T., Lindströmk, N. T., Topp, C., Vanhatalo, A., Zander, Z., Murphy-, B. D., & Stoddard, F. (2017). Grain legume production and use in European agricultural systems. Advances in Agronomy, 144(1), 235–303.
- Weißhuhn, P., Reckling, M., Stachow, U., & Wiggering, H. (2017). Supporting agricultural ecosystem services through the integration of perennial polycultures into crop rotations. Sustainability, 9(12), 2267. https://doi.org/10.3390/su9122267
- Westcott, P., & Young, C. (2004). Farm program effects on agricultural production: Coupled and decoupled programs. In M. Burfisher & J. Hopkins (Eds.), Decoupled payments in a changing policy setting, agricultural economic report (p. 838).
- Wondimagegn Mesfin, B. F., & Haji, J. (2011). Pattern, trend and determinants of crop diversification: Empirical evidence from smallholders in Eastern Ethiopia. Journal of Economics & Sustainable Development, 2(8), 78–89. www.iiste.org
- Wu, J., & Brorsen, B. (1995). The impact of government programs and land characteristics on cropping patterns. Canadian Journal of Agricultural Economics/Revue Canadienne D’agroeconomie, 43(1), 87–104. https://doi.org/10.1111/j.1744-7976.1995.tb00109.x
- Wu, W. B., Yu, Q. Y., Peter, V. H., You, L. Z., Peng, Y. A. N. G., & Tang, H. J. (2014). How could agricultural land systems contribute to raise food production under global change? Journal of Integrative Agriculture, 13(7), 1432–1442. https://doi.org/10.1016/S2095-3119(14)60819-4
- Zeller, M., Diagne, A., & Mataya, C. (1998). Market access by smallholder farmers in Malawi: Implications for technology adoption, agricultural productivity and crop income. Agricultural Economics, 19(1–2), 219–229. https://doi.org/10.1111/j.1574-0862.1998.tb00528.x
- Zerssa, G., Feyssa, D., Kim, D.-G., & Eichler-Löbermann, B. (2021). Challenges of smallholder farming in Ethiopia and opportunities by adopting Climate-Smart Agriculture. Agriculture, 11(3), 192. Agriculture 2021, 11, 192 https://doi.org/10.3390/agriculture11030192
Annexes
Annex 1. Boxplots of crop diversification level by AEZs.
Annex 2.
Correlation coefficients between explanatory variables