
 ?Mathematical formulae have been encoded as MathML and are displayed in this HTML version using MathJax in order to improve their display. Uncheck the box to turn MathJax off. This feature requires Javascript. Click on a formula to zoom.
Abstract
This study analyzed vegetable production status and marketing systems in Ethiopia, Sebeta Hawas Woreda, and the Oromia region. The study collected primary data through household surveys, focus group discussions, observations, and key informant interviews. The data were analyzed using descriptive statistics, the gross profit formula, and the structure-conduct-performance model. The study results revealed that cabbage, onion, and tomato were the top three vegetable crops dominantly grown, contributing 67.7% of the total vegetables produced in the study area. The profitability analysis results indicated that tomato, onion, and cabbage production was profitable. The results of the market structure analysis indicated that the market structure for onions, tomatoes, and cabbage was a strong oligopolistic market. The market conduct analysis result revealed that the prices of vegetables were determined by the traders. The results of market performance analysis revealed that the dominant marketing channel for onions, tomatoes, and cabbage was the “producer → broker → wholesaler → retailer → consumer” channel. Smallholder farmers obtained the highest profit shares of 61%, 39%, and 51% from cabbage, onion, and tomato, respectively, when vegetables were directly supplied to wholesalers. The study results revealed that vegetable production was profitable, though the marketing system was found to be inefficient. Therefore, the study suggested intervention by the government through the design of effective policies to improve the performance of vegetable production and marketing systems. Furthermore, NGOs can provide tailored training, and universities, research institutes, agrochemicals, and seed companies can supply cost-effective agricultural inputs so that vegetable production and marketing systems are enhanced.
1. Introduction
Agriculture serves as a vital source of livelihoods, income growth, socio-economic development, employment, food security, poverty alleviation, and environmental sustainability in developing countries (Gollin, Citation2010; Pingali, Citation2010; World Bank, Citation2008). Like other developing countries, the Ethiopian economy is highly dependent on agricultural activities, and the sector contributes about 37 percent to GDP (Food Outlook, Citation2018); hence, it is the backbone of the economy. It is also the main sector of employment, where about 84 percent of the total population of the country is engaged in various agricultural activities (Central Statistical Agency (CSA) (Citation2020) and generates 79% of foreign earnings. The sector is believed to be the main source of capital for establishing a future industrialized Ethiopia (CSA, Citation2020). Among other agricultural activities, vegetable production and marketing play a great role in Ethiopia’s food supply and income generation for smallholders.
In Ethiopia, vegetable production is an essential economic activity that involves smallholder farming, commercial state farms, and private commercial farms (Rahiel et al., Citation2018). It is undertaken either as a sole crop or intercropped with other vegetables or cereals (Hailu et al., Citation2015). Banjaw (Citation2017) stated that vegetable production is an effective means to realize poverty reduction objectives by offering new market opportunities for farmers, consumers, and the agro-industry to ensure enhanced health and well-being of consumers. Among the vegetables grown in different parts of Ethiopia, tomatoes, potatoes, beetroots, carrots, cabbage, onions, and hot peppers are the most economically important.
Sebeta Hawas Woreda/District has a large potential for vegetable production. Smallholders in the Woreda are producing vegetables to generate income and enhance household food security, with varying levels of production and surplus supplied to the market. The Ethiopian vegetable sector is facing the challenges of an inadequate transport network, markets characterized by a poor market information system, and an underdeveloped industry (Haji, Citation2008). The weak production-market linkage forced smallholders to sell their products in an unorganized way, thereby resulting in an unfair market share of the final consumer price. The Ethiopian government has developed a strategic framework to enhance market-driven production, solve problems of market access, and improve market linkages. Efforts were made to strengthen cooperatives, improve the supply of market information systems, and reinforce the participation of the private sector in agricultural marketing systems. However, private sector involvement was very slow, mainly in areas of high agricultural potential, and tended to serve mostly large-scale commercial farmers, leaving many smallholder farmers exposed to high transaction costs and market failures (Shiferaw et al., Citation2016). This limited the chance of diversifying livelihoods for smallholders from vegetable production (Mussema et al., Citation2013). Research by Legesse et al. (Citation2014) showed that the highest net marketing margin goes to wholesalers as they relatively charge a higher price using their market power. They revealed that smallholder farmers get the highest net marketing margin when they sell their vegetables directly to individual consumers through unions or consumer cooperatives. Furthermore, Emana (Citation2008) identified a lack of markets that absorb the production, a large number of middlemen, a lack of coordination among smallholder producers, poor preharvest and postharvest handling, an imperfect pricing system, and non-transparent market information as the major vegetable marketing challenges in Ethiopia.
Literature reviews results showed that many scholars (Abduali et al., Citation2017; Adugna, Citation2021; Aliyi et al., Citation2021; Asale et al., Citation2016; Banchamlak & Akalu, Citation2022; Eticha, Citation2017; Emana et al., Citation2015; Mahmood et al., Citation2017; Mdoda et al., Citation2022; Mukaila et al., Citation2021; Negasi, Citation2016; Olowo et al., Citation2022; Onuwa et al., Citation2021; Rehima, Citation2006; Wongnaa et al., Citation2019) have conducted studies on vegetables in Ethiopia and different countries of the world. However, the majority of these studies focused on identifying marketing channels for individual vegetables and provided limited empirical data on production profitability and marketing systems for vegetables. On the other hand, some of these studies have generalized the vegetable profitability analysis, making it difficult to differentiate which vegetable commodity is more profitable than another.
A study by Banchamlak and Akalu (Citation2022) focused on vegetable market supply by smallholders and examined the extent and determinants of market participation in Ethiopia. Although this study contributed to identifying determinants of vegetable market participation, it did not examine the profitability of vegetable production and marketing, market structure, conduct, or performance. Studies by Adugna (Citation2021) and Asale et al. (Citation2016) emphasized individual vegetable crops, i.e., onion marketing, and analyzed the structure, conduct, and performance of onion marketing. Besides, the study by Emana etal. (Citation2015) was innovative in its efforts to characterize vegetable production and marketing in Ethiopia. Nevertheless, the study was limited to mapping vegetable value chains and identifying marketing channels, while issues of marketing systems, crop-specific marketing channels, and profitability analysis were not addressed.
A study conducted by Onuwa et al. (Citation2021), Mahmood et al. (Citation2017), and Mdoda et al. (Citation2022) contributed to the literature by analyzing the profitability and cost-benefit of cucumber, cabbage, and carrot, which was limited to individual crops and did not consider the aspects of structure and conduct of the crops studied. The study conducted in Oyo State, Nigeria, by Mukaila et al. (Citation2021) assessed the effects of vegetable production on the income and livelihood of rural households. Although the study elaborated on the effects of vegetable production on the livelihoods of rural households and identified constraints faced by vegetable production, the conduct of vegetable marketing, the level of profits from vegetable farming, and the market structure of vegetables were overlooked. Besides, it did not screen out which vegetable was more contributing to the improvement of rural households livelihoods. Studies by Abduali et al. (Citation2017) analyzed the performance of vegetable production and marketing in peri-urban Kumasi, Ghana. Olowo et al. (Citation2022) examine the impacts of cultivating fruits and vegetables on rural livelihoods in Ondo State, Nigeria. The study contributed to existing literature by illustrating the improvements in rural livelihoods as a result of participating in fruit and vegetable production using a propensity score matching model and profitability parameters. Nevertheless, the study analyzed only the performance and production determinants aspects of vegetable production, leaving the issue of identifying marketing systems out of the study area. Another study by Mukaila et al. (Citation2021) analyzed the marketing of carrots and cucumbers in Enugu State, Nigeria. The study identified marketing channels for vegetables, assessed the marketing functions and margins, and identified the major constraints hindering the effective marketing of vegetables. However, the study has overlooked the concentration ratio and market conduct analysis. Wongnaa et al. (Citation2019) studied the profitability and constraints of urban exotic vegetable production systems in the Kumasi Metropolis of Ghana. The study filled the knowledge gap on the most profitable urban vegetable production system and highlighted the constraints of urban vegetable production that can help with policy formulation. In spite of its above-mentioned contributions, it lacked
The study conducted by Aliyi et al. (Citation2021) was comprehensive and carefully analyzed the performance, structure, conduct, and SWOT of vegetable production and marketing in Ethiopia. Although the study has contributed to the profitability and performance analysis of vegetable crops methodologically, the study location in terms of proximity to regional markets and the agro-ecology in which the study was conducted differ from the situation in Sebeta Hawas Woreda, the area where the current study was conducted. Besides, the study analyzed market structure only in terms of market concentration ratio, leaving other aspects of the topic unanalyzed. In addition to the aforementioned rationale, there was no study conducted in Sebeta Hawas Woreda on the related topic, and there is a lack of empirical information regarding smallholder vegetable production and marketing profitability in the study area. Therefore, to bridge the research and knowledge gaps, this study aims to analyze the production status and marketing system of vegetables in Sebeta Hawas Woreda.
2. Methodology
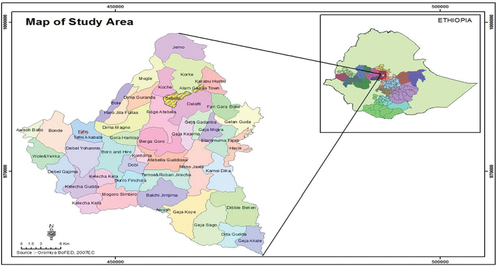
The study area, Sebeta Hawas Woreda, is located at a distance of 25 km in the South–West direction of Addis Ababa, Special Zone Surrounding Finfine, Oromia National Regional State, Ethiopia (Figure ). It has an average elevation of 2592.5 meters above sea level. The Woreda is situated at a latitude of 44′ 59.99′′ N′and a longitude of 38° 39′ 59.99′′ E. West direction of Addis Ababa, Special Zone Surrounding Finfine, Oromia National Regional State, Ethiopia (Figure ). It has an average elevation of 2592.5 meters above sea level. The Woreda is situated at latitude of 8°44′59.99″N and longitude of 38°39′59.99″E. The mean annual rainfall of the Woreda is about 1033 mm while the mean annual temperature is 21.5℃. The Woreda consists of 36 rural and 5 urban kebeles. According to a report of PP (Citation2022) the total population of the Woreda was 189912 where 97150 (51.2%) were males and 92762 (48.8%) were females. Agricultural activity (livestock rearing and crop production) is the dominant means of livelihood for the majority of Sebeta Hawas Woreda communities. Commonly grown vegetable crops in the area are onion, tomato, cabbage, habesha cabbage, beetroots, carrots, lettuce, pepper, potato, sweet potato, and taro.
Figure 1. Map of the study area.
3. Data types, sources and methods of data collections
Both quantitative and qualitative data were collected from primary sources. Face-to-face interviews using structured and pre-tested questionnaires, cross-sectional household surveys, key informant interviews and observations were used to collect primary data from smallholder farm households, traders, and key informants from October 2021 to February 2022. Reports of agriculture and natural resource offices at different levels, CSA, NGOs, office of trade and market development, office of Woreda administrative and previous research works were used to collect secondary data.
The data from experts were triangulated with data collected through household surveys and marketing agents about the production and marketing of vegetables. Besides, the sample experts provided detailed information regarding vegetable field management, preharvest and postharvest vegetable handling practices, wholesale and retail markets vegetable management, and waste management techniques at farm and marketing sites.
4. Sampling procedures and sample size determination
The study employed multi-stage sampling techniques to select the study area and sample vegetable producers. In the first stage, Sebeta Hawas Woreda was selected from six Woredas in special zones surrounding Addis Ababa/Finfine based on vegetable production potential. Second, seven vegetables producing kebeles were purposely selected from 36 rural kebeles in the Woreda based on the volume of vegetable production. In the third stage, a total of 385 smallholder farm households were randomly selected from 1927 vegetable producers in the district based on probability proportional to size sampling. For the cross-sectional household survey, representative sample size was obtained using Kothari (Citation2004) sample determination formula:
where n is the sample size needed, Z is the inverse of the standard cumulative distribution that corresponds to the level of confidence, e is the desired level of precision, p is the estimated proportion of an attribute that is present in the population, and q = 1-p. The value of Z is found in the statistical table which contains the area under the normal curve of 95% confidence level.
Snowball sampling techniques were used to collect marketing data from marketing actors across the chain. The technique was selected to pick initial small samples from overall vegetable traders and consumers. Accordingly, the total of 98 traders including 10 brokers, 18 wholesalers, 30 retailers, and 40 street vendors were selected based on the vegetable volume they purchased, and 15 consumers were interviewed to understand the demand behavior for the major vegetables marketed.
5. Methods of data analysis
The primary data collected by the household survey were entered into SPSS software and coded for ease of analysis. Quantitative data collected regarding vegetable production and marketing were analyzed using descriptive statistics like mean, standard deviation, table, and percentage. Thematic analysis was employed to analyze data collected through interviews from brokers, wholesalers, retailers, street vendors, consumers, and key informants (experts). The data analyzed qualitatively were harmonized with household survey data.
The profitability of vegetable production was analyzed using different formulas adapted based on Debertin (Citation1992) and Lessley et al. (Citation1991). Accordingly, total output (Y), output price (Py), total revenue (TR), variable input quantity (X), variable input prices (Px), total variable cost (TVC), total fixed costs (TFC), total cost (TC), gross margin (GM), net return (NR), and benefit cost ratio (BCR) were computed. Besides, total fixed costs (TFC) were calculated as sum of all fixed costs and interest on variable costs (opportunity costs) were calculated as opportunity cost in percent multiplied by variable costs (money) invested in vegetable production. The average dollar exchange rate (1ETB ≈ $43.8) was used during the profitability analysis.
Structure-conduct-performance (S-C-P) model was employed to examine the fundamental relationships between market structure, conduct, and performance. To get a full understanding and depiction of certain market functionality, a marketing system analysis of any commodity should include three main market elements, market structure, market conduct, and market performance, which can be described using various indicators.
5.1. Market structure analysis
According to Hanekom et al. (Citation2010) and Pender et al. (Citation2004), the market structure can be analyzed based on the size and number of firms involved in the marketing system, market concentration, and barriers to market entry. Market concentration analyses the number of firms and their distribution in the market. The concentration ratio is expressed as CRx, which represents the percentage of the market sector dominated by the largest X firms. The most common typical market concentration ratio used for judging market structure is four firms (CR4) (Kohls & Uhl, Citation2002). Accordingly, CR4 greater than 50% indicates strong oligopoly, CR4 between 33% and 50% is considered as a weak oligopoly, and CR4 less than 33% indicates that the market is not concentrated. The concentration ratio for was computed as:
where C is market concentration ratio; Si is percentage of market share of ith firms; r is number of largest firms
Where MSi is market share of buyer i; Vi is quantity of product handled by the buyer; ∑Vi is the total quantity of product by the r firms.
5.2. Market conduct analysis
According to Abay (Citation2010), market conduct is used to explain the behavior that market participants adapt or show to affect or adjust to the market in which they sell or buy. It is analyzed in terms of purchasing and selling strategies, price setting, existence of legal and illegal marketing groups, price information availability and quality of products, marketing behaviors of traders, and price-setting strategies.
5.3. Market performance analysis
Besides, market performance was analyzed in terms of marketing channels, gross marketing margin, and profit share of marketing agents in percentage. The costs and marketing margins of agents in different marketing channels of selected vegetables (onion, cabbage, and tomato) were computed to analyze the market performance. Bashargo and Srinivasa (Citation2002) indicated that market performance can be measured using marketing margins or price spread. Marketing margin helps us to compare prices at different levels of the marketing chain for a similar period of time. According to Mendoza (Citation1995), marketing margin computes the particular agent’s share of the final selling price in the marketing chain where it is related to the final price paid by the end user (consumer) and expressed in percentage. Therefore, marketing margins were calculated for different vegetable marketing agents using the following formulas:
TGMM: - Total gross marketing margin
GMMb: - is the percentage of total gross marketing margin obtained by brokers
GMMw: - is the percentage of total gross marketing margin obtained by wholesalers
GMMr: - is the percentage of gross marketing margin obtained by retailers
GMMsv: - is the percentage of gross marketing margin obtained by street vendors
GMMpr: - is the percentage of gross marketing margin obtained by processors
GMMp: - is the producers’ gross marketing margin which is calculated as proportion of the price paid by consumers that belongs to producers
Total marketing margin across marketing channels was calculated as follows:
TPMc is the total marketing margin across marketing channel.
PMma is profit margin obtained by marketing agents at each marketing channel.
Profit margin of marking agents at each marketing channel was calculated as follows:
SP is Selling Price per 100 kg in ETB
PP= Purchasing Price per 100 kg in ETB;
MC= Marketing Costs (sum of average costs of sorting and grading, loading and unloading, transportation, storage, losses, and service fees in ETB per 100 kg).
Besides, the profit share for a particular marketing agent at an each marketing channel was calculated as follows:
where PS is profit share received by particular marketing agent at each marketing channel
TPMc is the total profit margin across the marketing channel
PMma= Profit margin received by marketing agents at each marketing channel
6. Results and discussions
6.1. Vegetable production status
6.1.1. Types of vegetables dominantly grown and their share of production
The data were collected to identify the type of vegetables dominantly grown and the production share held by the individual crops in the study area. Accordingly, onion, garlic, tomato, cabbage, potato, habesha cabbage, beetroots, and carrots were the major crops grown in the study area (Table ). Regarding the share of land allocated to vegetables, about 58% of the total land was allocated to production of three vegetables. Accordingly, cabbage, onion, and tomato accounted for 25%, 19.9%, and 13.4% of the total land allocated to vegetable production, respectively. In terms of total outputs (volume of production), cabbage, onion, and tomato contributed 67.7% of the total vegetables produced in the study area in the 2021/22 cropping season. Thus, cabbage, onion, and tomato were the top three vegetables dominantly grown in the study area. Schreinemachers et al. (Citation2018) indicated that tomato, onion, and cabbage are important vegetables in the global economy due to their high consumption. Hanadi et al. (Citation2018) reported that farmers are willing to cultivate tomatoes more than any other vegetables due to its multiple harvest possibility and high demand in the market. Onion is also preferred due to its potential to improve economic status and producers’ welfare (Hussain et al., Citation2012).
Table 1. Types of vegetables crops dominantly grown and their share of production in the study area
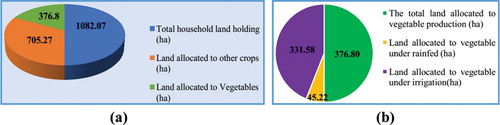
6.1.2. Total land allocated to vegetables and share of irrigated land area (ha) in the study Woreda
Figure shows the share of land allocated to different vegetables in the 2021/22 cropping season under rain-fed and irrigation production systems. The study result (Figure ) revealed that land allocated to vegetable production was 376.8 hectares (34.82%) out of the total 1082.07 hectares while 705.27 hectares (66.18%) was allocated to other food crops. This result shed light on the presence of huge land resources to expand vegetable production business in the study area, which can contribute to employment opportunities for youth and women, domestic consumption to improve food and nutrition security, and surplus production for export markets to earn foreign currency. The result also showed (Figure ) that out of the total 376.8 hectares of vegetable produced in the 2021/22 cropping season, 88% (331.58 hectares) of vegetables were produced under irrigation condition while the remaining 12% (45.22 hectares) were produced under rain-fed. This shows that vegetable production in the study area is mainly undertaken under irrigation to take advantage of yield, irrigation water access, and market opportunities. During focus group discussion with smallholder farmers and experts from agriculture and natural resource office and trade and market development office, most farmers prefer to produce vegetables under irrigation due to irrigation water availability, better price offer, and low risk of disease under irrigation production as compared to vegetable production under rain-fed condition. This result agrees with Oladimeji and Zakari (Citation2014) who reported that farmers who produced vegetables under irrigation received higher profit margin, gross ratio, and return on investment than those who produced vegetables under rain-fed conditions. Similarly, Ayoola (Citation2014) found that investment on tomato crop production under irrigation system was worthwhile, as it yielded greater revenue in excess of operational and overhead expenses in a comparison with that of rain-fed system. The implication of this finding was that farmers in the study area combine irrigation and rain-fed vegetable production to generate more and stable income to meet their financial and food needs.
Figure 2. Total land allocated to vegetables and share of irrigated land area (ha).
6.1.3. Productivity of vegetables
The productivity level of vegetables under investigation was assessed using the yield data gathered during the household survey. The mean productivity of onion, tomato, and cabbage in the 2021/22 production season was 26, 28.7, and 29.6 tons/ha, respectively. The FAOSTAT (Citation2021) report indicated that the national average productivity of onion, tomato, and cabbage was 9.19 t/ha, 6.25 t/ha, and 9.64 t/ha, respectively. The productivity of the individual vegetables in the study area was higher than that of the national average productivity. The implication of this result indicates that smallholder vegetable producers in the study area are applying good agronomic practices, improved inputs like seeds, fertilizers, and other farm resources and attained the higher yield. A study conducted in the Central Rift Valley by Getachew and Mohammed (Citation2012) reported an average yield level of 28 t/ha and 30 t/ha for onion and tomato, respectively. The productivity of onion, tomato, and cabbage at commercial farms was reported to be 22.6 t/ha, 30.3 t/ha, and 29.9 t/ha, respectively (Tabor et al., Citation2015). This shows that productivity of vegetable varies based on the locations and other agronomic practices and yield traits of vegetable seeds used.
During key interviews with horticulture experts at Woreda Agriculture and Natural Resource Office, different reasons for higher vegetable yield in the study area were discussed. The expert reported the following:
… Sebeta Hawas woreda is the potential vegetable producing woreda in Oromia Special Zone Surrounding Finfine (Addis Ababa). There are 18 peasant associations (Kebeles) producing different vegetables using irrigation and rainwater. Smallholders in the study area are well informed about economic importance of producing vegetables both under rain-fed and irrigated condition. The majority of the smallholder producers cultivate vegetable crops under irrigation condition due to the main three reasons: the first reason is that farming lands in the stud kebeles are flood prone where it is impossible to cultivate and expect yield during rainy season. The Rivers used as irrigation water sources for these kebeles (Akaki, Atebela and Awash River) overflow at the pick period of rain and destroy all the vegetables that are planted near to the river. For this reason, majority of smallholder decided not to grow vegetables under rain-fed condition in the areas. The second reason is that vegetables that are grown under irrigation condition have better market values and returns on investment. The third reason is that disease, insect, and pest management is relatively better for vegetables grown under irrigation condition than that of vegetables grown under rain-fed. Vegetable production in this area is efficient in its productivity and profitability. For instance, the productivity of onion, tomato, and cabbage ranges between 5.5–7.5 t/0.25 ha, 6.5–8.0 t/0.25 ha, and 7–8.3 t/0.25 ha, respectively. The productivity of these vegetables is higher than that of vegetable commodities grown in the other location. This yield achievement by smallholders in the study area is possibly due to the fertility of the soil, availability of sufficient irrigation water, experiences of the producers in vegetable farming, types of improved seeds, and other inputs used by the producers (16 January 2022).
6.1.4. Analysis of average cost of production and vegetable production profitability (ETB (dollar)/ha)
Vegetables (onion, tomato and cabbage) production profitability analysis was conducted on hectare basis (Table ). Costs were categorized into variable costs, fixed costs, and opportunity costs. Variable costs were high as compared to other costs where cost of seed, fuel, and chemical purchase costs contributed the highest percentage. The average total production costs of onion, tomato and cabbage were 127,255.40 ETB ($2905.4), 179639 ETB ($4101.4), and 129,69500ETB ($2961.07)/ha respectively. The average selling price for onion, tomato, and cabbage at farm level was 610, 820, and 678 Ethiopian birr/100 kg, respectively. The total revenues obtained by sample households from onion, tomato and cabbage produced in 2021/22 cropping season were 158,600 ETB ($3621.01), 235340 ETB ($5373.06), and 200,688 ($4581.92) per hectare, respectively. These results indicated the presence of significant difference among vegetable crops in total revenue from the same land unit. The highest total revenue ($5373.06) was gained from tomato followed by cabbage and onion. The comparative highest total revenue by tomato is due to its relative highest selling price offered per kilogram of the commodity. Although the total variable and operation costs were high for vegetable production, the net returns obtained were also high. These results showed that vegetable production is a profitable business. The benefit-cost ratio was calculated to evaluate the production efficiency of selected vegetable production in the study area. Accordingly, the benefit cost ratio for onion, tomato and cabbage was 1: 1.25, 1:1.31, and 1: 1.55, respectively. The result corroborates the findings of Chowdhuri et al. (Citation2014); Aliyi et al. (Citation2021); and Addisu (Citation2016) who reported that production of vegetables is profitable. Tahir and Altaf (Citation2013) found that vegetable production has vast potential of generating income, employment and is profitable despite the variation in net returns due to variation in yield rates.
Table 2. Cost of production and profitability analysis
7. Marketing of vegetables
7.1. Summary statistics of marketing factors (dummy variables)
The result showed that only 31.9% of sample households have access to storage facilities at farm site and marketplace, and 47.8% of the sample households have access to market (Table ). Though the study showed the Woreda has better proximity to the country’s capital Addis Ababa, the result indicated that the majority of the respondents do not have access to the market. This may be due to marketing factors like lack of adequate and appropriate market information and other marketing facilities. This finding corroborates with Madisa et al. (Citation2010) who reported that lack of access to market as a major constraint among vegetable producers. The Ethiopian government has developed a strategic framework to enhance market-driven production to solve problems of market access and improve market linkages. Efforts were made to strengthen cooperatives, improve supply of market information systems, and reinforce participation of private sectors in agricultural marketing systems. However, private sector involvement was very slow and mainly in areas of high agricultural potential, and tended to serve mostly large-scale commercial farmers, leaving many smallholder farmers exposed to high transaction costs and market failures (Shiferaw et al., Citation2016). Although some producer organizations have made significant progress in improving income of their members through creating better market access and other services, many of them failed by attempting to take on too many objectives that ranged from collecting all kinds of commodities in diverse areas, to providing market information, agricultural extension and advocacy to their members.
Table 3. Summary statistics of marketing factors (dummy variables)
Table also indicated that 52.7% of sample households have access to market information while 47.3% of the respondents do not have access to market information. Jemal and Genet (Citation2019) explained that poor access to market information and lack of infrastructure facilities leads to erroneous price setting, high losses, and late product delivery in the marketplace.
8. Marketing system analysis
8.1. Market structure
8.1.1. Degree of market concentration
The most commonly used to measure the market competitiveness among traders is market concentration ratio. Market concentration ratio was computed as the ratio of the total quantity of vegetable purchased by the four large traders to the total quantity of vegetable purchased by traders during the marketing season. Market concentration ratio was computed for onion, tomato, and cabbage (Table ). Accordingly, the market concentration analysis results of the top four traders found to be 54.99%, 57.20%, and 51.49% for onion, tomato, and cabbage, respectively. According to “rule of thumb” recommended by Kohls and Uhl (Citation2002), the vegetable market in the study area was found to be strongly oligopolistic in which more than 50% of the vegetable was purchased by four biggest traders during the survey season. This implies that large volumes of vegetables were handled by few traders controlling the market and influencing the market prices on their benefits. This limits the chance of competitiveness among the vegetable traders and the larger traders may use their market power in abusive ways for their advantages. This finding corroborates with the finding of Dawit (Citation2016) who reported that the nature of vegetable markets at Meki and Atikilt Tera of Addis Ababa were strongly oligopolistic. This result is also in line with the finding of Endris et al. (Citation2020) who found that onion and tomato market structure was strongly oligopolistic in nature in Woldia and Mersa areas in North Wollo of Amhara region, Ethiopia. Similarly, Yohanes (Citation2015) who computed market concentration ratio for potato and cabbage market found that oligopolistic market structure for the commodities.
Table 4. Market concentration of selected vegetable traders
8.2. Marketing actors
Based on market structure analysis, the identified market actors were producers, brokers, wholesalers, retailers, street vendors, and processors. These marketing actors have different characteristics, market information access, and market relationship and obtain different marketing margins, profit margins, and profit shares.
Street vendors are becoming common both in Ethiopian pre-urban and urban areas. They purchase the vegetables at their price and location convenience. Street vendors are different from shop or shed retailers in their ultra-convenience in location, quantity, types, price, and product differentiation. They sort, grade and segregate the products based on their quality and quantity, targeting different customers with different purchasing powers. The shop retailers supply the products mixes with different quality levels while street vendors sell products with poor and better quality separately on the basis of the customer choice and decision. What makes street vending unique is that almost all of them are economically weak women and youths. It is becoming one of the income generation alternatives for those who are unable to rent shops and get shed from the government in job creation settings. According to a study conducted by Samarpitha (Citation2019), street vending is preferred as it needs low initial investment and considered as a business alternative to generate income for survival. The study also reported that people who faced difficulties in finding salaried jobs were engaged in street vending. Similarly, Mitullah (Citation2003) found that most street vendors start their street vending business because there is no other source of income and employment.
Processors are those who are engaged in preparing and selling ready-to-eat food from vegetables in the streets. They supply economically accessible foods for low income consumers. Processors became one of essential marketing actors in vegetable marketing. The study finding during observation and interviews with roadside food processors verified that tomato and potato were the two vegetable commodities that were cooked at roadside and supplied for consumers mixed with pepper powder and other pepper products as condiment. The location of processed food, freshness, speed of service, and its relative cheap price make the roadside processed food preferable by the users.
During interview with roadside processor, the interview participant reported the following:
… I started ready-to-eat processed food trading at roadside two years ago. The business idea was originated from my interest to open mini food grocery. However, it was unthinkable to get shed or rent shops due to my current financial situation. Thus, I decided to work at roadside, cooking some vegetables and sell adding value on them. After cooking potato, I peel it, mix with sliced tomato, and pepper powder (Mixmixa) or Data (local condiment prepared from fresh pepper) and provide for my customers. The amount and the costs vary according to the customers’ requests. It was challenging at the beginning phase; however, I have many customers at this time and happy with my job. The business became the means of income generation and my family’s survival (12 November 2022).
8.3. Barriers to entry to vegetable markets
8.3.1. License
The data collected from marketing agents, key informants through interviews and focus group discussions confirmed that brokers have no trade license. Most of the brokers in the study area were former producers who had better education status and awareness about vegetable business. In some cases, wholesalers even do not even have trade licenses where they informally handle vegetable products. Study by Negasi (Citation2016) similarly found that there are traders that do not have trade licenses but handle fruits and vegetables in North and Southern Wollo zones of Ethiopia. This shows that lack of strict regulation, and there is no strong measure taken against unlicensed traders. Thus, participating in vegetable trade in the study area is easy though it takes a few years for new entrants to develop their experiences and build their own networks to become competent in the market. According to Sebeta Hawas Trade and Market Development Office, there are no formal criteria for retailers and street vendors to have trade licenses, although they are expected to pay local tax on yearly basis. Brokers aim to play a facilitating role for vegetable marketing, although their role further hinders the process of marketing. There is no entry barrier for wholesale markets, however, the existing wholesalers take an advantage by absorbing the possible retailing clients using the long-term relations built. There is no entry barrier for retailers as well but the newcomers have limited marketing space.
8.3.2. Capital
Participants of interviews claimed that limited access to credit services is the major limiting factor to enter vegetable marketing business. A credit service is relatively available for big firms (wholesalers) from banks though the means and process are challenging and time taking. However, small traders have no opportunity of accessing financial services and this limits them to enter the vegetable market. Negasi (Citation2015) reported that an inadequate amount of credit service is provided for traders by banks. Similarly, a study by Moepeng (Citation2013) found that new entry in to horticulture production and marketing business was hindered by high start-up costs.
8.3.3. Experiences and business skills
Vegetable handling and marketing requires experiences and business skills. Interviews with traders revealed that experience is not a barrier to enter into vegetable market and entering into the business requires only an interest. Nevertheless, Tegegne et al. (Citation2018) suggested that sufficient knowledge and experience is essential to start a business and keep the business running. Similarly, Nmadu and Garba (Citation2013) reported that longer years of experience in farming increases the productivity and efficiency of agriculture because they can optimize the use of technologies, services, and inputs. This shows that traders run business without prior exposure to respective activities and face challenges in existence and making profits. It suggests intervention to facilitate business skill training for traders who are operating in vegetable markets to make vegetable profitable business ventures.
8.4. Quality standards and packaging
The producers and traders explained that the major quality criteria used for onion are size, shiny color, and moisture (dryness). Similarly, it was discussed that maturity stage, freeness from disease and insect damage, and shelf life history from varietal nature are the major criteria used to determine the quality of tomato. Producers differentiate tomato in to green mature and half-ripped and fully ripped. Half-ripped tomatoes are prepared for medium distance markets, and fully ripped tomatoes are sold at nearest local markets. Buyers need mature green tomato for long distance travel and prolonged shelf life. Besides, size of head, freeness from disease and insect attack are the criteria used to determine the quality of cabbage. In order to meet the quality demand of the traders, the smallholder producers undertake sorting and grading and failing to supply quality vegetable will have negative effect on the long term relation and trustworthiness between traders and the producers. Nevertheless, smallholder producers claimed that they face challenges to receive higher price for their quality vegetables due to misinformation received by wholesalers from brokers. Brokers misinform wholesale traders about the quality of the products and the proposed price to be paid for the products. This happens when the brokers encounter resistance by producers receiving the lower price offer for their products. This finding is in line with Schlippenbach and Teichmann (Citation2009) who reported that asymmetric information between buyers and sellers can lead to opportunistic behavior on the supply side where sellers of lower quality products may claim they are offering high quality produce. In this regard, the anticipation of the sellers’ behavior, in turn, may cause the buyers to make their purchase decisions based on the expected rather than the actual qualities of the product. The implication of poor communication by producers about the quality of their produce can cause high degree of uncertainty on buyer side, which in turn, results in lower price for high quality products.
Packaging materials are important components in differentiations and transportation of vegetables. Onions and cabbages are packed and transported in polypropylene bags having the carrying capacity of 100 kilograms. Tomato is transported using plastic crates, different sized baskets (kirchat) and wooden boxes that have the carrying capacity of 55–60 kilograms. However, there is the situation when onion and head cabbages are loaded on trucks without any kind of packaging materials. In this aspect, the brokers in alliance with traders take the advantages by cheating the quantity of vegetables loaded on the trucks. According to Hailegiorgis (Citation2011), most packaging materials used in Ethiopia do not meet the required standards. Non-standardized packaging materials, even sometimes, open trucks are used to transport vegetables from site of production to marketing location.
8.5. Market conduct analysis
8.5.1. Price setting and selling strategies
Focus group discussions participants and the key informants stated that producers do not have selling strategies except selling for buyers brought by brokers. In this regard, the farmers sell their vegetables to anyone as far as a better price is offered. The producers in the study area lack effective organization (cooperatives) to strengthen their bargaining power to negotiate with different market actors on price, quantity and quality, time, and means of product supply. As a result, farming and marketing activities are independently decided. This resulted in the less regulated production and marketing activities where traders have the power to decide prices based on their marginal marketing costs and expected profit margins. As it was indicated in Table , 78.4% of respondents replied that price is mainly set by brokers while producers’ contribution in price setting activity is insignificant. This finding is in line with the finding of Emana etal. (Citation2015) who reported that brokers and wholesalers are price setters in terminal markets and even refuse purchasing the harvested products. This result also corroborates with Tadesse (Citation2011) who found that about 42% of vegetable and fruit price in Ethiopia was decided by traders.
Table 5. Price setting strategies
8.6. Form of payment
Since contract farming and marketing are not practiced in the study area, payment is made in cash at the spot of selling and buying. There are the opportunities of medium and large-scale vegetable production in the study area as a large volume of vegetable is supplied to market in the study area. In this regard, it is possible to promote contract farming between producers and traders where they can work closely for mutual benefits. Contract farming can help producers to upgrade their knowledge and skills and produce quality products that can easily meet the required quality standards. Increasing the level of trust in product quality can help the producers to receive payment for their vegetables in other payment options like mobile banking when cash payment is impossible.
8.7. Traders’ behavior
The study results revealed that cheating the weight scale, providing misinformation about the market, and rejection of buying products are common behaviors of the traders claimed by the producers. Cheating is mainly conducted by wholesalers and brokers throughout the communication and selling processes. The perishable nature of vegetable is exposes smallholder producers for cheating and receiving lower prices. The focus group participants also claimed that price cheating by traders is a common phenomenon. Although the price in the capital city is higher for vegetables, the brokers falsely convince or even enforce producers to receive lower price for their products. This is done by brokers in favor of their own profit and to retain their relations with traders. Negasi (Citation2015) examined behavior of the fruits and vegetable traders and found that wholesalers and brokers cheated producers in giving lower prices, inappropriate weighing, and defaulting an agreement.
8.8. Market transparency
The study result revealed that smallholder producers in the study area obtain information from friends, brokers, farmers, and farmers’ cooperatives. The main market information types used by producers were vegetable selling price, input prices, potential buyers, quantity demanded by buyers, and means of produce supply. Traders get market information from brokers and other genuine traders or ultimate friends. The study result presented in Table indicated that 52.7% of sample households have access to market information while 47.3% of the respondents do not have access to market information. Adequate, timely, and reliable market information is vital for traders to make marketing decisions. However, the market information disseminated between traders and smallholder producers is not as valid as demanded by both parties. Study by Pandit et al. (Citation2019) reported that many smallholder farmers depend on traders and other farmers’ marketing information in the central region of Nepal. The study findings presented in Table showed that only 38.7% of the sample households received legitimate market information from different sources while the remaining 61.3% claimed that they did not receive legitimate market information. The smallholder producers criticized that brokers and wholesalers provide incorrect market information, particularly on price, quantity of vegetable required, and overall related marketing costs. Thus, it is difficult for smallholder producers to make the right decision while selling their vegetables to potential buyers. This implies that accessibility to market information alone is not enough to serve producers in selling their vegetables in effective ways, but it is essential to enhance reliable market information sources. Besides, brokers deceive wholesaler traders while setting prices and sabotage the process of marking between the two parties to gain higher income. Study by Jemal and Genet (Citation2019) reported that poor access to market information and lack of infrastructure facilities leads to erroneous price setting, high losses, and late product delivery in the market place. In accordance with this finding, Stiglitz (Citation2002) affirmed that adequate market information is vital for an efficient marketing system.
8.9. Market performance analysis
Different indicators are used to analyze marketing performance. Marketing channels, gross marketing margin, profit margin, and profit share were the indicators used in this study.
9. Marketing channels
9.1. Onion marketing channels
A total of 1543 tons of onion was supplied to market from the study area in the 2021/22 cropping season. The major marketing agents identified in onion marketing were producers, brokers, wholesalers, retailers, street vendors, and consumers. Eleven marketing channels were identified and the volume of onion supplied through the marketing channels was calculated to compare the individual channel performance (Table ). According to the identified channels, the largest volume (645 tons) which accounted for 41.8% of total volume was supplied to market through channel II while the smallest volume (31 tons) of onion was supplied to market through channel XI (Table ). This finding corroborates the finding of Negasi (Citation2015) who found that the vegetables and fruits sold through broker-wholesaler-retailers-consumers channels accounted for 83.5% and 82.5%, respectively. In contrast, a study conducted by Asale et al. (Citation2016) at Humbo Woreda of Wolaita Zone, Ethiopia stated that producers-brokers-wholesalers-retailers-consumers channel was the least frequent channel for onion which accounted about 1% of the total volume of onion in the chain. The involvement of brokers in onion marketing channels in the current study area is high, and the probability of producers to sell their onion directly to other market agents is very low. In addition, the volume of onion sold through producer-consumer channel (Channel XI) was very small which indicated that consumers have rare opportunity to buy onions directly from producers.
Table 6. Marketing channels of onion
Analysis of data collected through consumer interview was made and one of the interviews participants from Addis Ababa city reported the following:
… Nowadays, market situation, particularly vegetable prices become unstable. It is rapidly changing and it is even difficult to predict what will happen to the prices of vegetable commodities days after days. The prices expected by vegetable traders are high and the opportunity to buy vegetables directly from producers is limited. However, Addis Ababa city administration recently took the initiatives of linking urban consumers directly with producers by facilitating Sunday market. This opportunity was facilitated at selected locations in Addis Ababa close to the location of producers. It was appreciated by the city’s residents that they got chance to purchase fresh vegetables from producers; got relief from paying unfair price for traders and enjoyed the nature of the market. It is effective means of marketing for both consumers and producers and I suggest if the government can encourage such initiatives to minimize the burden of volatile vegetables prices (21 February 2022).
The above results revealed that majority of the consumers are the victims of inefficient marketing systems, which, in turn, resulted in volatile vegetables prices and uncertainties. Therefore, the government can help consumers, traders and producers to make better decisions by them through improving market information analysis and supply systems so that uncertainties will be reduced.
9.2. Tomato marketing channels
Major marketing agents involved in tomato marketing were producers, brokers, wholesalers, retailers, street vendors, and processors. Marketing channels through which tomato is supplied to end consumers were analyzed and thirteen marketing channels were identified (Table ). The total 859 tons of tomato was supplied to market from the study area in the 2021/22 cropping season. The result indicated that the largest volume (320 tons) of tomato which accounted for 37.25% of the total tomato marketed was supplied to market through channel II followed by channel V (123 tons) while the smallest volume (9 tons) of tomato was supplied through channel XIII (Table ). Therefore, channel II is the dominant channel in the study area while the smallest quantity of tomato is marketed through producers-consumers channel. This implies that producers in the study area have limited opportunities to supply their tomato directly to consumers. In contrast to this finding, Aliyi et al. (Citation2021) reported that producers-consumers channel is the second dominant marketing channel which carried 63 tons of tomato in the three studied districts of Jimma Zone in Ethiopia. The perishability nature of tomato, lack of storage, weak market linkage, and transportation facility force smallholders in the study area to sell bulk of their tomato through brokers at lower prices. This can be combated through investing in infrastructures like rural roads, feasible storage facilities, and strengthening institutional linkages between smallholders and other stakeholders participating in the tomato value chain.
Table 7. Marketing channels of tomato
Focus group discussion with producers affirmed that pick-your-own type of marketing was practiced by smallholder producers at the time of COVID-19 pandemic. Focus group discussion participants reply is presented as follows:
… In the early phase of COVID-19 pandemic, the fear of infection by the virus was very high. Movement of traders from urban to rural areas was limited and product flows from farm to market areas declined. Besides, as the buyers’ availability from urban areas declined, the prices of our vegetables reduced in a steady manner. In contrast, input access became a problem and the price of inputs increased radically. As supplies of fresh vegetables became limited in urban areas, some urban consumers started picking vegetable (lettuce and head cabbage) from farms for their own home consumption. In that situation, I was staying at the farm for longer hours to wait for customers and benefited from direct selling of my vegetables to consumers. The profit gains were better as compared to the profits I obtained other times when I sold my vegetables through intermediaries (23 & 24 November 2022).
The above results indicated that characteristics of vegetable markets were changed with the situation. This can be seen as opportunity and this kind of marketing mechanism can be promoted to help both consumers and producers being benefited from the process. Study conducted by Schreiber et al. (Citation2022) in Québec, Canada found that diverse strategies of crop marketing were adapted at the time of COVID-19 pandemic. The farmers in Québec collaborated with other farmers and responded to planning uncertainties through redistribution of the foods dedicated to previous customers. The study found that farmers were more flexible in adjusting existing market outlets or setting up new sales outlets. Producers met the supply demand for local food through adapting new sales outlets and online marketing tools like social media, online stores and virtual markets. In this regard, the study elaborated the role of government authorities in implementation of new infrastructure and programs to support farmers to address their challenges at the time of pandemic. The lesson that can be drawn from this study finding is that producers can adapt to uncertainties in the market and plan for diversified marketing outlets for their tomato. Policy makers in Ethiopia can design programs that possibly will empower smallholder producers to access potential consumers and enhance their profitability. Another study by Tripathi et al. (Citation2021) showed that the effective marketing alternative was applied in India at the time of COVID-19 pandemic. The findings indicated that buying behavior changed from visiting marketplace to more online transaction and home delivery services from the demand side. Logistic constraints affected the arrivals of vegetables from wholesalers’ side and producers preferred to supply their commodities through retail channels. On the other hand, direct marketing to minimize vegetable losses, help consumer get high quality produce at a reasonable price. The vegetables were aggregated at farm level and directly supplied to the city where the producers have the chance of selling their vegetable directly to consumers. The models used in India at the time of the lockdown were direct marketing by individual farmers and marketing through institutional support. This implies that promoting collective marketing through institutions (farmers’ cooperatives, produce originations) would help the producer to cope up with uncertainties and increase the benefits they obtain from their farming business.
9.3. Cabbage marketing channels
Ten marketing channels were identified and the volumes of cabbages supplied through the identified channels were calculated (Table ). Producers, brokers, wholesalers, retailers and street vendors were the major marketing agents involved in cabbage marketing. Comparing the identified channels in terms of volume of cabbage supplied, channel II is the leading channel where 635 tons (39.1%) of cabbage were supplied through it followed by channel V (271 tons) and the least volume of cabbage (26 tons; 1.6%) was supplied through channel X (Table ). This result corroborates Bukul et al. (Citation2018) who found that the largest volume (67.13%) of head cabbage is marketed through producers-collectors-wholesalers-retailers-consumers channel. However, according to a study conducted by Tadesse (Citation2011) producer-wholesalers-retailers-consumers channel is the leading marketing channel with the carrying volume of more than 25% of vegetables and fruits. Aliyi et al. (Citation2021) also found that the largest volume of cabbage was sold through producer-retailer-consumer channels with total volume 244.7 tons (31.32%). This study identified that producer-brokers-wholesalers-retailers-consumers channel is the dominant marketing channel for cabbage in the study area.
Table 8. Marketing channels of cabbage
10. Analysis of marketing margins and profit share
10.1. Onion marketing margins and share of profits at different marketing channels
Marketing margins among the onion marketing agents at different marketing channels were analyzed (Table ). The result showed that the highest (70%) total gross marketing margin (TGMM) was recorded in channel I and the lowest (47%) TGMM in channel IX. Excluding the situation observed in channel XI, producers obtained the highest gross marketing margin (53%) in the marketing channel IX while the lowest gross marketing margin (30%) was obtained in channel I. Comparing the gross marketing margin obtained among traders, the maximum gross marketing margin (56%) was obtained by retailers in channel VII followed by street vendors (53%) in channel VIII (Table ). Producers receive a higher share of gross marketing margin (53%) when they supply their onion directly to wholesalers with no intermediaries participating. However, when numbers of intermediaries are increased, the marketing margin obtained by producers is decreased as the intermediaries involved retain profit for their services whether they add value to the commodity or not. This finding is in agreement with Sharma (Citation2019) who found that the higher share of consumer price (75.3%) in the vegetable market was obtained by producers when they directly sell their vegetables to the users. Similar result was also found by Aliyi et al. (Citation2021) who reported that the highest share of marketing margin (44.4%) in the potato market was obtained by retailers followed by brokers (41%) while producers received a higher percentage share of margin when they directly supplied their potato to consumers.
Table 9. Onion gross marketing margin, profit margin and share of profit analysis
The profit share was calculated for 100 kg of onion in relation to costs incurred by marketing actors. Accordingly, the highest profit share of 39% was obtained by producers in channel IX and the lowest (7%) in channel II (Table ). Involvement of brokers in channel I, II, and III forced the producers to sell onion at relatively lower price and led to producers’ lowest profit share as compared to other channels. Wholesalers obtained the highest profit share (61%) in channel IX while the lowest profit share was obtained in channel I (31%). The highest profit share (66%) was obtained by retailers when they purchased onion directly from producers in channel VII and the lowest profit share (26%) in channel IV. Street vendors obtained the highest profit share (63%) in channel VIII where they purchased onion directly from producers and the lowest profit share (8%) in channel X. The result also indicated that the highest profit shares (66%) in onion marketing were obtained by retailers followed by street vendors (63%) (Table ). Despite retailers and street vendors handling small quantities of onion, 6.5 % and 3.8%, respectively, the two marketing actors took the largest profit shares in the marketing of onion when they purchased onions directly from producers. This result is in agreement with Sulumbe et al. (Citation2015) who reported that retailers earned more revenue than wholesalers per 50 kg of onion marketed. This result showed the presence of unfair shares of profits among the marketing agents and onion producers in the study area. The profit share of farmers decreased as the number of marketing agents in the marketing channels increased. This finding conforms to the finding of Chauhan and Singh (Citation1998) who found that the profit share of producers was extremely reduced with increased number of marketing intermediaries and suggested the need of market efficiency improvement through reducing the number of intermediaries.
10.2. Tomato marketing margin and profit shares at different marketing channels
The result of marketing margin analysis showed that the highest tomato total gross marketing margin (54%) was recorded at channel I and the lowest marketing margin (20%) in Channel X (Table ). The producers’ share in gross marketing margin was high (80%) in channel X while the lowest share (46%) recorded in channel I (Table ). The result indicated that an increased number of marketing agents resulted in lower marketing margin gains by producers. This result agrees with the finding of Aemro (Citation2018) who reported the presence of unfair marketing margin share distribution between tomato producers and the marketing agents. The result also conforms to the finding of Mandizvidza (Citation2017) who reported that tomato producers receive a small amount of consumers’ price as compared to the marketing agents’ share.
Table 10. Tomato gross marketing margin and share of profit
Profit share was also analyzed and presented for 100 kg of tomato based on marketing costs incurred by producers and marketing agents (Table ). Excluding the scenario of channel XIII, tomato producers received the highest profit share (51%) in channel X and the lowest share (2%) in channel I. The result indicated that the involvement of brokers in the tomato marketing channel I highly affected the profit share of producers. Comparing the profit shares received by marketing agents, the highest profit share (72%) was received by street vendors in channel XII, retailers (66%) in channel XI, wholesalers (49%) in channel X, and processors (59%) in channel VI (Table ). Overall results showed that the traders received higher profit share though involved costs by them were relatively low as compared to that of producers. This finding corroborates a report of Aliyi et al. (Citation2021) who found that farmers received the relative average smallest share of profit (21%) in the identified tomato marketing channels except in cases when farmers sell their tomato directly to the consumers. The result is also in agreement with Eticha (Citation2017) who found that producers who do all activities of tomato production, associated with risks, got lower profit margins (38.94%) while traders got the highest profit (61.04%) with the lowest operation cost.
10.3. Cabbage gross marketing margins and profit share at different marketing channels
As indicated in Table , marketing margins of specific marketing agents in different cabbage marketing channels were computed. The result showed that the highest (61%) total gross marketing margin (TGMM) was recorded in channel I and the lowest (25%) in channel VII. Producers’ highest gross marketing margin (75%) was attained in channel VII while the lowest (39%) in channel I (Table ). Comparing the marketing margins gained by marketing agents in cabbage marketing channels, retailers attained the largest share (29%) of marketing margin in channel III followed by street vendors (28%) in channel IX (Table ). This result conforms to Phuu (Citation2016) who found that retailers attained the higher marketing margin as compared to wholesalers. The results of the study showed disparity in marketing margin share though value addition requirements for cabbage is low at retailers’ level.
Table 11. Cabbage gross marketing margin, and share of profit
On the other hand, the profit shares of each marketing agent in cabbage marketing channels were calculated (Table ). Accordingly, cabbage producers attained the largest profit share (61%) in channel VII followed by channel IX (57%). Similarly, wholesalers, retailers, and street vendors got the highest profit share in channel VII (39%), VIII (47%), and IX (43%), respectively, when they bought cabbage directly from producers. The traders obtained the lowest profit shares in channel I where wholesalers and retailers obtained 18% and 11% profit shares, respectively. Likewise, street vendors gained the lowest (28) profit share in channel VI where relatively fair profit was shared between producers and marketing agents. This shows that farmers and traders relatively got higher profit shares when cabbage is marketed directly without involvement of other intermediaries. The result indicated that producers obtain lower/unfair shares when the market channel is longer. This result conforms to the findings of Aliyi et al. (Citation2021) who reported that producers gained the lowest (23%) profit share in producer-collector-wholesalers-retailers-consumers channel and highest (52%) in producer-wholesalers-consumers channel.
11. Conclusions and recommendations
This study analyzed vegetable production status and marketing system in Sebeta Hawas Woreda, Oromia region, Ethiopia. The analysis of vegetable production status results indicated that vegetables production under irrigation accounted for 331.58 ha out of the total 376.8 ha land allocated to vegetable production. This indicates that vegetable production in the study area is mainly undertaken under irrigation conditions. In terms of total outputs (volume of production), cabbage, onion, and tomato contributed 67.7% of the total vegetables produced in the study area in 2021/22 cropping season indicating that cabbage, onion, and tomato were the top three vegetable crops dominantly grown in the study area. The study result also revealed that the productivity of vegetables studied in the study area was higher when compared to national average productivity. The analysis of the benefit-cost ratio indicated that vegetable production, cabbage, onion and tomato in particular, were economically feasible with respect to the costs of production, with tomato being the most profitable. There are huge water and land resources suitable for diversified vegetable crops production in the study area. In spite of its profitability and huge resource availability, the status of vegetable production in terms of the total land allocated to vegetable production requires comprehensive intervention. The study further identified production and marketing constraints faced by smallholder producers. Lack of storage facilities, limited access to inputs like improved seeds, fertilizers and pesticides were factors influencing the capacity of vegetable producers. Furthermore, limited access to market, lack of legitimate marketing information, high involvement and hindering role of brokers, lack of market regulation, and absence of efficient institutions like farmers’ cooperatives were the major marketing constraints faced by the producers. Market structure analysis result showed that major market actors in the vegetable marketing were producers, brokers, wholesalers, retailers, street vendors, and processors. The result of market structure analysis also revealed that market structure for onion, tomato, and cabbage was a strong oligopolistic market. This indicates that few traders have control over marketing of vegetables in the study area. The market conduct analysis result indicated that marketing activities of vegetables are less regulated, producers supply their produce in an unorganized manner, and traders have power in setting price based on their marginal marketing costs and expected profit margins. There are weak market accesses and market information services that resulted in large price and benefit share disparities among market actors. Although the majority of the smallholder producers have access to market information, the information received by the smallholders from different sources was not reliable. Market performance analysis result revealed the dominant marketing channel for onion, tomato, and cabbage was “producer → broker → wholesaler → Retailer → consumers” channel. In the identified marketing channels, profit margin distribution varies across marketing channels and smallholder producers receive a small share though the costs incurred by smallholders are higher as compared to traders. Smallholder producers obtain a higher profit share when they sell their vegetables directly to consumers. Overall, the lion’s share of marketing profit was received by traders as indicative of inefficient vegetable marketing and thus poor operation of the marketing system.
Based on the study’s findings, the following recommendations were forwarded to improve profitability of vegetable production and marketing systems. As the study result indicates, only about 35% of the total land available in the study area was allocated to vegetable production. Thus, there is a need for intervention by the government to promote expansion of vegetable production, strengthen the extension services, facilitate credit services, institutionalize agricultural technology transfer, and encourage research works. Establishing effective farmers’ organizations is also recommended so that smallholder farmers are linked to retail markets, their bargaining power in price setting is strengthened, and their income is enhanced. It is also suggested that agricultural research institutes and universities would work towards advancing irrigation systems, innovating farm management practices, increasing availability and accessibility of improved inputs, and creating marketing alternatives for smallholder farmers. This can encourage young generations to become agro-entrepreneurs in the vegetable sector. Agro-tech companies, agro-chemical companies, and private seed producers can also support smallholder productivity by supplying cost effective and efficient irrigation equipment, providing improved seeds, chemical fertilizers, pesticides, insecticides, and herbicides. Non-governmental organizations can also provide tailored training for smallholder producers to improve their knowledge and skills in productions of vegetables, postharvest management, and marketing. It is also suggested that traders can support smallholder producers through proving loans and facilitating contract farming and marketing to offer reasonable prices for their vegetables. Banks, credit and saving institutions can also empower smallholders by providing credit services which in turn can enhance their financial capacity to purchase inputs and pay for their farm operation costs. Smallholder producers need to search for and use reliable market information, practice collective marketing, and use the potential opportunity of contract farming to minimize the possibility of being exploited by market intermediaries.
In order to upgrade the vegetable marketing system, it is suggested that the government can adapt public markets equipped with partitioned storage cabinets where smallholder farmers can keep their produce and sell directly to potential consumers so that they can take the advantages of better prices in the markets. It is also essential to enhance production and marketing management skills of smallholder producers and other marketing agents to minimize production and marketing costs thus maximize revenues from vegetable production and marketing. This can be done by the trade and market development office (TMDO) and other responsible stakeholders by providing trainings to change the inefficient market performance. Further, the government ought to develop, implement, and promote a functioning market information system to strengthen the bargaining power of smallholder farmers so that they can increase their benefit shares of consumer price. This can be done by Agriculture and natural resource office (ANRO) and market development office (TMDO) through facilitation of reliable market information dissemination means like TV, radio, mobile applications, and short text messages to reduce the hindering role of brokers in price setting, market information and producers’ choice of market outlets. The government can also design policy that promotes direct marketing to link smallholders to urban consumers. This can be done by strengthening the new initiative of Sunday market at market places facilitated by Addis Ababa city administration. This experience should be promoted to expand it to other cities. To change strong oligopolistic market structure and inefficient and poor operation of the marketing system in the study area, local and regional administration can enforce market regulation policy that can create a competitive market environment for all potential actors. Overall, there is a need for policy makers’ involvement to combat the major problems identified in vegetable production and marketing so that vegetables can keep on providing employment opportunities, generating incomes, and improving food security.
Correction
This article has been corrected with minor changes. These changes do not impact the academic content of the article.
About the Authors.docx
Download MS Word (19.7 KB)Disclosure statement
There is no conflict of interest reported by the author(s).
Data availability statement
Data can be made available based on reasonable request
Supplementary material
Supplemental data for this article can be accessed online at https://doi.org/10.1080/23311932.2023.2286047
Additional information
Funding
Notes on contributors
Asfaw Shaka Gosa
Asfaw Shaka is PhD student at College of Development Studies, Center for Food Security Studies, Addis Ababa University, Ethiopia. He is a Lecturer, researcher and a consultant. His areas of research focus include agribusiness and value chains, food and nutrition security, farm management, climate change and sustainability.
Tebarek Lika Megento
Tebarek Lika (PhD) is an academic staff member of the Department of Geography and Environmental Studies at Addis Ababa University, Ethiopia. He is lecturer and researcher in the same university. His research focus includes agricultural value chain, livelihood, climate change, poverty, and food security.
Meskerem Abi Teka
Meskerem Abi is an Assistant Professor at the Centre for Food Security Studies in the College of Development Studies, Addis Ababa University, Ethiopia. Her research and teaching areas focus on food security, right to food and social protection, sustainable land management, sustainable agriculture, climate change and variability, vulnerability and resilience, social capital, farmers’ knowledge and strategies, institution, and policy.
References
- Abay, A. (2010). Market chain analysis of red pepper: the case of Bure woreda, west Gojjam zone, Amhara National Regional State, Ethiopia [ Doctoral dissertation]. Haramaya University. https://cgspace.cgiar.org/handle/10568/3023
- Abduali, J., Nimoh, F., Darko-Koomson, S., & Kassoh, K. F. S. (2017). Performance of vegetable production and marketing in peri-urban Kumasi, Ghana. Journal of Agricultural Science, 9(3), 202–32. https://doi.org/10.5539/jas.v9n3p202
- Addisu, H. (2016). Value Chain Analysis of Vegetables: the Case of Ejere Woreda, West Shoa Zone, Oromia National Regional State of Ethiopia [ MSc. Thesis]. Presented in Haramaya University.
- Adugna, D. (2021). Marketing analysis of onion: The case of Fentalle Woreda, East Shoa Zone, Oromia National Regional State, Ethiopia. Asian Journal of Plant Science and Research, 11(2), 65–72.
- Aemro, W. A. (2018). Vegetable market chain analysis in Mecha Woreda, West Gojjam Zone, Amhara National Regional State. Archives of Current Research International, 15(4), 1–12. https://doi.org/10.9734/ACRI/2018/45840
- Aliyi, I., Faris, A., Ayele, A., Oljirra, A., & Bayessa, M. (2021). Profitability and market performance of smallholder vegetable production: Evidence from Ethiopia. Heliyon, 7(9), e08008. https://doi.org/10.1016/j.heliyon.2021.e08008
- Asale, A., W/Yhanes, D., & Buke, T. (2016). Onion market chain analysis in Humbo District, Wolaita Zone, Southern Ethiopia. International Journal of Scientific Research & Engineering Trends, 2(1), 6–16.
- Ayoola, J. B. (2014). Comparative economic analysis of tomato (lycopersicon esculenta) under irrigation and rain-fed system in selected local government areas of Kogi and Benu States, Nigeria. Journal of Development and Agricultural Economics, 6(11), 466–471. https://doi.org/10.5897/JDAE2013.0572
- Banchamlak, H., & Akalu, T. (2022). Vegetable market supply by farmers in Ethiopia. Cogent Social Sciences, 8(1), 2057058. https://doi.org/10.1080/23311886.2022.2057058
- Banjaw, T. D. (2017). Review of postharvest loss of horticultural crops in Ethiopia: Its causes and mitigation strategies. Journal of Plant Sciences and Agriculture Research, 2(1), 006.
- Bashargo, G., & Srinivasa, G. M. (2002). Cattle Marketing in Western Shoa, Doctoral Dissertation. Haramaya University,
- Bukul, B. B., Ahmed, Y. E., & Senbeta, A. N. (2018). Analysis of head cabbage market performance in Kofele and kore districts, Oromia region, Ethiopia. Journal of Marketing and Current Research, 3.
- Central Statistical Agency (CSA). (2020). The Federal Democratic Republic of Ethiopia, Central Statistical Agency, Agricultural sample survey, report on area and production of major crops Statistical Bulletin 2019/2020.
- Chauhan, R. S., & Singh, J. N. (1998). Vegetable marketing system in Azamgarh District of Uttar Pradesh. Indian Journal of Agricultural Economics, 53(3), 413.
- Chowdhuri, N. Y., Haque, S., Shammi, S. A., Jannat, A., & Sannyashi, P. R. (2014). Profitability analysis of winter vegetables production in a selected area of Narshingdi District in Bangladesh. Progressive Agriculture, 25, 47–53. https://doi.org/10.3329/pa.v25i0.24080
- Dawit, S. (2016). Structure and performance of vegetable marketing in East Shoa Zone, Oromia region, Ethiopia. Journal of Marketing and Current Research, 26, 7–16. .
- Debertin, D. L. (Ed.). (1992). Agricultural production Economics (2nd ed.). KY.
- Emana, B. (2008). Value Chain Analysis of Horticultural Crops in Kombolcha Woreda of Eastern Oromia Region, Ethiopia. A study conducted for Action Aid Ethiopia, Addis Ababa.
- Emana, B., Afari-Sefa, V., Dinssa, F. F., Ayana, A., Balemi, T., & Temesgen, M. (2015). Characterizationand assessment of vegetable production and mar-keting systems in the humid tropics of Ethiopia. Quarterly Journal of International Agriculture, 54(2), 163–187.
- Endris, E., Haji, J., & Tegegne, B. (2020). Analysis of vegetables marketing performance in case of Habru District, North Wollo Zone, Ethiopia. Journal of Marketing and Consumer Research, 6(1), 1–9. https://doi.org/10.11648/j.ebm.20200601.11
- Eticha, M. D. (2017). Value chain analysis of Tomato in Kersa District of Oromia, South Western Ethiopia [ Unpublished MSc. thesis]. Jima University.
- FAOSTAT. (2021). Value of Agricultural Production, Food and Agricultural Organization of United Nations. Retrieved October 31, 2022, from www.fao.org/faostat/en/#data/QV.
- Food Outlook. (2018). Global market analysis. https://www.fao.org/family-farming/data-sources/dataportrait/farm-size/en.
- Getachew, L., & Mohammed, H. (2012,). In Oxfam America, Horn of Africa Regional Office (HARO), Addis Ababa, Ethiopia. Unpublished.
- Gollin, D. (2010). Agricultural productivity and economic growth. Handbook of Agricultural Economics, 4, 3825–3866.
- Hailegiorgis, D. S., (2011). Analysis of Fruits and Vegetables Profitability and Value Chain: The Case Study on Et Fruit, Ethiopia [ Unpublished MSc. thesis]. Addis Ababa University.
- Hailu, G., Tsadik, K. W., & Tana, T. (2015). Evaluation of tomato (lycopersicon esculentum mill) and maize (Zea mays L.) intercropping system for profitability of the crops in Wolaita Zone, Southern Ethiopia. Journal of Biology, Agriculture and Healthcare, 5(1), 132–140.
- Haji, J. (2008). Economic efficiency and marketing performance of vegetable production in the Eastern and Central parts of Ethiopia, no. 17.
- Hanadi, E. A., Mohammed, I. M., & Salih, E. E. (2018). Value chain analysis for tomato production and marketing in Khatoum state. Sudan Current Investigation in Agriculture and Current Research, 5(4), 651–657. https://doi.org/10.32474/CIACR.2018.05.000219
- Hanekom, J. W., Willemse, B. J., & Strydom, D. B.(2010). Structure, conduct and performance in the South African potato processing industry (no. 308-2016-5032).
- Hussain, A., Farooq, S. U., & Khan, K. U. (2012). Aggressiveness and conservativeness of working capital: A case of Pakistani manufacturing sector. European Journal of Scientific Research, 73(2), 171–182.
- Jemal, M., & Genet, G. T. (2019). Assessing factors affecting marketing of vegetable product: The case of qewet Woreda, Ethiopia. Journal of Business and Management, 21(4), 82–93.
- Kohls, R. L., & Uhl, J. N. (2002). Marketing of Agricultural products, 9. Prentice-Hall Inc.
- Kothari, C. R. (2004). Research methodology: Methods and techniques (2nd ed.). New Age International.
- Legesse, G., Hassana, M., Gudisa, R., & Koji, T. (2014, July 16-19). Value chain Assessment of selected vegetable products in Central Rift Valley of Ethiopia! [Paper Presentation]. International Conference on Ethiopian Economy, Ethiopian Economic Association, Addis Ababa.
- Lessley, B. V., Johnson, D. M., & Hanson, J. C. (1991). Cost and revenue consideration in farm management decision making, Maryland Cooperative Extension, fact sheet. Brain Research, 546(1), 1–7. https://doi.org/10.1016/0006-8993(91)91152-q
- Madisa, M. E., Assefa, Y., & Obopile, M. (2010). Assessment of production constraints, crop and pest management practices in Peri-urban vegetable farms of Botswana. Egypt Academic Journal of Biological Science, 1(1), 1–11. https://doi.org/10.21608/eajbsh.2010.17011
- Mahmood, I., Hassan, S., Bashir, A., Qasim, M., & Ahmed, N. (2017). Profitability analysis of carrot production in selected districts of Punjab, Pakistan: An empirical investigation. Journal of Environment and Biological Science, 7(2), 188–193.
- Mandizvidza, K. (2017). Analyzing marketing margins and the direction of price flow in the tomato value chain of Limpopo province, South Africa. International Journal of Environment and Agricultural Research, 3(3), 72–82. 2454-1850.
- Mdoda, L., Obi, A., Christian, M., & Jiba, P. (2022). Profitability of cabbage production by smallholder farmers in the Eastern Cape Province, South Africa. South African Journal of Agricultural Extension, 50(2), 1–25. https://doi.org/10.17159/2413-3221/2022/v50n2a11214
- Mendoza, G. (1995). A primer on marketing channels and margins. Prices, products, and people: Analyzing Agricultural markets in developing countries. International Potato Center.
- Mitullah, W. V. (2003). Street vending in African cities: A synthesis of empirical finding from Kenya, Cote d'Ivoire, Ghana, Zimbabwe, Uganda and South Africa.
- Moepeng, P. (2013). Core economic issues in the horticulture sector of Botswana, Working Paper No.55. University of Queensland.
- Mukaila, R., Obetta, A. E., Awoyelu, F. E., Chiemela, C. J., & Ugwu, A. O. (2021). Marketing analysis of vegetables: The case of carrot and cucumber marketing in Enugu State, Nigeria. Turkish Journal of Agriculture - Food Science & Technology, 9(2), 346–351. https://doi.org/10.24925/turjaf.v9i2.346-351.4000
- Mussema, R., Kassa, B., Alemu, D., & Rashid, S. (2013). Analysis of the determinants of small-scale farmers’ grain market participations in Ethiopia: The contribution of transaction costs. Ethiopian Journal of Agricultural Sciences, 23(12), 75–94.
- Negasi, M. Y. (2016). Marketing system analysis of vegetables and fruits in Amhara Regional states: Survey evidence from Raya Kobo and Harbu Woredas. Ethiopian Journal of Economics, 24(2), 2–38.
- Nmadu, J. N., & Garba, S. A. (2013). Profit efficiency of smallholder spinach producers under irrigated agriculture in Niger State, Nigeria. International Journal of Trends in Economics Management and Technology, 2(6), 1–6.
- Oladimeji, Y. U., & Zakari, A. (2014). An Economic analysis of dry season irrigated farming in Asa River, Kwara State, Nigeria: Implications for poverty reduction. Journal of Sustainable Development in Africa, 6(7), 1–15.
- Olowo, S. F., Omotaya, A. O., Lawal, I. O., & Aremu, A. O. (2022). Improving rural livelihoo through the cultivation of indigeneus fruits and vegetables: Evidence from Ondo State, Nigeria. Agriculture, 12(3), 1–20. https://doi.org/10.3390/agriculture12030372
- Onuwa, G. C., Emanuel, B. A., Eshimutu, U., Fatoke, V., & Birma, J. (2021). Cost-Benefit Analysis of Cucumber Production Under Irrigation Management, 7(7), 23–31.
- Oromia Finance and Economic Development Bureau (OFEDB). (2015). Physical and socio-Economic profile of Sebeta Hawas Woreda.
- Pandit, S. S., John, K. M., Kuwornu, A. D., Yaseen, M. & Anal, A. K. (2019). Of marketing information sources among smallholder vegetable farmers. International Journal of Vegetable Science, 26(1), 96–105. https://doi.org/10.1080/19315260.2019.1609148
- Pender, J., Ruben, R., Jabbar, M., & Eleni, G. M. (2004, February 19-20). Policies for improved land management and agricultural land management and agricultural market development in the Ethiopian highlands. Summary of papers and proceeding s of a workshop help at Hilton Hotel, [Paper presentation], Addis Ababa, Ethiopia.
- Phuu, Z. (2016). Analysis of structure, conduct and market performance of cabbage marketing in central District of Botswana [ Unpublished master thesis]. Nairobi University.
- Pingali, P. L. (2010). Agricultural renaisence: Making “Agriculture for Development” work in the 21st Century. Handbook of Agricultural Economics, 4, 3867–3894.
- Population Projection. (2022). Sebeta hawas district population statistics (projection). https://www.citypopulation.de/en/ethiopia/admin/oromia/ET042006_sebeta_hawas/
- Rahiel, H. A., Abraha, K. Z., & Gebreslassie, W. L. (2018). Assessment of production potential and postharvest losses of fruits and vegetables in northern region of Ethiopia. Agriculture & Food Security, 7(1), 1–13. https://doi.org/10.1186/s40066-018-0181-5
- Rehima, M. (2006). Analysis of red pepper marketing: The case of Alaba and Siltie in SNNPRS of Ethiopia [ Unpublished MSc. Thesis]. Haramaya University.
- Samarpitha, A. (2019). Fruit and Vegetable Street Vendors in Urban Inform Sector in Hyderabad, India. International Journal of Current Microbiology and Applied Sciences, 8(11), 967–973. https://doi.org/10.20546/ijcmas.2019.811.113
- Schlippenbach, V. V., & Teichmann, I. (2009). Quality standards for fruits and vegetables: Help or hindrance for rural development?. German Institute for Economic Research, 5(21), 145–157.
- Schreiber, K., Soubrey, B., Dove McFalls, C., & MacDonald, G. K. (2022). Diverse adaptation strategies helped local food producers cope with initial challenges of the COVID-19 pandemic: Lessons from Québec, Canada. Journal of Rural Studies, 90, 124–133. https://doi.org/10.1016/j.jrurstud.2022.02.002
- Schreinemachers, P., Simmons, E. B., & Wopereis, M. C. S. (2018). Tapping the economic and nutrition power of vegetables. Global Food Security, 16, 36–45. https://doi.org/10.1016/j.gfs.2017.09.005
- Sharma, M. (2019). Value Chain Analysis and marketing performance of vegetable subsector: A case of Sindupalchowk District, Nepal. International Journal of Applied Sciences and Biotechnology, 7(4), 453–458.
- Shiferaw, B., Hellin, J., & Muricho, G. (2016). Markets access and Agricultural productivity growth in developing countries: Challenges and opportunities for producer organizations. In J. Bijman, R. Muradian, & J. Schuurman (Eds.), Economic Democratization, inclusiveness and social capital (p. 103122). Edward Elgar Publishing. https://doi.org/10.4337/9781784719388.00013
- Stiglitz, J. E. (2002). Information and the change in the paradigm in economics. American Economic Review, 92(3), 460–501. https://doi.org/10.1257/00028280260136363
- Sulumbe, I. M., Shettima, B. G., & John, T. B. (2015). An analysis of marketing of onion in Monguno local government area of Borno State, Nigeria. Journal of Marketing and Current Research, 13 ,9–13. .
- Tabor, G., Alemu, Y., Ketema, S., Yesuf, M., & Ayalew, G. (2015). Vegetable crops Research in Ethiopia: Achievements and future prospects, Ethiopian Institute of Agricultural Research, Conference paper, Addis Ababa, Ethiopia (pp. 123–131).
- Tadesse, A. (2011). Market Chain Analysis of Fruits for Gomma Woreda, Jimma Zone, Oromia National Regional State [ Unpublished MSc. thesis]. Haramaya University.
- Tahir, A., & Altaf, Z. (2013). Determinants of income from vegetables production: A comparative study of normal and off-season vegetables in Abbottabad. Pakistan. Journal of Agricultural Research, 26(1), 24–31.
- Tegegne, B., Goshme Mekuria, D., & Zemedu, L. (2018). Analysis of Sesame Market Chain: The Case of Melokoza District, Gamo Gofa Zone, SNNPRS, Ethiopia [ Unpublished doctoral dissertation]. Haramaya University.
- Tripathi, A., Bharti, N., Sardar, S., & Malik, S. (2021). Covid-19, disrupted vegetable supply chain and direct marketing: Experiences from India. Journal of Agribusiness in Developing and Emerging Economies, 13(1), 1–15. https://doi.org/10.1108/JADEE-04-2021-0095
- Wongnaa, C. A., Awunyo-Vitor, D., Mensah, A., & Adams, F. (2019). Profit efficiency among maize farmers and implications for poverty alleviation and food security in Ghana. Science Africa, 6, e00206. https://doi.org/10.1016/j.sciaf.2019.e00206
- World Bank.(2008). Agriculture for development. World Development Report 2008.
- Yohanes, M. (2015). Performance of Vegetable Market: The Case of Kombolcha District, East Hararghe Zone of Oromia National Regional State, Ethiopia. [Unpublished MSc. Thesis]. Haramaya University. Haramaya.