
 ?Mathematical formulae have been encoded as MathML and are displayed in this HTML version using MathJax in order to improve their display. Uncheck the box to turn MathJax off. This feature requires Javascript. Click on a formula to zoom.
Abstract
This study determined the most effective plating density (PD) and nitrogen (N) fertilizer rate for well-adapted BH540 medium-maturing maize cultivars for current climate condition in north west Ethiopia midlands. The Decision Support System for Agrotechnology Transfer (DSSAT)-Crop Environment Resource Synthesis (CERES)-Maize model has been utilized to determine the appropriate PD and N-fertilizer rate. An experimental study of PD (55,555, 62500, and 76,900 plants ha−1) and N (138, 207, and 276 kg N ha−1) levels was conducted for 3 years at 4 distinct sites. The DSSAT-CERES-Maize model was calibrated using climate data from 1987 to 2018, physicochemical soil profiling data (wilting point, field capacity, saturation, saturated hydraulic conductivity, root growth factor, bulk density, soil texture, organic carbon, total nitrogen; and soil pH), and agronomic management data from the experiment. After calibration, the DSSAT-CERES-Maize model was able to simulate the phenology and growth parameters of maize in the evaluation data set. The results from analysis of variance revealed that the maximum observed and simulated grain yield, biomass, and leaf area index were recorded from 276 kg N ha−1 and 76,900 plants ha−1 for the BH540 maize variety under the current climate condition. The application of 76,900 plants ha−1 combined with 276 kg N ha−1 significantly increased observed and simulated yield by 25% and 15%, respectively, compared with recommendation. Finally, future research on different N and PD levels in various agroecological zones with different varieties of mature maize types could be conducted for the current and future climate periods.
PUBLIC INTEREST STATEMENT
Maize is the most essential food security cereal crop in the world, followed by wheat and rice. It accounts about 60% of global human consumption, livestock feed and raw materials for industrial purposes. Maize has profound effects on the livelihoods of millions of people in sub-Saharan Africa (SSA). It can be widely grown crop in various agroecological zones and seasons throughout all of Ethiopia’s peripheries. However, the average maize productivity is very low as compared to the global average due to climate condition and inappropriate agronomic management practices. The optimum planting density and nitrogen fertilizer levels can significantly improve the yield of maize. For this reason, planting density and nitrogen fertilizer levels for the current climate period have been optimized by help of decision support tools. Therefore, farmers have to be motivated to adopt these findings with strong confidence to increase maize productivity on the Northwest Ethiopian midlands and similar agroecological zones.
1. Introduction
Maize (Zea mays L.) is the most essential food security cereal crop in the world, followed by wheat and rice (Yarnell, Citation2008). Similarly, among the main cereal crops grown in Ethiopia, maize is the most productive and comes in second in terms of production area behind teff (Eragrostis tef (Zuccagni) Trotter). Although it is a widely grown crop in a variety of agroecological zones and can be grown successfully in various seasons throughout all of Ethiopia’s peripheries (Aman & Dawid, Citation2020), the average maize productivity is only 3 tones ha−1, which is low when compared to the global average of 5.6 tones ha−1 (Abate et al., Citation2015). This is due to a number of factors, like climate change, declining soil fertility, limited input use, insufficient technology, poor seed quality, infestations of pests and diseases, and inappropriate agronomic management practices.
In particular, nitrogen fertilization and planting density and maize varieties in agronomic management practices are the three widely used practices that can interactively affect the grain yield of maize in smallholder maize farming (Teshome et al., Citation2021). Moreover, the optimizing planting density and N-fertilize level for medium-maturing maize types are among the most widely studied strategies of adapting to climate change (Xu et al., Citation2021). Meng et al. (Citation2022) was also concluded that high-density planting and the proper application of N fertilizer can significantly improve the light energy efficiency and yield of maize. Jiang et al. (Citation2021) demonstrated that optimizing agronomic crop management practices would assist to make policy development on mitigating the negative impacts climate change on maize production. However, the majority of studies on optimizing planting density and N-fertilize levels for specific maturing maize varieties did not take climate change into consideration in our study area. Despite seasonal and climatic variations, the recommended amounts of 69–207 kg N ha−1 for 44,444 to 62,500 plant ha−1 have not yet changed. Currently, the majority of farmers and the private sector in the study area frequently use more nitrogen fertilizer than is recommended to increase maize yield. However, more fertilization often results in low N utilization efficiency as well as adverse impacts on the environment and human health (Ren et al., Citation2020). Optimal planting density helps to limit the environmental consequences brought on by excessive N fertilizers because of the canopy’s capacity to absorb nutrients and water (Zhang et al., Citation2021). Therefore, increasing N-fertilizer along with planting density may be able to overcome these issues.
The various approaches and different methods have been used to integrate management of N fertilizer input and the planting density (Xu et al., Citation2021). Most of these were generated from the spatial field experimental data collected at a specific location in our study area. However, these approaches are traditional, and the findings are seasonal, site-specific, laborious, and expensive. Further, the recommendations may not be applicable elsewhere due to diverse environments, soils, and seasons. Thus, these recommendations, combined with farmers’ local practices should be evaluated using decision support tools (DSTs) to determine the appropriate planting density and N-fertilize levels for the current climate period.
The use of decision support tools (DSTs) may improve these approaches by simultaneously capturing variation caused by season, soil, crops, and climate for long-term sustainable productivity (Ren et al., Citation2020). These tools included crop simulation models that were capable of forecasting crop productivity under various crop management options for current and future climate conditions. The DSSAT-CERES-maize model, in particular, is the most relevant for this study since it is the most widely used crop-weather model in the world and is frequently used to determine the optimal planting density and N fertilizer rate for maize growth and yield (Hoogenboom et al., Citation2019). We used detailed data on the soil profile, maize crop management, and 32-year climate for model calibration and evaluation in the study area. Thus, the objectives of this study were to optimize planting density and nitrogen fertilizer levels for maize production under current climate condition in northwest Ethiopia midlands.
2. Methodology
2.1. Description of the experimental area
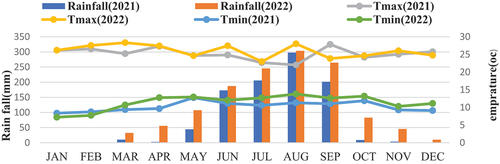
The experiments were conducted at the four experimental sites of Ambomesk, Kudime, Tekeldeb, and Anedent in the Mecha area of the Northwest Ethiopian Midlands in the years 2020, 2021, and 2022 (Figure ). Geographically, it is found at 11° 41’06“latitude and 37° 16’ 37” longitude. The area’s average elevation is 2000 m above sea level. The mean annual rainfall was 1603.3 mm, and the mean minimum and maximum temperatures were 12.3°C and 26.7°C, respectively (Figure ). The experiments were conducted near irrigation facilities so as to maintain optimum moisture by irrigating when the soil moisture was below field capacity. The soils in the district have a clay texture, are inherently medium in natural fertility, and have a high moisture retention capacity. The predominant soil is deep and has a red-brown color (Nitosols).
Figure 1. Location map of study locations.
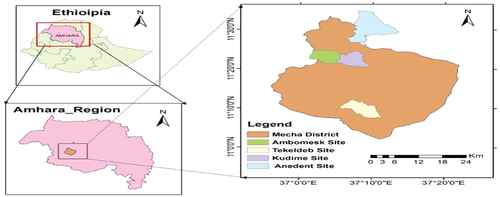
Figure 2. Mean monthly rainfall (RF), mean monthly maximum and minimum temperatures of the study area for two years from 2020–2022.
2.2. Experimental treatments, design and proceture
Treatments consist of three rates of nitrogen (138, 207, and 276 kg N ha−1) and three maize planting densities (55,555, 62,500, and 76,900 plants ha−1) (Table ). We obtain 138 and 207 kg N ha−1 and 55,555 and 62,500 plants ha−1 from recommendations, whereas 276 kg N ha−1 and 76,900 plants ha−1 are obtained via farm practices. The experiment has been laid out in a randomized complete block design (RCBD) with three replications. The medium-maturing maize variety BH540 which is well adapted to the agroecology of the study area, has been used as an experimental material. Every year of the experiment, the experimental field was prepared before planting using the conventional tillage method. The land had to be flattened by hand. Bunds and ditches were constructed for each replication and the entire experimental field. The net plot size of each experimental plot was 5 m in length by 4 m in width (20 m2). Blocks were separated from each other by 1 m, while experimental plots within each other were separated by 0.5 m. Planting was completed in the first, second, and third years on May 3, 28 May 2020, 2021, and 1 June 2022, respectively. Double seeds were planted per hill at spacings of 80 × 45 and 80 × 40 cm to maintain 55,555 and 62500 plants ha−1, respectively, while single seeds were planted per hill at spacings of 65 × 20 cm to maintain 76,900 plants ha−1. During planting, one-third of the granular urea was applied per hill prior to planting and then incorporated into the soil to minimize nitrogen volatilization and rapid nitrification. The remaining two-thirds of the urea was applied as a side dressing after 45 days of planting, 5 cm away from the plant, and covered with soil to minimize nitrogen volatilization. DAP (diammonium phosphate) was applied to all study plots at a rate of 200 kg ha-1 during planting as the primary source of P. In fact, each N rate that was administered as urea was subtracted from the 18% of N that was available in DAP fertilizer (a total of 36 kg N ha−1). Two inter-cultivations were carried out, along with weeding, to maintain the plots’ weed-free status and improve their aeration.
Table 1. The crop management scenarios for maize production explored in northwest Ethiopia midland
2.3. Data collection
2.3.1. Climate data
Climate data from 1987 to 2018 were obtained from the Enhancing National Climate Services (ENACTS) dataset in Ethiopia. ENACTS is a gridded 4 × 4 km dataset compiled at weather stations and meteorological satellites (Dinku et al., Citation2014), and its performance has been evaluated in many areas of the country (Alemayehu & Bewket, Citation2016). The Ethiopian National Meteorological Agency provided ENACTS data for 10 locations in each of the three maize agroecological zones in the Northwest Ethiopia (Table ). Because of the following fundamental factors, ENACTS data have been utilized for climate studies recently: a. Due to the small number of stations, traditional measurements of climate characteristics did not accurately represent all the study sites (Alemayehu & Bewket, Citation2016). b. Because of the uneven distribution of the ground stations, there may be significant distances between them, sometimes exceeding 50 km. c. Due to recently installed stations, the majority of them did not offer long seasonal data records for trend research (Alemayehu & Bewket, Citation2016; Asfaw et al., Citation2018; Dinku et al., Citation2014); d. due to the fact that the station datasets have a significant amount of missing values (Asfaw et al., Citation2018).
Table 2. Monthly climate data from 1987 to 2018
2.3.2. Soil data collection and laboratory analysis procedure
The soil profile collection and categorization of the generic horizons of the profiles and soil types were conducted for model calibration and evaluation based on FAO guidelines. We used the average results for the physicochemical properties of the soil because there was no significant difference between the testing sites. Accordingly, soil variables that have been analyzed for model calibration are as follows: the lower limit (wilting point); the drained upper limit (field capacity); saturation; saturated hydraulic conductivity; root growth factor, bulk density, soil texture (sandy, clay, and silt), organic carbon, total nitrogen (total N); and soil pH in water (Table ).
Table 3. The average of the physicochemical properties of soil at four research locations served as the input for the DSSAT-CERES-maize model
2.3.3. Crop management data collection
Leaf Area Index LAI: leaf area (LAI) can be simply estimated by multiplying the length of the leaf (L) and its width (W) by a constant correction factor of 0.75 as suggested by Francis et al. The total sampled leaf area per sampled area of the experimental plot was then used to calculate the leaf area index. Grain Yield (GY), t ha−1: after the final harvest, threshed, cleaned, dried, and weighed with sensitive electrical balance and then adjusted to 12.5% moisture and then converted into hectare basis. Biomass Yield (B), t ha−1: was a total weight of plants from the net plot area harvested at physiological maturity and sun dried, and converted into hectare basis.
2.3.4. Agronomic data statistical analysis
The data obtained from the experiment (observed) and the model (simulated) were subjected to a statistical analysis. SAS version 12 was used to calculate the analysis of variance (ANOVA) for both observed and simulated agronomic data. While the means were separated with the Ducan multiple range test.
2.4. DSSAT-CERES-Maize model descriptions
The CERES-Maize mode is the excellent realistic crop simulation model for optimizing the nitrogen fertilizer and planting density on maize crop. For this reason, the DSSAT-CERES-maize model, in particular, is the most relevant for this study since it is the most widely used crop-weather model in the world and is frequently used to determine the optimal planting density and N fertilizer rate for maize growth and yield. When properly calibrated and evaluated, the CERES-Maize mode can be used to generate data for genotype by environment interactions and stability studies of maize genotype in the absence of observed field data (Adnan et al., Citation2020).
2.4.1. DSSAT-CERES-Maize model calibration
The CERES-Maize model was calibrated using climate data from 1987 to 2018, physicochemical soil profiling data, crop parameter data, and agronomic management data from the experiment carried out in 2020–2021 at two (Ambomesk and Anedent) experimental location in northwest Ethiopia midlands. Genetic coefficients of maize crop varieties (BH540) were generated for the calibration and validation of the DSSAT-CERES-Maize model using DSSAT 4.7. The genotype coefficient calculator (GENCALC) is software that is used to estimate genetic coefficients in DSSAT 4.7, which has six genetic coefficients that describe the growth and development of a maize cultivar (Table )
Table 4. Genetic coefficients for the DSSAT CERES-Maize model
In this model, each timeframe for physiological development and the growth phase is governed by thermal time. As a result, P1, P2, and P5 govern anthesis and maturity phenology, while G2 and G3 govern grain filling, and PHINT controls leaf phenology (Jones et al., Citation1998). The performance of the model calibration was measured by comparing statistically the simulated and observed values of the growth and development parameters.
2.4.2. DSSAT-CERES-Maize model evaluation
The experiment conducted in 2022 at four experimental locations (Ambomesk, Kudime, Tekeldeb, and Anedent) in the northwest Ethiopian midlands served as a basis for validating the DSSAT-CERES-Maize model that had been calibrated. Model simulation performance was estimated by comparing the simulated and measured days to anthesis, days to physiological maturity, biomass at harvest, grain yield, and leaf area index at maximum. Three of the statistical indicators also used for calibrating and evaluating the performance of DSSAT included the coefficient of determination (R2), the normalized root means square error (NRMSE), and the index of agreement (d).
The deviation statistics were calculated using EquationEquation (1)(1)
(1) –(Equation3
(3)
(3) ):
These statics include root mean square error (RMSE):
Normalized root means square error (NRMSE):
M Where Si is the estimated value, Mi is the measured value, n is the number of values, and M is the average of the measured values. The RMSE summarizes the average difference between observed and predicted values, while the NRMSE shows the relative size of the average difference without units and this statistic is unbounded. We consider NRMSE ≤ 15% as “good” agreement; 15–30% as “moderate” agreement; and ≥ 30% as “poor” agreement (Liu et al., Citation2014). The index of agreement (d) (0 ≤ d ≤ 1) is a descriptive measure and has values ranging from 0 to 1. The higher the index value the better the model performance. Its formula is as follows:
As recommended by (Liu et al., Citation2014), when d ≥ 0.9 this indicates “excellent” agreement; when 0.8 ≤ d < 0.9, then we consider this as “good” agreement; when 0.7 ≤ d < 0.8, then there is “moderate” agreement; and when d < 0.7 there is “poor” agreement between measured and predicted values. R-Squared (R2) is another statistical measure of fit that indicates how much variation of a dependent variable is explained by the independent variable(s) in a regression model.
3. Results and discussion
3.1. Model evaluation and calibration
The six genetic coefficients for the medium-maturing BH540 maize cultivar generated from the model calibration trials conducted during the 2020 and 2021 seasons are shown in Table . The genetic coefficients for these cultivars were estimated using the genotype coefficient calculator (GENCALC) on the basis of 2020 and 2021 season experiments (Table ). The DSSAT-CERES-Maize model simulated maize parameters very well after genetic coefficients (P1, P2, P5, G2, G3, and PHINT) were calibrated.
Table 5. Generated genetic coefficients using experimental BH540 maize cultivars
3.1.1. Phenology (Date of anthesis and maturity)
The observed and simulated days of anthesis (DOA) and maturity (DOM) for the BH540 maize variety under the best levels of PD and N fertilizer treatments are shown in Tables . In the DSSAT-CERES-Maize model, the values of simulated days of anthesis and physiological maturity were 73 and 139, respectively. Similarly, the observed values of days of anthesis and physiological maturity were 73 and 139, respectively, in calibration and evaluation experiments. Hence, this result indicated that the observed and simulated days of Phenology (DOA and DOM) matched exactly for BH540 maize varieties in all experimental years (Tables ). Moreover, there was no deviation between observed and simulated values in maize phenology. Similar findings were observed by Srivastava et al. (Citation2019), who found that the observed and simulated DOM under the variety BH540 matched exactly in Ethiopia. Thus, phenology was calibrated with higher accuracy than other parameters for all treatments.
Table 6. The model calibration performance for days to anthesis, days to maturity, leaf area index, biomass, and grain yield for the medium maize cultivar of the BH540 over across two locations in 2020 and 2021
Table 7. The model evaluation performance for days to anthesis, days to maturity, leaf area index, biomass, and grain yield for the medium maize cultivar of the BH540 across four locations in 2022
3.1.2. Growth parameters (Grain yield and above-biomass and leaf area index)
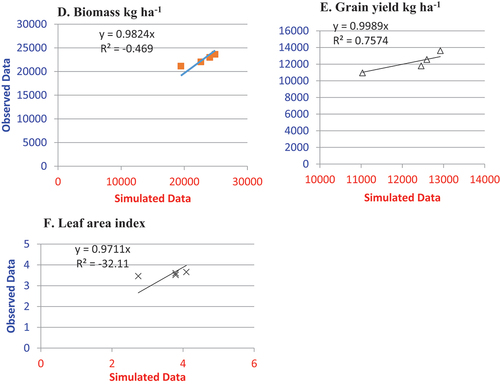
The result of the model calibration and evaluation of LAI, GY and B for the medium-maturing (BH540) maize varieties associated with in the best combination of PD and N-fertilizer levels under current climate condition is shown in Tables and, Figure ), Figure . Similarly, the statistically estimated indices result for comparing simulated and observed LAI, GY and B values in model calibration and evaluation was 69%≤ R2 ≤65%, 5.88% ≤ NRMSE ≤ 7.66%, and 0.83 ≤ d ≤ 0.86 and 99% ≤ R2, 3.96% ≤ NRMSE ≤ 7.66%, and 0.82 ≤ d ≤ 0.91, respectively (Tables ). From these results, the highest d-stat and R2 with the lowest NRMSE values were observed. This showed that, the calibration and evaluation of the DSSAT-CERES-Maize indicated “good” to “excellent” agreement between simulated and observed values for LAI, GY and B for the BH540 maize varieties (Tables ). Thus, the calibration of the DSSAT-CERES-Maize model was highly accurate for the medium maturing BH540 maize varieties in the best combination of planting density and N-fertilizer levels in northern Ethiopia’s midlands under the current climate conditions. The results are directly comparable to those of Srivastava et al. (Citation2019) and Abera et al. (Citation2018) who confirmed highly accurate observed and simulated maize growth parameters in Ethiopia.
Figure 3. Comparison of the simulated and observed above-ground biomass (A), grain yield (B), and leaf area index (C) values for the BH540 cultivars in the calibration experiment.
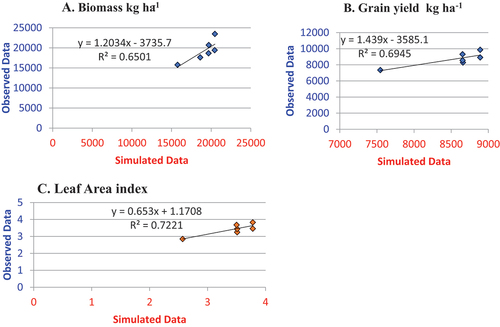
Figure 4. Comparison of the simulated and observed above-ground biomass (D), grain yield (E), and leaf area index (F) values for the BH540 cultivars in the evaluation experiment.
3.2. Effects of integrating planting density and nitrogen fertilizer levels on biological yield
The analysis of variance revealed that grain yield, biomass, and leaf area index were all significantly (P < 0.01) affected by the interaction effects of PD and N fertilizer levels (Table ). Accordingly, the highest observed and simulated grain yield, biomass and leaf area index were measured at a combination of the 276 kg N ha−1 and 76,900 plants ha−1 level (Table and Figures ). On the contrary, the minimum observed and simulated grain yield, above ground biomass and leaf area index were obtained from 138 kg N ha−1 and 55,555 plants ha−1 level (Table and Figures ). This result indicated that all biological yields were increased by enhancing planting density and N fertilizers scenario levels consistently from the lowest to the highest ingredients (Figures ). The primary reason for the higher biological yields at the highest planting density with the highest N fertilizer level levels might be caused by the maximum plants per unit area. Previous research findings also indicated that the highest biological yields were recorded from the combination of maximum PD with maximum N fertilizer levels (Alam et al., Citation2003). Moreover, application of 76,900 plants ha−1 combined with 276 kg N ha−1 significantly increased observed and simulated maize yield by 13–25% and 3–15%, respectively, compared with recommendation in a study area (Table and Figure ). According to Meng et al. (Citation2022) and Zhai et al. (Citation2022), maize yield can be greatly increased by high planting density and proper nitrogen fertilizer treatment. Therefore, this result indicated that there is a possibility to use the highest grain yield per unit area by PD with sufficient N fertilizer levels when all other conditions are favorable since N nutrient demanded may increase as PD increases. This study has also generated adequate information for improvement and implemented the best recommend package of PD and N fertilizer levels for the BH540 and related maize hybrid in the study area.
Figure 5. Observed and simulated of grain yield.
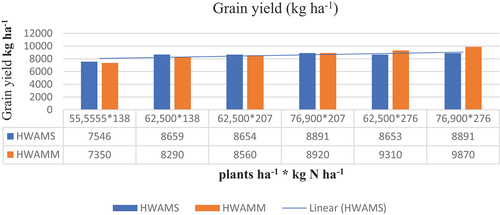
Figure 6. Observed and simulated of above ground biomass.
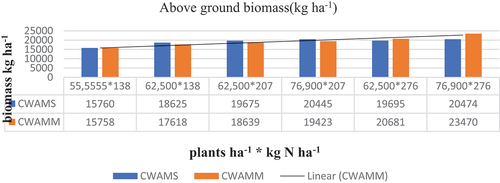
Figure 7. Observed and simulated of leaf area index.
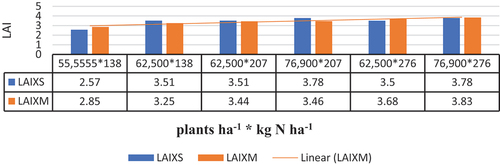
Table 8. Observed and simulated values of grain yield, above ground biomass, and leaf area index
4. Conclusion
Planting density and N-fertilizer levels were still optimized through the process of the field work for specific times of year and at a certain place. However, on-farm decision-making in these systems is frequently challenging due to a variety of uncontrollable treatment defects, such as the weather, the seasons, and soil change. Thus, systematic incorporation of the required input data into simulation models and decision-support systems produces realistic predictions of optimal PD and N-fertilizer level for current climate conditions. The DSSAT-CERES-Maize model, in particular, is the most relevant for this study since it is the most widely used crop-weather model in the world and is frequently used to determine the optimal PD and N-fertilizer rate for maize growth and yield. The DSSAT-CERES-maize model was then calibrated and evaluated using copious amounts of information on the soil profile, maize crop management, and a 32-year (1987–2018) climate period. In the calibration and evaluation, good to excellent agreements were found between the observed and model-simulated DOA and DOM, B, LAI, and GY. Thus, the optimal combination of nitrogen fertilizer and planting density levels was 276 kg N ha−1 and 76,900 plants ha−1 for the medium-maturing maize variety BH540 under the current climate conditions in the northwestern Ethiopian midland. Therefore, farmers have to be motivated to adopt these findings with strong confidence to increase maize productivity on the Northwest Ethiopian midlands and similar agroecological zones.
Disclosure statement
No potential conflict of interest was reported by the author(s).
Data availability statement
The data used to support the findings of this study are included in the results part of the manuscript
Additional information
Notes on contributors

Abebe Zeleke
Abebe Zeleke (PhD candidate) is PhD candidate in University of Gondar, College of Agriculture and Environmental Sciences, Gondar, Ethiopia, and he was employed by Debre Tabor University, College of Agriculture and Environmental Sciences, and serving as a full-time lecture in plant sciences and researcher. His key areas of interest are agronomy and climate change, soil fertility and crop modeling.
References
- Abate, T., Shiferaw, B., Menkir, A., Wegary, D., Kebede, Y., Tesfaye, K., Kassie, M., Bogale, G., Tadesse, B., & Keno, T. (2015). Factors that transformed maize productivity in Ethiopia. Food Security, 7(5), 965–13. https://doi.org/10.1007/s12571-015-0488-z
- Abera, K., Crespo, O., Seid, J., & Mequanent, F. (2018). Simulating the impact of climate change on maize production in Ethiopia, East Africa. Environmental Systems Research, 7(1). https://doi.org/10.1186/s40068-018-0107-z
- Adnan, A. A., Diels, J., Jibrin, J. M., Kamara, A. Y., Shaibu, A. S., Craufurd, P., & Menkir, A. (2020, November). CERES-Maize model for simulating genotype-by-environment interaction of maize and its stability in the dry and wet savannas of Nigeria. Field Crops Research, 253, 107826. https://doi.org/10.1016/j.fcr.2020.107826
- Alam, M. M., Basher, M. M., Karim, A., Rahman, M. A., & Islam, M. R. (2003). Effect of rate of nitrogen fertilizer and population density on the yield and yield attributes of maize (Zea mays). Pakistan Journal of Biological Sciences, 6(20), 1770–1773. https://doi.org/10.3923/pjbs.2003.1770.1773
- Alemayehu, A., & Bewket, W. (2016). Vulnerability of smallholder farmers ’ to climate change and variability in the Central Highlands of Ethiopia Arragaw Alemayehu and woldeamlak Bewket introduction. Ethiopian Journal of the Social Sciences and Humanities, 12(2), 1–24. https://doi.org/10.1016/j.envdev.2017.06.006
- Aman, M., & Dawid, J. (2020). Morphological response of maize (Zea mays) to nitrogen fertilizer application rate at SNNP, Ethiopia. International Journal of Research Studies in Agricultural Sciences, 6(8), 10–14. https://doi.org/10.20431/2454-6224.0608002
- Asfaw, A., Simane, B., Hassen, A., & Bantider, A. (2018). Variability and time series trend analysis of rainfall and temperature in northcentral Ethiopia: A case study in Woleka sub-basin. Weather and Climate Extremes, 19(December), 29–41. https://doi.org/10.1016/j.wace.2017.12.002
- Dinku, T., Block, P., Sharoff, J., Hailemariam, K., Osgood, D., Del Corral, J., Cousin, R., & Thomson, M. C. (2014). Bridging critical gaps in climate services and applications in africa. Earth Perspectives, 1(1), 15. https://doi.org/10.1186/2194-6434-1-15
- Dinku, T., Hailemariam, K., Maidment, R., Tarnavsky, E., & Connor, S. (2014). Combined use of satellite estimates and rain gauge observations to generate high-quality historical rainfall time series over Ethiopia. International Journal of Climatology, 34(7), 2489–2504. https://doi.org/10.1002/joc.3855
- Hoogenboom, G., Porter, C. H., Boote, K. J., Shelia, V., Wilkens, P. W., Singh, U., White, J. W., Asseng, S., Lizaso, J. I., Moreno, L. P., Pavan, W., Ogoshi, R., Hunt, L. A., Tsuji, G. Y., & Jones, J. W. (2019). The DSSAT crop modeling ecosystem. https://doi.org/10.19103/as.2019.0061.10
- Jiang, R., He, W., He, L., Yang, J. Y., Qian, B., Zhou, W., & He, P. (2021). Modelling adaptation strategies to reduce adverse impacts of climate change on maize cropping system in Northeast China. Scientific Reports, 11(1). https://doi.org/10.1038/s41598-020-79988-3
- Jones, J. W., Tsuji, G. Y., Hoogenboom, G., Hunt, L. A., Thornton, P. K., Wilkens, P. W., Imamura, D. T., Bowen, W. T., & Singh, U. (1998). Decision support system for agrotechnology transfer: DSSAT v3. Ibsnat, 1993, 157–177. https://doi.org/10.1007/978-94-017-3624-4_8
- Liu, S., Yang, J. Y., Drury, C. F., Liu, H. L., & Reynolds, W. D. (2014). Simulating maize (Zea mays L.) growth and yield, soil nitrogen concentration, and soil water content for a long-term cropping experiment in Ontario, Canada. Canadian Journal of Soil Science, 94(3), 435–452. https://doi.org/10.4141/CJSS2013-096
- Meng, C., Wang, Z., Cai, Y., Du, F., Chen, J., & Xiao, C. (2022). Effects of planting density and nitrogen (N) application rate on light energy utilization and yield of maize. Sustainability (Switzerland), 14(24), 16707. https://doi.org/10.3390/su142416707
- Ren, H., Li, Z., Cheng, Y., Zhang, J., Liu, P., Li, R., Yang, Q., Dong, S., Zhang, J., & Zhao, B. (2020). Narrowing yield gaps and enhancing nitrogen utilization for Summer maize (Zea mays L) by combining the effects of Varying nitrogen fertilizer input and planting density in DSSAT simulations. Frontiers in Plant Science, 11(November). https://doi.org/10.3389/fpls.2020.560466
- Srivastava, A. K., Mboh, C. M., Faye, B., Gaiser, T., Kuhn, A., Ermias, E., & Ewert, F. (2019). Options for sustainable intensification of maize production in Ethiopia. Sustainability (Switzerland), 11(6), 1707. https://doi.org/10.3390/su11061707
- Teshome, H., Tesfaye, K., Dechassa, N., Tana, T., & Huber, M. (2021). Smallholder farmers’ perceptions of climate change and adaptation practices for maize production in eastern Ethiopia. Sustainability (Switzerland), 13(17), 9622. https://doi.org/10.3390/su13179622
- Xu, F., Wang, B., He, C., Liu, D. L., Feng, P., Yao, N., Zhang, R., Xu, S., Xue, J., Feng, H., Yu, Q., & He, J. (2021). Optimizing sowing date and planting density can mitigate the impacts of future climate on maize yield: A case study in the guanzhong plain of china. Agronomy, 11(8), 1452. https://doi.org/10.3390/agronomy11081452
- Yarnell, A. (2008). Feeding Africa. Chemical & Engineering News, 86(4), 74. https://doi.org/10.1021/cen-v086n004.p074
- Zhai, J., Zhang, Y., Zhang, G., Xu, W., Xie, R., Ming, B., Hou, P., Wang, K., Xue, J., & Li, S. (2022). Nitrogen application and dense planting to obtain high yields from maize. Agronomy, 12(6), 1308. https://doi.org/10.3390/agronomy12061308
- Zhang, Y., Xu, Z., Li, J., & Wang, R. (2021). Optimum planting density improves resource use efficiency and yield stability of rainfed maize in semiarid climate. Frontiers in Plant Science, 12(November), 1–10. https://doi.org/10.3389/fpls.2021.752606