
 ?Mathematical formulae have been encoded as MathML and are displayed in this HTML version using MathJax in order to improve their display. Uncheck the box to turn MathJax off. This feature requires Javascript. Click on a formula to zoom.
Abstract
Recently, the safety of anthraquinone (AQ) in Chinese tea has received much attention. This study determined the concentration of AQ in 1573 Chinese tea samples by gas chromatography-tandem mass spectrometry (GC-MS/MS). It was observed that the total detection rate of AQ was 60.97%, and the mean concentration was 0.0170 mg/kg. The concentration levels of AQ in tea varied by different types of tea, different packaging types, different sale spots and different tea-producing areas. The results of the deterministic assessment show that the health risks associated with daily exposure to AQ via tea consumption are low in different populations in China. For the general population, the mean daily exposure of AQ via tea consumption was (2.50 × 10⁻⁴) µg/kg body weight (BW), 0.0037% of the acceptable daily intake of AQ (6.8 µg/kg BW). In the different sex-age groups, the highest mean daily exposure of AQ via tea consumption was found in the male group aged ≥ 60 years, which was (2.84 × 10⁻⁴) µg/kg BW. The high consumer exposure (95th percentile, P95) was found in the female group aged ≥ 60 years, which was (9.36 × 10⁻⁴) µg/kg BW. Green tea is the main type of tea with AQ exposure by Chinese tea consumers.
1. Introduction
Anthraquinone (AQ) is an aromatic organic compound, which belongs to the oxygenated Polycyclic Aromatic Hydrocarbons (oxy-PAH) subgroup (Díaz-Galiano et al., Citation2021). “The ketone group of 9, 10-anthraquinone (AQ; CAS NO. 84-65-1) is located on the central benzene ring and is usually considered to be the primary constituent of anthraquinone” (Dodd et al., Citation2013). AQ is mainly used in the dyes and paper industry (National Toxicology Program (NTP), Citation2005), as well as bird repellent and insecticide (Ahmad et al., Citation2018; Deliberto & Werner, Citation2016; Mauldin et al., Citation2002; Werner et al., Citation2015). Sub-chronic and chronic toxicity tests in animals showed that AQ has certain harmful effects on the liver, kidney, spleen, bladder and other organs of animals and can even cause cancer in these organs of rats and mice (Dodd et al., Citation2013; Zhai & Song, Citation2021). Currently, there is insufficient evidence that human exposure to AQ causes cancer. A case–control study by Barbone et al. (Citation1992) observed a 2.5-fold increased risk of lung cancer in subjects from AQ dye-producing areas. However, there is no direct evidence from this study that AQ causes cancer. In addition, Wei et al. (Citation2010) found that DNA oxidative damage in the human body is linked to AQ exposure. The International Agency for Research on Cancer has classified AQ as a possible carcinogen to humans (Group 2B) (International Agency for Research on Cancer (IARC), Citation2013). AQ is commonly found in the natural environment and has been detected in the air (Albinet et al., Citation2006; Cautreels et al., Citation1977), water (Akiyama et al., Citation1980; Q. Liu et al., Citation2021; Meijers & Leer, Citation1976) and soil (Rodgers-Vieira et al., Citation2015), as well as in herbs, spices, coffee, tea and other foods (Díaz-Galiano et al., Citation2021). Apart from these, AQ also occurs naturally in the seeds used to produce cassia gum (World Health Organization (WHO), Citation2010). Humans can be exposed to AQ through the above pathways.
Tea contains various bioactive components, such as polyphenols, pigments, polysaccharides, alkaloids, free amino acids and saponins (Tang et al., Citation2019). There has been much research evidence that tea consumption has a lot of potential health benefits, including antioxidation, immuno-regulation, anticancer, cardiovascular protection, anti-diabetes, anti-obesity, etc (Li et al., Citation2016; Xu et al., Citation2020; Xu et al., Citation2023; Zhao et al., Citation2019). Therefore, tea is one of the world’s most popular drinks (Brody, Citation2019). However, in recent years, various residues and contaminants have been detected in tea (Liao et al., Citation2022; Yao et al., Citation2021), which raised public concern about tea consumption. AQ is a new contaminant that has been detected in tea from major tea-exporting countries such as Indonesia and China in recent years (Kartasasmita et al., Citation2020). European Union (EU) No 1146/2014 (European Commission, Citation2014) set the maximum residue levels (MRLs) of AQ in tea at 0.02 mg/kg. Other countries and organizations have not yet set the MRLs. From 2013 to 2017, Chinese tea exports to the EU were notified more than 30 times due to AQ over-standard, ranking first in the notification of over-standard contamination in tea exported from China to the EU (Zhu, Citation2018). Up to now, the source of AQ contamination in Chinese tea is unclear.
The ecological risk assessment identified potential adverse effects of AQ on a variety of animals and aquatic plants (U.S. Environment Protection Agency (EPA), Citation2022a). There is still a lack of research on risk assessment of human exposure to AQ. Tea consumption is one of the important routes of human exposure to AQ. As people become more aware of the quality and safety of tea, the concentration levels of AQ in tea and its potential health risks to humans are now getting a lot of attention. However, to date, there has also been no comprehensive study on the concentration levels of AQ in Chinese tea and the exposure levels of AQ via tea consumption in the Chinese population on a national scale. China is one of the largest tea producers, consumers, and traders in the world, ensuring the quality of tea products is of great importance to the development of the Chinese tea industry and the protection health of tea consumers. So, it is imperative to conduct a comprehensive investigation and assessment.
Therefore, the main objectives of this study were to: (1) investigate the concentration levels of AQ in tea from different types of tea, different packaging types, different sale spots and different tea-producing areas and (2) assess the exposure levels of the Chinese population to AQ via tea consumption using the deterministic assessment and its potential health risks to humans. This study will help quantify the exposure levels of AQ via tea consumption for the Chinese population and offers a reference for the Chinese authorities to establish a scientific and reasonable limit for AQ in tea from the perspective of risk assessment.
2. Materials and methods
2.1. Tea samples data
Tea samples data were obtained from the food safety risk monitoring data in China from 2016 to 2017, for a total of 1573 tea samples were randomly collected from 15 tea monitoring areas in China, including seven types of tea: white tea, dark tea, black tea, scented tea, yellow tea, green tea, and oolong tea. Local laboratories of 15 provinces and municipalities were responsible for the determination of AQ in tea samples, all laboratories followed the standard operating procedures. The methodology was described as follows:
Different types of tea samples were crushed, mixed, extracted by cyclohexane-ethyl acetate, cleaned up by gel permeation chromatography, determined by GC-MS/MS (Agilent 7890\Waters QutraMicro) combined with Column DB-5MS (30 m × 0.25 mm × 0.25 μm). The oven temperature program was as follows: 110 °C held for 2 min and then warmed up to 280 °C at 25 °C/min for 5 min. The carrier gas was high-purity helium (≥99.999%) at a flow rate of 1.0 mL/min, and high-purity argon was used as the collision gas, with the Inlet and transfer line temperatures set at 250 °C and the ion source temperature set at 200 °C. Electron ionization (EI) mode was used with an electron energy of 70 eV. The scanning mode of the mass spectrometry was multiple reaction monitoring. The injection volume was 1 μL. And quantification by the internal standard. In the assay, quality control was carried out using blanks, parallel samples and spike-and-recovery.
According to the Global Environment Monitoring System/Food (GEMS/Food) recommended method (World Health Organization (WHO), Citation1995), if the proportion of results with the concentration of AQ below the limit of detection (LOD) in different types of tea is greater than 60%, results lower than LOD are replaced by LOD. Conversely, results lower than LOD are replaced by 1/2 LOD.
2.2. Tea leaching rate data
Tea is usually consumed in the form of tea infusions. The study found that using a dietary exposure risk assessment based on the levels of contaminants in dry tea would overestimate the health risks to the tea-drinking population through tea consumption (Chen et al., Citation2021). Therefore, this study also considered the leaching rate of tea when conducting the exposure assessment. The data for the leaching rate of AQ in tea in this study were collected from the literature. We finally chose the tea leaching rate data from the study by X. Liu et al. (Citation2021), because their tests conform to the national standard method for tea leaching rate and covered different types of tea. In addition, considering the principle of conservatism in risk assessment, data on the maximum leaching rate in different types of tea were used for the calculation. The leaching rate was 13.6% for black tea and dark tea, 18.2% for green and scented tea, as well as 18.6% for oolong tea.
2.3. Judgment criteria
Due to the lack of established limits for AQ in tea in China and other countries, in this study, the MRLs of 0.02 mg/kg set by the (EU) No 1146/2014 was temporarily used as a criterion for evaluating whether the concentration of AQ in Chinese tea is over-standard.
2.4. Tea consumption data
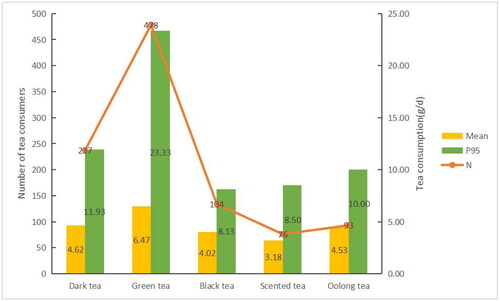
Tea consumption data from the Chinese Resident Food Consumption investigation of 2013–2014, which used a multistage cluster random sample to investigate the consumption of dark tea, green tea, black tea, scented tea and oolong tea among Chinese residents and to obtain the weight of each consumer, for a total of 1,015 respondents. In this study, only tea consumers aged 18 years and above were considered (abbreviated general population). shows the consumption of different types of tea, with green tea consumed by the largest number of people and having the highest average daily consumption and P95 daily consumption.
Figure 1. Consumption of different types of tea in the Chinese population.
Note: N means the number of tea consumers; Mean: mean daily tea consumption; P95: 95th percentile daily tea consumption. Each consumer may have consumed more than one type of tea, so the total N value of these five types of tea is more than 1015.
2.5. Exposure assessment
Based on each consumption data of different types of tea, the mean concentration of AQ in different types of tea, and the leaching rate of tea, the deterministic assessment model was used to calculate the daily exposure of AQ via tea consumption for each consumer. Then, it summed to give the total daily exposure of AQ via tea consumption for the general population and the different sex-age groups (male and female aged 18–59 years, male and female aged ≥ 60 years). The daily exposure of AQ via tea consumption for each consumer was calculated according to the following formula:
is the daily exposure of AQ via tea consumption for consumer i (µg/kg BW per day);
is the consumption of tea k by consumer i (g/d);
is the mean concentration of AQ in tea k (mg/kg, dry weight);
is the leaching rate of tea k;
is the body weight of the consumer i (kg);
is the number of tea consumed by consumer i.
2.6. Risk characterization
The mean daily exposure and the high consumer exposure (P95th percentile, P95) of AQ via tea consumption were compared with the acceptable daily intake (ADI) for the general population and the different sex-age groups, respectively. The ratio of exposure to ADI was also calculated, if the AQ exposure exceeded the ADI, it indicated a higher risk to humans. Nevertheless, International authorities have not yet established ADI for AQ in tea. In a previous study, we performed a 90-day oral toxicity test of AQ in Sprague Dawley (SD) rats, used the eosinophilic glassy droplet pathology in the kidneys as the observed endpoint, and considered the no observed adverse effect level (NOAEL) of 1.36 mg/kg body weight (BW) for AQ in rats (Qu et al., Citation2022). Based on a 100-fold uncertainty factor, extrapolation of subchronic test results to chronic exposures was also considered (Jia, Citation2011). The ADI of 6.8 µg/kg BW was established using an uncertainty factor of 200-fold.
2.7. Statistical analysis
All data collation and statistical analyses were conducted using Microsoft Excel 2019 and R4.1.0, respectively. Concentrations of AQ are presented as the mean, maximum, median and P95. Daily exposure of AQ via tea consumption was presented as mean, maximum, median and percentiles (P90, P95, P97.5, P99). The Wilcoxon rank-sum test was used for the comparison of concentration in tea from different packaging types, and the Kruskal–Wallis test was used for the comparison of concentration in tea from different types of tea, different tea-producing areas, and also for comparison of AQ exposure between the different sex-age groups. The Chi-square test was used for comparison of the detection rate or over-standard rate. P ≤ 0.05 indicates a statistical significance. Figures were drawn using Microsoft Excel 2019.
3. Results
3.1. Analysis of the concentration levels of AQ in Chinese tea
3.1.1. Concentration levels of AQ in different types of tea
Among the 1573 tea samples investigated in this study, the total detection rate of AQ was 60.97%, and the total over-standard rate was 26.95%, with a mean concentration of 0.0170 mg/kg. The most striking result to emerge from the data is that the maximum concentration was 0.5460 mg/kg, which is 27.3 times the MRLs of AQ in the tea set by the EU. Among the seven types of tea, dark tea had the highest detection rate and over-standard rate of 75.18% and 57.45%, respectively. None of the twenty yellow tea samples had AQ concentrations above 0.02 mg/kg. Statistically significant differences were found in the detection rate and over-standard rate of AQ in different types of tea (detection rate: P < 0.001; over-standard rate: P < 0.001). The mean concentration of AQ in the seven types of tea was as follows: white tea (0.0467 mg/kg) < dark tea (0.0292 mg/kg) < scented tea < (0.0213 mg/kg) < black tea (0.0178 mg/kg) < oolong tea (0.0171 mg/kg) < green tea (0.0145 mg/kg) < yellow tea (0.0080 mg/kg). Kruskal–Wallis test revealed statistically significant differences were found in the concentration of AQ in different types of tea (P < 0.001) ().
Table 1. Analysis of the concentration levels of AQ in different types of tea.
3.1.2. Concentration levels of AQ in tea from different packaging types
presents the summary statistics for the concentration levels of AQ in tea from different packaging types. In this study, 428 and 1145 tea samples were collected in stereotyped packaging and bulk packaging, respectively. The detection rate and over-standard rate of AQ in stereotyped packaging tea were significantly higher than those in bulk packaging tea (detection rate: P = 0.007; over-standard rate: P < 0.001). The detection rate of AQ was 66.36% for stereotyped packaging and 58.95% for bulk packaging. The over-standard rate of AQ in stereotyped packaging tea was 34.11% and in bulk packaging tea was 24.28%. The mean, median and P95th percentile (P95) of AQ concentration was slightly higher in stereotyped packaging tea than in bulk packaging tea.
Table 2. Analysis of the concentration levels of AQ in tea from different packaging types.
3.1.3. Concentration levels of AQ in tea from different sale spots
In this study, 452, 280 and 841 tea samples were collected from farmers’ markets, tea factories, and stores (including supermarkets, convenience stores and specialty shops) respectively. The detection rate of AQ in tea from farmers’ markets, tea factories and stores was 63.72%, 36.43% and 67.66%, respectively. And the over-standard rate was 25.44%, 17.50% and 30.92%, respectively. Statistically significant differences were found in the detection rate and over-standard rate of AQ in tea from different sale spots (detection rate: P < 0.001; over-standard rate: P < 0.001) ().
Table 3. Analysis of the concentration levels of AQ in tea from different sale spots.
3.1.4. Concentration levels of AQ in tea from different tea-producing areas in China
AQ was detected in tea from major tea-producing areas in China, but the detection rate varied widely. Except for Guangdong Province (29.41%), Guizhou Province (27.55%), Henan Province (23.68%), Hunan Province (29.73%) and Yunnan Province (26.71%), the detection rate of AQ in tea from tea-producing areas was more than 50%. Statistically significant differences were found in the detection rate of AQ in tea from different tea-producing areas (P < 0.001). The highest over-standard rate of AQ was found in tea from Sichuan Province (71.79%), while the lowest over-standard rate was found in Guizhou Province (2.04%). Statistically significant differences were found in the over-standard rate of AQ in tea from different tea-producing areas (P < 0.001). The mean concentration of AQ in tea from Guangdong Province was the highest at 0.0429 mg/kg, followed by Sichuan Province and Fujian Province at 0.0288 mg/kg and 0.0237 mg/kg, respectively. There was a significant difference statistically in the concentration of AQ in tea from different tea-producing areas (P < 0.001) ().
Table 4. Analysis of the concentration levels of AQ in tea from different tea-producing areas.
3.2. Daily exposure of AQ via tea consumption in the Chinese population
The results of the deterministic assessment, as shown in , indicate that the mean daily exposure of AQ via tea consumption for the general population was (2.50 × 10⁻⁴) µg/kg BW. The P95 daily exposure for the general population was (8.41 × 10⁻⁴) µg/kg BW. In the different sex-age groups, the daily exposure to AQ via tea consumption showed a significant difference (P = 0.01). The mean daily exposure of the male group aged ≥ 60 years was the highest, which was (2.84 × 10⁻⁴) µg/kg BW. The P95 daily exposure of the female group aged ≥ 60 years was the highest, which was (9.36 × 10⁻⁴) µg/kg BW.
Table 5. Analysis of the daily exposure of AQ via tea consumption in the Chinese population.
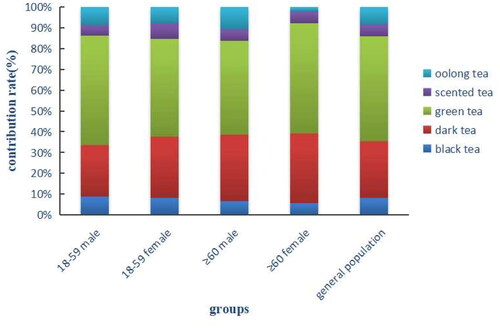
By comparing the contribution of different types of tea to the exposure of AQ in the different groups, it was found that green tea had the highest contribution to the exposure of AQ, with a contribution of 45.27% to 52.85%, followed by dark tea, with a contribution of 24.72% to 33.49% ().
Figure 2. The contribution of different types of tea to the exposure of AQ in the different groups.
3.3. Risk characterization
In the general population, the mean daily exposure and P95 daily exposure of AQ were 0.0037% and 0.0124% of the ADI, respectively. In the different sex-age groups, the mean daily exposure was 0.0042% of the ADI for the male group aged ≥ 60 years and the P95 daily exposure was 0.0138% of the ADI for the female group aged ≥ 60 years. In general, the daily exposure to AQ via tea consumption did not exceed the ADI for the general population and all sex-age groups.
4. Discussion
In China, the issue of AQ in tea has attracted a lot of public attention in recent years. We investigated the concentration levels of AQ in Chinese tea from different types of tea, different packaging types, different sale spots, and different tea-producing areas. The exposure levels of AQ via tea consumption in the Chinese population were also assessed. This study is the first comprehensive investigation of the concentration levels of AQ in a nationwide sample of tea in China and an assessment of the exposure levels of AQ via tea consumption in a nationally representative sample of the Chinese population.
Our study found that the total detection rate of AQ in 1573 tea samples was 60.97%, indicating that AQ contamination was prevalent in the Chinese commercial tea samples. The mean concentration was 0.0170 mg/kg, which did not exceed the MRLs set by the EU. Among the different types of tea, this study confirmed the findings of Yuan et al. (Citation2020) and He et al. (Citation2019), who found that dark tea had the highest over-standard rate of all types of tea. These results are most likely related to the unique production process of dark tea-pile fermentation, which is more complicated than other types of tea (Yuan et al., Citation2020). Some studies have shown that the concentration of chemicals in dark tea may also be related to its high maturity (Yang et al., Citation2012) and aging time (Liang et al., Citation2022; Liang et al., Citation2023). In addition, what is surprising is that the mean concentration of AQ in white tea in this study was higher than in other types of tea, this result can be explained by the following fact that domestic sales of white tea in China are small. Therefore, for a result with statistically significant differences in the detection rate, over-standard rate and concentration, the white tea sample collected in this study was too small.
Among the different packaging types of tea, it was found that the over-standard rate of AQ was higher for tea in stereotyped packaging than for tea in bulk packaging, which is lined with the results of Chen and Jiang (Citation2019) and Yuan et al. (Citation2020) on an investigation of commercial tea in the different packaging types in Fujian Province and Jiangxi Province, respectively. There has been some evidence that stereotyped packaging materials may affect the contamination of AQ in tea. Since AQ is an additive for papermaking, the addition of AQ to the pulp can accelerate the rate of delignification and reduce the degradation of carbohydrates (Ban et al., Citation1998), there may be the presence of AQ in stereotyped packaging materials. Liang et al. (Citation2021) used GC-MS/MS to determine the concentration of AQ in four types of tea packaging paper: kraft paper, coated paper, special paper, and white paperboard, and also found that AQ contamination did exist in tea packaging paper. So, the AQ in tea may be migrated from the packaging paper. Among the different sale spots of tea, our study found that the over-standard rate of AQ in tea was in the following order: stores > farmers’ markets > tea factories. In a study by Yuan et al. (Citation2020), they also found that the over-standard rate of AQ in tea from stores was higher than in farmers’ markets, which is consistent with the findings of our study. In this study, tea samples from the stores were mostly in stereotyped packaging, while tea samples from the farmers’ markets were mostly in bulk packaging. This indirectly also suggests that the contamination of AQ in tea may be related to the packaging materials. Among the different tea-producing areas, both detection rate, over-standard rate and concentration of AQ in tea varied considerably. These results may be attributable to the planting and producing environment. From a planting perspective, a simulated field experiment study evaluated the possible pathway of AQ contamination on tea plantation-tea manufacture-tea infusion and found that the low level of AQ (>0.024 mg/kg) deposits on tea shoots may be one of the sources of AQ contamination in dry tea (Wang et al., Citation2018). The water culture experiment has shown that AQ contamination in tea may occur when AQ and anthracene contamination are present in the waters (Yang et al., Citation2022). From a producing and processing perspective, studies by Yu et al. (Citation2022) and Anggraini et al. (Citation2020) have demonstrated that smoke from wood fire or coal may be one of the sources of AQ contamination in tea. AQ can also be a process contaminant, the chemical reactions between crotonaldehyde and hydroquinone during tea processing also may be a potential pathway for the endogenous formation of AQ in tea (Zamora & Hidalgo, Citation2021). The maximum AQ concentration in commercial tea samples monitored in our study was 0.5460 mg/kg, this tea sample is black tea with bulk packaging, collected from tea factories in Guangdong Province, for which AQ concentration was relatively high and needed to be given high priority. Now, the source of AQ contamination in Chinese tea is not very clear and may be influenced by factors other than the possible sources mentioned above. It reminds the relevant regulatory authorities to conduct regular monitoring of the AQ concentration in tea in the future to ensure the safety of tea consumption.
The results of the exposure assessment showed that the mean daily exposure and consumers at the P95th percentile daily exposure of AQ via tea consumption in the general population were (2.50 × 10⁻⁴) µg/kg BW and (8.41 × 10⁻⁴) µg/kg BW, respectively. Furthermore, our study found that the health risks associated with exposure to AQ via tea consumption are extremely low for the general population and the different sex-age groups. He et al. (Citation2019) used the point assessment method to estimate AQ exposure for Hangzhou residents and showed that the mean weekly exposure of AQ via tea consumption was 0.0016 μg/kg BW. X. Liu et al. (Citation2021) also used the point assessment method and found that the mean weekly exposure of AQ via tea consumption for Wuhan residents was (3.86 × 10⁻⁴) μg/kg BW. However, the ADI for AQ has not been established in China at present, so they did not assess the health risks of AQ exposure via tea consumption in the population. The study by Kartasasmita et al. (Citation2020) found that even taking into account the highest concentration of AQ in Indonesian tea samples, it resulted in an incremental lifetime cancer risk (ILCR) of not more than 10−6 and a margin of exposure (MOE) of not less than 104, therefore there is no risk to human health. Yusiasih et al. (Citation2019) calculated a risk quotient (RQ) of 0.033 and an R of 2.63 × 10⁻⁶ based on the highest AQ levels detected in infusion tea samples from Indonesia. This does not pose a risk to human health but also needs to be considered for long-term exposure to AQ in tea or when higher concentrations of AQ in tea are consumed.
There are some limitations in this study. Firstly, the concentration of AQ in tea samples was monitored in 2016–2017. This does not accurately reflect the current concentration levels of AQ in Chinese tea, even though the concentration of AQ in tea is the latest monitoring data. Secondly, the tea consumption data is also the latest available but was collected over nine years ago, and the current total tea consumption of the Chinese population was not taken into account in this study. Last but not least, humans (especially occupationally exposed people) may be exposed to AQ from multiple pathways. A recent report issued by the United States Environmental Protection Agency (U.S.EPA) that the unrefined dietary cancer risk for adults (3 × 10⁻⁶), Occupational handler cancer risk estimates (private handlers: 5 × 10⁻⁸–9 × 10⁻⁵; commercial handlers: 1 × 10⁻⁷–2 × 10⁻⁴), etc (U.S. Environment Protection Agency (EPA), Citation2022b). Therefore, the risk of exposure to AQ by other routes cannot be ignored. As a result, it is worth mentioning that, given the uncertainty of this assessment, further assessment will be necessary in the future.
5. Conclusions
In this study, we investigated the concentration levels of AQ in Chinese tea, and the results of comparison and analysis revealed that the concentration levels varied by different types of tea, different packaging types, different sale spots, and different tea-producing areas. Individual commercial tea samples with a relatively high concentration of AQ. In addition, the deterministic assessment results showed that AQ exposure via tea consumption does not pose a health risks to Chinese tea consumers. However, long-term monitoring of AQ concentration in tea should still be carried out. AQ contamination in tea is influenced by a variety of factors, which may be related to the types of tea, packaging types, and the production and processing environment. There is a need to identify the source of contamination and control AQ contamination at the source. Overall, this study not only provides a reference for understanding the concentration levels of AQ in Chinese tea and the potential health risks posed to humans but also provides a reference for Chinese regulators to the research of scientific and reasonable MRLs from the perspective of risk assessment.
Informed consent
All authors named in the manuscript are entitled to the authorship and have approved the final version of the submitted manuscript. This article does not contain any studies with human or animal subjects.
Acknowledgments
We are grateful for all the participants and staff involved in this research.
Disclosure statement
No potential conflict of interest was reported by the author(s).
Data availability statement
Derived data supporting the findings of this study are available from the corresponding author [Yan Song] on request.
Correction Statement
This article has been corrected with minor changes. These changes do not impact the academic content of the article.
Additional information
Funding
References
- Ahmad, S., Saleem, Z., Jabeen, F., Hussain, B., Sultana, T., Sultana, S., Al-Ghanim, K. A., Al-Mulhim, N. M. A., & Mahboob, S. (2018). Potential of natural repellents methylanthranilate and anthraquinone applied on maize seeds and seedlings against house sparrow (Passer domesticus) in captivity. Brazilian Journal of Biology, 78(4), 667–672 https://doi.org/10.1590/1519-6984.171686
- Akiyama, T., Koga, M., Shinohara, R., Kido, A., & Etoh, S. (1980). Detection and identification of trace organic substances in the aquatic environment. Journal of UOEH, 2(3), 285–300. https://doi.org/10.7888/juoeh.2.285
- Albinet, A., Leoz-Garziandia, E., Budzinski, H., & Viilenave, E. (2006). Simultaneous analysis of oxygenated and nitrated polycyclic aromatic hydrocarbons on standard reference material 1649a (urban dust) and on natural ambient air samples by gas chromatography-mass spectrometry with negative ion chemical ionisation. Journal of Chromatography A, 1121(1), 106–113. https://doi.org/10.1016/j.chroma.2006.04.043
- Anggraini, T., Neswati, Nanda, R. F., Syukri, D. (2020). Identification of 9,10-anthraquinone contamination during black and green tea processing in Indonesia. Food Chemistry, 327, 127092. https://doi.org/10.1016/j.foodchem.2020.127092
- Ban, W. P., Sheng, Z. R., Song, W. J., & Wu, Z. W. (1998). Study on the role of anthraquinone in the chemical pulping of paper industry. Dyestuffs and Coloration, 35(3), 29–32.
- Barbone, F., Delzell, E., Austin, H., & Cole, P. (1992). A case-control study of lung cancer at a dye and resin manufacturing plant. American Journal of Industrial Medicine, 22(6), 835–849. https://doi.org/10.1002/ajim.4700220606
- Brody, H. (2019). Tea. Nature, 566(7742), S1–S1. https://doi.org/10.1038/d41586-019-00394-5
- Cautreels, W., Cauwenberghe, K. V., & Guzman, L. A. (1977). Comparison between the organic fraction of suspended matter at a background and an urban station. Science of the Total Environment, 8(1), 79–88. https://doi.org/10.1016/0048-9697(77)90063-8
- Chen, T., & Jiang, H. (2019). Detection method and result analysis of 9,10-anthraquinone in tea in Fujian Province from 2017 to 2018. Strait Journal of Preventive Medicine, 25(04), 63–65.
- Chen, Z. M., Luo, F. J., Zhou, L., Lou, Z. Y., Zheng, Z. T., Zhang, X. Z., Zhao, Y., Sun, H. Z., Yang, M., & Wang, X. R. (2021). Innovation and application of control system for pesticide residues and contaminants in tea. Journal of Tea Science, 41(01), 1–6.
- Deliberto, S. T., & Werner, S. J. (2016). Review of anthraquinone applications for pest management and agricultural crop protection. Pest Management Science, 72(10), 1813–1825. https://doi.org/10.1002/ps.4330
- Díaz-Galiano, F. J., Murcia-Morales, M., Gómez-Ramos, M. D. M., Ferrer, C., & Fernández-Alba, A. R. (2021). Presence of anthraquinone in coffee and tea samples. An improved methodology based on mass spectrometry and a pilot monitoring programme. Analytical Methods: Advancing Methods and Applications, 13(1), 99–109. https://doi.org/10.1039/d0ay01962c
- Dodd, D. E., Layko, D. K., Cantwell, K. E., Willson, G. A., & Thomas, R. S. (2013). Subchronic toxicity evaluation of anthraquinone in Fischer 344 rats. International Journal of Toxicology, 32(5), 358–367. https://doi.org/10.1177/1091581813501701
- European Commission. (2014). Commission Regulation (EU) No 1146/2014 of 23 October 2014 amending Annexes II, III, IV and V to Regulation (EC) No 396/2005 of the European Parliament and of the Council as regards maximum residue levels for anthraquinone, benfluralin, bentazone, bromoxynil, chlorothalonil, famoxadone, imazamox, methyl bromide, propanil and sulphuric acid in or on certain products. Official Journal of the European Union, L 308, 3–60.
- He, H. L., Fan, J. C., Ren, R., & Jin, Q. (2019). Investigation on contamination of 9, 10-anthraquinone in different kinds of tea and assessment on dietary exposure in Hangzhou. Chinese Journal of Health Laboratory Technology, 29(16), 1998–2000.
- International Agency for Research on Cancer (IARC). (2013). Some chemicals present in industrial and consumer products, food and drinking water (vol. 101). pp. 41–66.
- Jia, X. D. (2011). Derivation of health-based guidance values in food safety risk assessment. Chinese Journal of Food Hygiene, 23(01), 22–25.
- Kartasasmita, R. E., Kurniawan, F., Amelia, T., Dewi, C. M., Harmoko, H., & Pratama, Y. (2020). Determination of anthraquinone in some Indonesian black tea and its predicted risk characterization. ACS Omega, 5(32), 20162–20169. https://doi.org/10.1021/acsomega.0c01812
- Li, Y., Wang, C., Huai, Q., Guo, F., Liu, L., Feng, R., & Sun, C. (2016). Effects of tea or tea extract on metabolic profiles in patients with type 2 diabetes mellitus: a meta-analysis of ten randomized controlled trials. Diabetes/Metabolism Research and Reviews, 32(1), 2–10. https://doi.org/10.1002/dmrr.2641
- Liang, J. F., Li, Y., Bin, Y. J., Qiao, R. Y., Ke, L. J., Zhong, S. Q., & Liang, Y. N. (2023). Quantitative analysis and survey of 9, 10-anthraquinone contaminant in Chinese Liupao tea. Food Additives & Contaminants. Part A, Chemistry, Analysis, Control, Exposure & Risk Assessment, 40(7), 878–889. https://doi.org/10.1080/19440049.2023.2227722
- Liang, J. F., Li, Y., Bin, Y. J., Zeng, Y. M., Ke, L. J., & Jiang, D. L. (2022). Determination and pollution analysis of 9, 10-anthraquinone in Liupao tea. China Food Additives, 33(06), 191–196.
- Liang, J. F., Li, Y., Wei, S. Q., Qiao, R. Y., & Chen, M. B. (2021). Determination of 9, 10-Anthraquinone in Tea Packaging Paper by GC-MS/MS. Science and Technology of Food Industry, 42(12), 246–252.
- Liao, Z., Cao, D., & Gao, Z. (2022). Monitoring and risk assessment of perchlorate in tea samples produced in China. Food Research International, 157, 111435. https://doi.org/10.1016/j.foodres.2022.111435
- Liu, X. H., Li, Y. G., Kong, F., Nie, X. M., Tang, L., Wen, S., & Luo, P. (2021). Study on the contamination level and dietary exposure of 9, 10-anthraquinone in different types of teas in Wuhan. Journal of Public Health and Preventive Medicine, 32(03), 45–49.
- Liu, Q., Xu, X., Lin, L., & Wang, D. (2021). Occurrence, distribution and ecological risk assessment of polycyclic aromatic hydrocarbons and their derivatives in the effluents of wastewater treatment plants. The Science of the Total Environment, 789, 147911. https://doi.org/10.1016/j.scitotenv.2021.147911
- Mauldin, R. E., Primus, T. M., Volz, S. A., Kimball, B. A., Johnston, J. J., Cummings, J. L., & York, D. L. (2002). Determination of anthraquinone in technical material, formulations, and lettuce by high performance liquid chromatography. Journal of Agricultural and Food Chemistry, 50(13), 3632–3636. https://doi.org/10.1021/jf0113878
- Meijers, A. P., & Leer, R. (1976). The occurrence of organic micropollutants in the river Rhine and the river Maas in 1974. Water Research, 10(7), 597–604. https://doi.org/10.1016/0043-1354(76)90140-8
- National Toxicology Program (NTP). (2005). NTP technical report on the toxicology and carcinogenesis studies of anthraquinone (CAS No. 84-65-1) in F344/N rats and B6C3F1 mice (Feed Studies). National Toxicology Program Technical Report Series.
- Qu, J. J., Pei, L., Wang, X., Fu, S., Yong, L., Xiao, X., Xie, Q., Fan, B., & Song, Y. (2022). Acute and subchronic oral toxicity of anthraquinone in Sprague Dawley rats. International Journal of Environmental Research and Public Health, 19(16), 10413. https://doi.org/10.3390/ijerph191610413
- Rodgers-Vieira, E. A., Zhang, Z., Adrion, A. C., Gold, A., & Aitken, M. D. (2015). Identification of anthraquinone-degrading bacteria in soil contaminated with polycyclic aromatic hydrocarbons. Applied and Environmental Microbiology, 81(11), 3775–3781. https://doi.org/10.1128/AEM.00033-15
- Tang, G. Y., Meng, X., Gan, R. Y., Zhao, C. N., Liu, Q., Feng, Y. B., Li, S., Wei, X. L., Atanasov, A. G., Corke, H., & Li, H. B. (2019). Health functions and related molecular mechanisms of tea components: An update review. International Journal of Molecular Sciences, 20(24), 6196. https://doi.org/10.3390/ijms20246196
- U.S. Environment Protection Agency (EPA). (2022a). Anthraquinone: Draft ecological risk assessment for registration review.
- U.S. Environment Protection Agency (EPA). (2022b). 9,10-Anthraquinone: Draft human health risk assessment for registration review.
- Wang, X., Zhou, L., Luo, F., Zhang, X., Sun, H., Yang, M., Lou, Z., & Chen, Z. (2018). 9,10-Anthraquinone deposit in tea plantation might be one of the reasons for contamination in tea. Food Chemistry, 244, 254–259. https://doi.org/10.1016/j.foodchem.2017.09.123
- Wei, Y. J., Han, I. K., Hu, M., Shao, M., Zhang, J. J., & Tang, X. (2010). Personal exposure to particulate PAHs and anthraquinone and oxidative DNA damages in humans. Chemosphere, 81(10), 1280–1285. https://doi.org/10.1016/j.chemosphere.2010.08.055
- Werner, S. J., Deliberto, S. T., Mangan, A. M., Pettit, S. E., Ellis, J. W., & Carlson, J. C. (2015). Anthraquinone-based repellent for horned larks, great-tailed grackles, American crows and the protection of California’s specialty crops. Crop Protection, 72, 158–162. https://doi.org/10.1016/j.cropro.2015.03.020
- World Health Organization (WHO). (1995). GEMS/Food-EURO Second Workshop on Reliable Evaluation of Low-Level Contamination of Food: Report on a workshop in the Frame of GEMS/Food-EURO.
- World Health Organization (WHO). (2010). Safety evaluation of certain food additives (Prepared by the Seventy-first meeting of the Joint FAO/WHO Expert Committee on Food Additives). WHO Food Additives Series, 62.
- Xu, X. Y., Zhao, C. N., Cao, S. Y., Tang, G. Y., Gan, R. Y., & Li, H. B. (2020). Effects and mechanisms of tea for the prevention and management of cancers: An updated review. Critical Reviews in Food Science and Nutrition, 60(10), 1693–1705. https://doi.org/10.1080/10408398.2019.1588223
- Xu, X. Y., Zhao, C. N., Li, B. Y., Tang, G. Y., Shang, A., Gan, R. Y., Feng, Y. B., & Li, H. B. (2023). Effects and mechanisms of tea on obesity. Critical Reviews in Food Science and Nutrition, 63(19), 3716–3733. https://doi.org/10.1080/10408398.2021.1992748
- Yang, X. F., Kong, J. H., Gao, Y. P., Zhang, S. K., Yu, C., & Zhao, Y. X. (2012). Investigation and current situation of rare-earth elements issues in Chinese tea. China Tea Processing, (1) 4-7 + 11.
- Yang, M., Luo, F., Zhang, X., Wang, X., Sun, H., Lou, Z., Zhou, L., & Chen, Z. (2022). Uptake, translocation, and metabolism of anthracene in tea plants. Science of the Total Environment, 821, 152905. https://doi.org/10.1016/j.scitotenv.2021.152905
- Yao, Q., Li, J., Yan, S. A., Huang, M., & Lin, Q. (2021). Occurrence of pesticides in white tea and a corresponding risk exposure assessment for the different residents in Fujian, China. Journal of Food Science, 86(8), 3743–3754. https://doi.org/10.1111/1750-3841.15826
- Yu, J., Zhou, L., Wang, X., Yang, M., Sun, H., Wang, X., Luo, F., Zhang, X., Lou, Z., & Chen, Z. (2022). 9,10-Anthraquinone contamination in tea processing using coal as heat source. Beverage Plant Research, 2(1), 1–6. https://doi.org/10.48130/BPR-2022-0008
- Yuan, Y., Zhou, H., Zhao, Y., Mei, H., & Zheng, J. (2020). Pollution of 9, 10-anthraquinone in tea sold, Jiangxi. Modern Preventive Medicine, 47(15), 2852–2855.
- Yusiasih, R., Pitoi, M. M., Ariyani, M., Koesmawati, T. A., Maulana, H. J. C., & Agriculture, B. T. I. (2019). Anthraquinone in Indonesian infusion tea: analysis by HPLC–UV and risk assessment. Chemical and Biological Technologies in Agriculture, 6(1), 19. https://doi.org/10.1186/s40538-019-0155-2
- Zamora, R., & Hidalgo, F. J. (2021). Formation of naphthoquinones and anthraquinones by carbonyl-hydroquinone/benzoquinone reactions: A potential route for the origin of 9,10-anthraquinone in tea. Food Chemistry, 354, 129530. https://doi.org/10.1016/j.foodchem.2021.129530
- Zhai, J., & Song, Y. (2021). Advances in anthraquinone toxicology. Journal of Hygiene Research, 50(05), 868–872.
- Zhao, C., Tang, G., Cao, S., Xu, X., Gan, R., Liu, Q., Mao, Q., Shang, A., & Li, H. (2019). Phenolic profiles and antioxidant activities of 30 tea infusions from green, black, oolong, white, yellow and dark teas. Antioxidants (Basel, Switzerland), 8(7), 215. https://doi.org/10.3390/antiox8070215
- Zhu, F. L. (2018). Information Summary and Commentary on Notification of Unqualified Tea in China by Europe, the US, Japan and South Korea from 2013-2017. China Tea, 40(06), 24–27.