
 ?Mathematical formulae have been encoded as MathML and are displayed in this HTML version using MathJax in order to improve their display. Uncheck the box to turn MathJax off. This feature requires Javascript. Click on a formula to zoom.
Abstract
Watershed-scale management practices (WMPs) aimed at mitigating land degradation from soil erosion have been implemented across Ethiopia, including in the study area, yet their effect remains under-evaluated. A useful method to assess the effect of WMPs involves comparing soil characteristics between micro-watersheds subjected to different treatments. For this analysis, the Urago and Mende micro-watersheds in Becho district, central Ethiopia, were chosen for their similar physical attributes, though only Urago received government-initiated WMP interventions. This study aims to assess the effect of WMPs on soil properties under varying land use types (LUTs) and topographic positions (TPs) in conserved versus non-conserved areas. To achieve this objective, soil samples were systematically collected from three distinct LUTs at upper, middle, and lower TPs in both conserved (Urago) and non-conserved (Mende) micro-watersheds. The analysis of soil properties across different micro-watersheds revealed no significant differences. However, there were indications of minor improvements in soil organic carbon (SOC), total nitrogen (TN), and percent base saturation (PBS) in the conserved micro-watershed. These improvements are likely attributable to interventions such as stone and soil bunds, land rehabilitation, and improved drainage. Soil texture and SOC levels were strongly influenced by LUTs, showing better results in conserved areas. Soil pH, cation-exchange capacity (CEC), exchangeable Ca2+, and PBS varied with TPs, with higher values found at lower elevations. Higher elevations had somewhat higher SOC, TN, and exchangeable Na+, potentially due to specific replantation efforts, though these increases were not statistically significant. However, WMPs were less effective on lower-elevation farmlands, with minimal impact on combating land degradation. This underscores the necessity for comprehensive and tailored sustainable land management approaches in these areas to enhance soil quality.
1. Introduction
Soil serves as the foundational resource for plant growth, food production, and energy flow to support life on Earth. It is the most crucial component of sustainable agriculture (Lemenih et al., Citation2005). The suitability of soil for crop cultivation and sustainable agriculture is determined by its physical, chemical, and biological qualities (Khan et al., Citation2013). However, these characteristics are compromised by soil erosion, which is influenced by factors such as local topography, parent material, climate, and anthropogenic activities like land use change and management practices (Kahsay et al., Citation2023). Soil erosion is a global threat to soil, resulting in the decline of soil fertility and crop production (Khan et al., Citation2013, Ebabu et al., Citation2020, Haile et al., Citation2022). Since 1945, approximately 11% of vegetated land and 38% of cultivated areas have experienced soil erosion (Liu et al., Citation2006). Each year, about 9.6 million hectares of land, equivalent to 24 billion tonnes of topsoil, are lost due to erosion (Liu et al., Citation2006). Consequently, soil degradation and changes in soil quality due to erosion, salinization, organic matter and mineral loss, and soil compaction are concerns for agricultural regions worldwide. In Ethiopia, where more than 90% of the population relies on agriculture for food and livelihood, soil erosion is a persistent and significant challenge that adversely affects soil quality (Haileslassie et al., Citation2006). The high rate of soil erosion, over-cultivation, improper land use, and poor soil management in Ethiopia have contributed to substantial soil fertility loss (Fenta et al., Citation2021, Haile et al., Citation2022). This degradation of soil physical, chemical, and biological properties ultimately lead to a decline in agricultural productivity (Ebabu et al., Citation2020, Haile et al., Citation2022). In the highland areas of Ethiopia, where a large percentage of the population resides and farming has been practiced for centuries, soil erosion and associated fertility reduction are particularly severe (Haileslassie et al., Citation2005, Ebabu et al., Citation2020).
Studies conducted in various parts of the Ethiopian highlands have shown that the average rate of soil loss caused by water erosion ranges from 20 to 80 t ha−1 yr−1 (Haregeweyn et al., Citation2017, Berihun et al., Citation2020). The average rate of soil loss from cultivated lands was estimated to be 42 t ha−1 yr−1 (Hurni, Citation1993). The type of land use, soil management practices, and soil biophysical and chemical characteristics have a significant impact on the magnitude of soil loss (Hurni, Citation1988, Bojo & Cassells, Citation1995). Nationally, soil erosion contributes to 70%, 80%, and 63% of the loss of nitrogen (N), phosphorus (P), and potassium (K), respectively, out of the annual inputs of 122 kg N ha−1 yr−1, 13 kg P ha−1 yr−1, and 82 kg K ha−1 yr−1 (Haileslassie et al., Citation2005). In various agro-ecological environments of the upper Blue Nile, losses of total nitrogen (TN) ranged from 39.6 to 55.5 kg ha−1 yr−1, and available phosphorus (Av. P) losses ranged from 4.1 to 5.9 kg ha−1 yr−1, with a total replacement cost of US$26–38 ha−1 yr−1 (Mulualem et al., Citation2021). Croplands experienced significantly higher TN and Av. P losses compared to other land use types (Mulualem et al., Citation2021). Additionally, studies conducted at experimental plot scale in Tigray (Girmay et al., Citation2009) have shown that water erosion results in average annual losses of TN ranging from 2.1 to 32.8 kg ha−1 yr−1 and Av. P losses ranging from 0.02 to 0.2 kg ha−1 yr−1. Water erosion in Ethiopia has led to the loss of one billion tonnes of topsoil, resulting in an estimated reduction of 30% in the country’s agricultural Gross Domestic Product (GDP) (Kirui & Mirzabaev, Citation2014).
In conserving natural resources and enhancing biodiversity, while minimizing soil erosion, soil fertility decline, and associated loss of productivity, the government of Ethiopia introduced modern soil and water conservation (SWC) practices at a watershed scale in the 1970s (Amede et al., Citation2001, Badege, Citation2001). Since then, various SWC measures such as soil and stone bunds, hillside terraces, check dams, area closure, and tree planting have been encouraged (Hurni, Citation1988, Mengistu et al., Citation2016). The implementation of SWC measures at a watershed scale has resulted in significant reductions in soil loss in different areas of Ethiopia. For example, soil loss decreased by 25–38% between 2011 and 2015 in the Gumara Maksegnit watershed (Melaku et al., Citation2017), 64% between 1990 and 2012 in the Agula watershed (Fenta et al., Citation2016), and 47% between 2007 and 2009 in the central highlands of Ethiopia (Adimassu et al., Citation2012). At the country level, there has been a reduction of 65–70% in soil loss (Fenta et al., Citation2021). SWC measures not only reduce soil loss but also enhance land cover and soil quality. Land use types have been found to affect the distribution and supply of soil nutrients, directly altering soil properties and influencing biological transformations in the rooting zone. Studies conducted in different regions of Ethiopia have shown that the adoption of soil bund and fanya juu measures has improved the Av. P, TN, and SOC (Adimassu et al., Citation2012, Hailu et al., Citation2012, Selassie et al., Citation2015, Mengistu et al., Citation2016). However, other studies conducted in western parts of Ethiopia have indicated no impact on soil nutrients following the implementation of soil bunds (Erkossa et al., Citation2018). Therefore, the benefits of SWC measures in improving soil nutrients and soil loss vary from place to place, highlighting the need for further research on the implementation of SWC practices at the watershed scale to enhance soil properties in different land use types.
Geographical variability of soil parameters can be influenced by SWC practices, as previous research has shown. For example, SOC, TN, CEC, and PBS increased from higher to lower terraces due to the presence of flat areas with minimal soil erosion (Amare et al., Citation2013). The position of the stone bund also impacted soil properties, with Av. P and TN increasing in lower slope positions where limestone was the predominant parent material (Vancampenhout et al., Citation2006). However, SOC did not vary with stone bund position in areas where basalt constituted a significant portion of the soil (Vancampenhout et al., Citation2006). Topographic positions also exerted an influence on soil properties, as they affected microclimate, runoff, evaporation, and transpiration (Raghubanshi, Citation1992). Therefore, it is of paramount importance to assess the relationship between watershed management practices at different land use types, topographic positions, and soil characteristics in order to comprehend their impact and identify measures to enhance soil nutrient status for agricultural purposes.
Since 2010/2011, a variety of physical and biological soil and water conservation (SWC) practices have been implemented in the Urago micro-watershed through a government-led mass campaign. This micro-watershed was selected because it experiences more severe soil erosion than other areas (Becho District Natural Resources Department, Citation2021, Hailu et al., Citation2022). The SWC practices utilised in this micro-watershed include stone-supported soil bunds, tree planting for land restoration, and area closure in cultivated, degraded, and steep areas. To optimise SWC practices, it is essential to evaluate the changes in key soil properties between conserved and non-conserved micro-watersheds across a range of land use types and topographical variations. Given the site-specific nature of implemented management practices, understanding these differences is crucial. Nevertheless, the current state of scientific knowledge regarding the impact of SWC practices on soil properties within various land uses and topographic settings in conserved micro-watersheds remains limited. Consequently, the objective of this study is to evaluate comprehensively the effects of these management practices on the main soil properties across different land use types and topographic positions. To this end, a conserved micro-watershed will be compared with its non-conserved counterpart.
2. Materials and methods
2.1. Study area
This study was carried out in the Mende (non-conserved) and Urago (conserved) micro-watersheds in the Becho district of the Central Highlands of Ethiopia (). The Urago micro-watershed is located between 8° 32’0" and 8° 34’37" N and 38° 7’45" and 38° 13’50" E. The elevation of the Urago micro-watershed ranges from 2,270 to 2,773 m above sea level (m a.s.l.). The results of key informant interviews with local residents and development agents indicate that since 2010/2011, government-led soil and water conservation (SWC) management practices have been implemented at the watershed level in partnership with the residents of Shankur village. These measures are aimed at restoring degraded communal lands and small-scale agricultural plots within the Urago micro-watershed. The most common forms of government-led SWC management practiced in the Urago micro-watershed include area closure, afforestation or enhancement of degraded land, soil bunds, stone bunds, fallow, and soil fertility management. Unfortunately, prior information on the soil properties of the conserved micro- watershed, which would make change detection viable, is unavailable. In the absence of prior information, changes in soil properties induced by watershed management practices in an area can be evaluated by measuring and comparing the soil properties of the conserved area with those of the adjacent area, which has a similar physical environment but does not employ SWC management practices (Lemenih et al., Citation2005, Gong et al., Citation2007). Thus, this study used the above inferential approach. Therefore, the adjacent Mendi micro-watershed, found between 8°34’0" and 8°36’50" N and 38°8’0" and 38°11’23" E with an elevation of 2,245–2,755 m a.s.l., was selected as a control area to test whether the implementation of SWC management practices in the Urago micro-watershed brought about significant variation in soil properties. This is why the Mende micro-watershed was selected for this study as a non-conserved control area and the Urago micro-watershed as an experimental (conserved) site in which different SWC practices were implemented.
Figure 1. Location map of the study micro-watersheds in Becho district of Central highlands of Ethiopia.
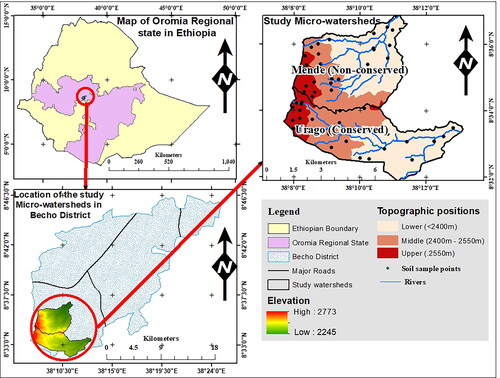
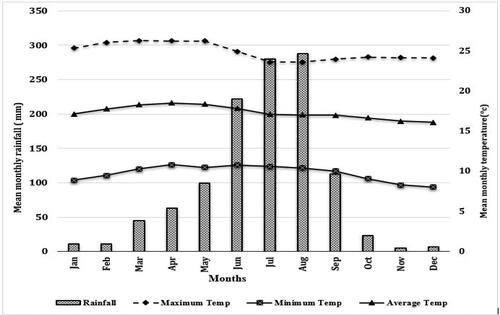
Both micro-watersheds (Mende with 2226 ha and Urago with 2220 ha) cover a total area of 4446 ha. The Woinadega and Dega climates prevailed in the study areas, with an average annual rainfall of 1064 mm (1990–2019). Furthermore, maximum and minimum annual rainfall of 2,258 mm and 461 mm were recorded in the study areas in 1993 and 1990, respectively. The mean maximum and minimum annual temperatures of study areas were 23 °C and 9 °C, respectively, between 1990 and 2019 ().
Figure 2. Rainfall and temperature records of the study area based on the records of nearby Tulu Bolo station (1990–2019) (Source: Ethiopian Meteorological Institute, 2021).
The Nazreth series volcanoes are the underlying geological structures of the two micro-watersheds that form the parent materials of the dominant soil types, vertisols, of the watersheds (Elias, Citation2016). Vertisols cover about 90% of the soils in the watersheds, while the remaining areas are occupied by luvisols, nitisols, and leptosols (Elias, Citation2016). These soil group classifications is based on the WRB classification system (Spaargaren & Deckers, Citation1998). Subsistence rain-fed farming is the main economic basis of the local community in both micro-watersheds. As a result, maize (Zea mays), teff (Eragrostis teff E.), wheat (Triticum aestivum), and chickpea (Cicer arietinum) are the major cultivated food crops. Furthermore, the most typical animals kept in the micro-watersheds include oxen, cows, goats, sheep, horses, mules, and donkeys (Becho District Natural Resources Department, Citation2021).
2.2. Soil sampling and determination of basic soil properties
The soil properties of the selected micro-watersheds were studied through field surveys and laboratory analysis. Topographic maps were used to conduct an initial survey to evaluate the area’s topography and historical land use patterns. Soil samples were collected from the conserved and non-conserved areas by stratifying them into three topographic positions: lower (<2400 m), middle (2401–2550 m), and upper (>2550 m) altitudinal positions. The dominant land use and land cover types (such as agricultural land, grassland, and forested land - manmade and natural) in each altitude category were identified. Prior to soil sampling, the agricultural lands were used for cultivating teff (Eragrostis teff E.), wheat (Triticumaestivum), and chickpea (Cicerarietinum). Between December 2020 and February 2021, a comprehensive collection of soil samples was conducted to assess variations in soil properties across different land use types and topographies in conserved and non-conserved micro-watersheds. In total, 54 disturbed topsoil samples (0–30 cm depth) were collected; these comprised equal numbers of sample size from conserved and non-conserved areas within each land use types across three different topographic positions (3 land use types × 3 topographical categories × 3 replications × 2 micro-watersheds). Additionally, to determine bulk density and moisture content, we utilised a stainless-steel core sampler with a volume capacity of 100 cm³ for gathering an aggregate of 24 undisturbed soil core samples. The distribution included two cores selected per agricultural plot per topographic position and one core per remaining land use type per topographic position for each watershed. This number of undisturbed soil cores was chosen to match our logistical capabilities, as only one set of twenty-four stainless steel core samplers was available to obtain accurate bulk density and moisture measurements. In addition, the limited accessibility of transport services in the vicinity of the sampling sites had a significant impact on the quantity of samples collected. This was due to the increased logistical costs associated with transporting the samples back to the laboratory facilities. These factors were crucial in determining the scope and scale at which sampling could be executed in a feasible manner. Five subsoil samples were collected from each land use at the four corners and centre of the plot to create a single composite soil sample following standard procedures. Each composite soil sample was stored in a well-labelled polythene bag and transported to the national soil laboratory for analysis.
2.3. Laboratory analysis
The soil samples collected from three land use types located within the three topographic positions of the conserved and non-conserved micro-watersheds were air-dried and ground to pass through a 2 mm sieve. The selected soil properties were analysed at the national soil laboratory following standard laboratory procedures. The soil bulk density (BD) was measured from undisturbed soil samples collected with core samplers. Thus, to measure the BD, the core sampler’s soils are dried in an oven at 105 °C until two successive weights are the same (Margesin & Schinner, Citation2005). The total soil porosity was computed using equation No. 1, for which the particle density of 2.65 gcm-3 and the value of BD are required (Sarkar, Citation2005).
(1)
(1)
Particle-size distributions were analysed using the Bouyoucos hydrometer method (Estefan et al., Citation2013). The USDA textural triangle was employed to determine soil textural class. Soil pH is determined by a glass electrode with a soil/water ratio of 1:2.5 (Sarkar, Citation2005). The soil organic carbon (SOC) was determined following the Walkley Black wet digestion method (Sarkar, Citation2005). The soil organic matter was calculated by multiplying the percent SOC by a factor of 1.724. The total nitrogen level in the soil was determined following the modified Kjeldahl’s method (Sarkar, Citation2005). Available phosphorus (Av.P) was measured following the Olsen method (Olsen, 1954). Electrical conductivity (EC) was determined for soil: water suspensions in a ratio of 1:2.5 (Sarkar, Citation2005). Cation-exchange capacity (CEC) and exchangeable bases (Ca2+, Mg2+, K+, and Na+) were determined by the ammonium acetate method at pH 7 (Sumner & Miller, Citation1996). Percentage base saturation (PBS) was computed by dividing the sum of exchangeable bases by the amount of CEC.
2.4. Method of data analysis
Before conducting any statistical evaluations, we tested the normality of all datasets. A one-way analysis of variance (ANOVA) was then performed using a general linear model to determine whether there were significant differences in soil properties across various land use types and topographic positions within conserved and non-conserved micro-watersheds. For datasets that did not conform to normality requirements, Brown-Forsythe statistics were employed owing to their robustness in testing the equality of means (Field & Miles, Citation2009). Furthermore, post-hoc comparisons among means were conducted using the Tukey HSD test at a significance level of p < 0.05. Additionally, the Pearson correlation coefficient was utilized to aid in data analysis. All statistical analyses were performed using SPSS software, version 24.
3. Result and discussion
3.1. Effect of topographic position and land use types on soil physical properties
3.1.1. Soil textural fraction
The sand and clay soil fractions in both the non-conserved and conserved micro-watersheds did not vary significantly, while the silt content varied significantly (P < 0.05) with respect to topography (P < 0.05) (). On average, the proportion of clay and silt fractions was higher and lower in the lower topographic position, respectively, for both non-conserved and conserved micro-watersheds (). This may be due to the translocation of clay fractions from higher to lower topography, leaving behind silt fractions. Similar spatial patterns in clay fractions have been observed in previous studies by Hailu et al. (Citation2012) and Mengistu et al. (Citation2016) in the Anjeni watershed of the Upper Blue Nile and the Goromti watershed in western Ethiopia, respectively. The silt content of the soils increased as elevation increased, and this difference was statistically significant. Sinore et al. (Citation2021) and Dessalegn et al. (Citation2014) found similar patterns in the southern Ethiopian watersheds of Hobicheka and Ele, reporting an increase in silt fraction with elevation. They explained this as the removal of fine soil particles from steeper upper slopes and their deposition on lower slopes.
Table 1. Effects of land-use types and topographic positions on soil physical properties (mean ± standard error) in selected micro-watersheds of the Central Highlands of Ethiopia.
The soil textural fractions in the conserved and non-conserved micro-watersheds varied significantly (p < 0.05) with respect to land use types, except for the sand soil textural fraction in the conserved micro-watershed. Across different land use types, the textural class of all soils was clay loam, except for the agricultural land, which had a clay textural class due to its high clay content compared to other land use classes () in both micro-watersheds. The agricultural land had the lowest sand (24.92%) and silt (27.5%) contents in the non-conserved and conserved micro-watersheds, but it had the highest clay fraction of 46.31% and 42.25%, respectively, compared to forestland and grassland. This could be attributed to the systematic arrangement of land uses and micro-site variability within the micro-watersheds (Haile et al., Citation2022). In the studied micro-watersheds, most of the forestland was located at the upper elevation of the steep slope, while agricultural land was located at the lower elevation. This resulted in higher clay fractions in agricultural land due to the selective transport of fine particles from the upper and middle elevations to the lower elevations. Another factor contributing to the clay content in agricultural land is frequent ploughing, which accelerates weathering, breaks up the soil, and affects moisture, aeration, and temperature (Haile et al., Citation2022). In the Gambo district of Shashamane, Lemenih et al. (Citation2005) observed that prolonging the cultivation time from seven years to 53 years increased the clay and silt fractions while decreasing the sand fraction. Therefore, forest and grassland, which are typically found on steep slopes and river sides, have lower clay content.
The comparative analysis revealed that the mean proportion of clay within the non-conserved micro-watershed in the lower topographic position of agricultural land was significantly higher (p < 0.05) than in the conserved counterpart, particularly when contrasted with the sand and silt fractions (). This disparity in clay content can be primarily linked to the duration of management practices applied to the conserved watershed. Specifically, it has been under conservation measures for less than 15 years, a period deemed insufficient for promoting significant weathering and subsequent accumulation of finer particles (Zeng et al., Citation2014). Moreover, the implementation of watershed management strategies initially targeted a considerably more degraded area with the aim of mitigating further environmental degradation compared to a control micro-watershed. This strategy was confirmed through data obtained from Becho District Natural Resources Department (Citation2021). This finding is consistent with the results of Yimer et al. (Citation2006). Additionally, there was no statistically significant variation in sand and silt soil fractions between the micro-watersheds. This could be attributed to the homogeneity of soil-forming processes and the similarity of parent materials in soil texture between nearby sites (Foth, Citation1990). The proportion of soil textural fractions was relatively more balanced in the conserved micro-watershed compared to the non-conserved micro-watershed, likely due to the management practices in place. This finding is consistent with those of Mulugeta and Karl (Citation2010), Mohawesh et al. (Citation2015), and Alemayehu and Fisseha (Citation2018), who found that non-conserved micro-watersheds in the Farta woreda (South Gonder), Mediterranean climate, and Mecha woreda (West Gojam) had the highest mean values of clay and silt fractions, respectively.
3.1.2. Bulk density and total porosity
The overall soil bulk density (g cm−3) and total porosity (%) across all land use types and topographies showed no significant difference for both conserved and non-conserved micro-watersheds (). However, there was a marginally higher bulk density (1.22 g cm−3) and lower porosity (53.86%) in the non-conserved micro-watershed of agricultural land compared with the rest of the land use types. This could result in lower soil quality as compaction could occur and result in non-favourable aeration. The highest soil bulk density and lower soil total porosity in agricultural land in non-conserved micro-watershed were attributed to the reduction of organic matter and the effect of compaction from human and animal traffic (Khresat et al., Citation2008). Similarly, the highest bulk density (1.22 g cm−3) and lower total porosity (53.85%) were found in agricultural land in the conserved micro-watershed, respectively. A lower organic carbon exhibited in agricultural land in both micro-watersheds compared to the rest of the land use types would be the cause of higher bulk density and lower total porosity. Consistent with our result, studies from other sites also recorded considerably higher bulk density in agricultural land (Moges & Holden, Citation2008, Chaurasia et al., Citation2023), attributing to compaction resulting from intensive cultivation and continuous tillage operations, which in turn lower soil organic carbon through rapid mineralization of soil organic matter. In all land use types except forestland, the bulk density of the conserved micro-watershed was lower compared with the non-conserved micro-watershed. This would be due to the different management practices in the conserved micro-watershed that affect soil organic carbon, total nitrogen, and water content, which directly or indirectly reduce soil bulk density (Chaurasia et al., Citation2023).
With respect to topography, a marginally higher bulk density (1.25 g cm−3) and lower porosity (52.67%) were found in the lower topography of the conserved micro-watershed, while the highest bulk density (1.24 g cm −3) and lowest porosity (53.17%) were found in the upper position of the non-conserved micro-watershed (). Due to management practice in the sloping area of the higher topography, which prevents fine particles and organic matter from moving downward, the lower topography of the conserved micro-watershed has a lower porosity and a higher bulk density. Conversely, the distinctive movement of organic matter and fine soil particles from the higher topography to the lower, where they were deposited, provides an explanation for the situation in the non-conserved micro-watershed. This resulted in an increase in soil bulk density and a reduction in porosity on the upper topography of the non-conserved micro-watershed. The result is also supported by Retta et al. (Citation2022), Hailu et al. (Citation2012), and Khan et al. (Citation2013) who found higher bulk density and lower porosity in higher topography.
In general, the bulk density (BD) of micro-watersheds does not impede root penetration. This is due to the fact that the determined BD of micro-watersheds was within the permissible range of 1.0 to 1.4 g cm-3 (Peverill et al., Citation1999). However, if they are not properly managed, there is a risk of becoming compressed. The soil physical properties considered in this study do not exhibit variability as a result of dynamic interactions between land use types and topography in both micro-watersheds ().
Table 2. The interaction effect of topographic position and land use type on soil physico-chemical properties in selected micro-watersheds of the Central Highlands of Ethiopia.
3.2. Effect of topographic position, and land use types on soil chemical properties
3.2.1. Soil pH and electrical conductivity (EC)
Land use types, but not their interaction with topography in conserved micro-watersheds, had no significant (p < 0.05) effect on pH and EC in both micro-watersheds ( and ). Among the studied land use types, forestland (6.62 for non-conserved and 6.25 for conserved) had the highest pH, while grassland (5.96) in the non-conserved and agricultural land (6.01) in the conserved micro-watersheds exhibit the lowest pH value compared to the other land use types. The EC pattern with respect to land use types also followed a similar trend with pH. The highest pH values in forestland of each micro-watershed were expected due to the underlying parent materials of this land use type, which are highly calcareous in nature and are associated with higher pH values (Kahsay et al., Citation2023). On the other hand, the lowest pH value in agricultural land of conserved and grassland of non-conserved micro-watersheds might be attributed to the lower concentration of total exchangeable bases in these land use types. This study is in agreement with the findings of Warra et al. (Citation2015), who concluded that cultivated lands have the lowest mean pH value due to the loss of basic cations during crop harvest and runoff erosion in the Kasso catchment of the Bale Mountains. Furthermore, increased microbial oxidation might also generate organic acids that add H+ to the soil solution and reduce soil pH. However, compared to the other two land uses, forestland had higher pH values, probably due to vegetation restoration in degraded areas, a reduction in erosive loss of base-forming minerals, and comparatively better recycling and decomposition-induced release of basic nutrients ().
Table 3. Effects of land-use types and topographic position on soil pH, EC, SOC, TN, C:N ratio, and Av. P (mean ± standard error) in selected micro-watersheds of the Central Highlands of Ethiopia.
With regard to topographic position, except for its interaction with land use type, topographic position had a significant (p < 0.05) effect on pH and EC values in each micro-watershed. The highest pH and EC values (6.88 and 0.17 ds/m for non-conserved and 7.01 and 0.17 ds/m for conserved) were observed in the lower topographic position, while the lowest values were observed in the upper topographic position (5.6 and 0.08 ds/m for non-conserved and 5.87 for conserved) ( and ). The highest soil pH and EC values in the lower topographic positions of both micro-watersheds may be attributed to the accumulation of bivalent cations (Ca2+ and Mg2+) eroded from the higher and middle elevations to the lower area. When basic materials are added to soil, the added Ca2+ and Mg2+ cations exchange with H+ ions on the exchange sites, resulting in an increase in the pH and EC of the soil (Smith & Doran, Citation1997). This finding is consistent with the results of Asmamaw and Mohammed (Citation2013) and Amare et al. (Citation2013), who conducted their research in the Gerado Catchment of the north-eastern and Anjeni watersheds of the central highlands of Ethiopia. Those studies also found the highest concentration of pH and EC at the bottom topographic position of the landscape.
The overall mean pH and EC values did not have a statistically significant difference (p ≤ 0.05) between the two micro-watersheds (). However, though not significant, the soil in the non-conserved micro-watershed areas had a relatively higher pH (6.32) and EC (0.12 ds/m) compared to the conserved one. This suggests that watershed management practices had a minimal impact on these parameters. The lower mean soil pH value in the conserved micro-watershed can be attributed to the removal of crop residues and continuous cultivation before implementing management practices. The type of parent materials, extent of soil erosion, and leaching of base cations may also contribute to the lower mean soil pH in conserved agricultural lands. In general, the mean pH value of both micro-watersheds is slightly acidic (Osman, Citation2013). Therefore, it is important to closely monitor and prevent further acidification of the soil in the watersheds. If no action is taken to reverse this trend, the soil will eventually become infertile over time. The Pearson correlation () also demonstrated a direct relationship between EC and pH, indicating that higher pH values correspond to higher EC values. Therefore, the contributing factors to pH and EC distribution in the selected micro-watersheds are likely to be similar. This finding is consistent with previous studies by Abegaz et al. (Citation2020), Dagnachew et al. (Citation2020), and Mengistu et al. (Citation2016) who reported lower mean pH in conserved watersheds compared to non-conserved ones in the Kabe Watershed of the Were Ilu district, the Geshy sub-catchment of the Gojeb River catchment, and the Anjeni Watershed of the Upper Blue Nile, respectively. Mulugeta and Karl (Citation2010) discovered greater soil pH in conserved fields compared to non-conserved fields in Farta woreda of South Gonder, despite the fact that the difference was not statistically significant. However, Hailu et al. (Citation2012) demonstrated a significant difference in soil pH between farms conserved with fanya juu and non-conserved farms in the Goromti watershed of western Ethiopia.
Table 4. Pearson correlation coefficients between soil properties in 0–30 cm depth in the studied micro-watersheds.
3.2.2. Soil organic carbon (SOC), total nitrogen (TN), carbon to nitrogen ratio (C:N) and available phosphorus (Av.P)
In the non-conserved micro-watershed, there was significant variations in SOC, TN, and Av. P but not in the C:N ratio among the three different land use types. Additionally, an interaction effect was observed between land use types and elevation for SOC and TN ( and ). In this micro-watershed, the mean SOC content ranged from 1.62% to 3.09%. Multiple comparisons of SOC revealed that forestland and grassland had significantly higher SOC levels (P < 0.05) compared to agricultural land in the same micro-watershed. The mean value of TN ranged from 0.15% to 0.25%, displaying a similar pattern with SOC, as SOC influences nutrient retention and supply (Wang et al., Citation2001). Although the mean value of the C:N ratio did not show significant variation among the three land use types, it followed a similar pattern with SOC and TN. The highest and lowest C:N ratio values tended to occur in forestland (12.56) and agricultural land (10.79), respectively. In contrast to SOC, TN, and C:N ratios, Av. P demonstrated the highest mean value (5.13 ppm) under agricultural land and the lowest (1.94 ppm) under grassland within the non-conserved micro-watershed. Multiple comparison analyses of Av. P in this micro-watershed confirmed that agricultural land had significantly (P < 0.05) higher Av. P levels compared to the other land use types.
In the conserved micro-watershed, there were significant differences in SOC and C:N ratio among the three land use types, but not for TN, Av. P, or the interaction term at P < 0.05. The mean SOC value ranges from 1.68% in agricultural land to 3.32% in grassland within the conserved micro-watershed (). In agricultural land, the mean values of SOC and C:N ratio were 1.68% and 11.02 in the conserved micro-watershed, respectively. These parameters were significantly higher in grassland, with mean values of 3.32% and 13.88, respectively. Soil under forestland and grassland showed increased SOC content of 44% and 49.40%, respectively, compared to agricultural land. Although TN content was higher in forestland compared to other land use types, there was no statistically significant difference at P < 0.05, matching the SOC distribution. Land conversion from agricultural land to forestland or grassland resulted in an overall increase in SOC and TN content. Av. P did not show a statistically significant difference (P < 0.05) among different land use types, with the highest and lowest values found in grassland and forestland, respectively.
In both micro-watersheds, grassland and forestland exhibited higher levels of SOC and TN compared to agricultural land. This can be attributed to lower levels of organic matter in agricultural land, which result from reduced organic inputs and increased decomposition due to higher soil temperatures and tillage-induced soil mixing (Wang et al., Citation2001, Yimer et al., Citation2007). Harvesting crop residue and using it for purposes such as animal feed, construction material, and fuel wood further reduces the amount of biomass that can be returned to the soil, leading to reduced SOC in agricultural soil (Duguma et al., Citation2010). Grasses and woodlands, present in uncultivated land, act as natural barriers against erosion and nutrient loss (Gong et al., Citation2007). Livestock waste in grassland and forestland also contributes to higher levels of SOC and TN, as animals spend time grazing and leaving their waste on the land, which is solubilized by rainwater and mixed with the soil (Duguma et al., Citation2010). The decomposition of shrubs and herbaceous undergrowth in forestland also contributes to increased SOC and TN. In non-conserved micro-watersheds, agricultural land exhibits higher levels of Av. P compared to forestland, while in the conserved micro-watershed, grassland had higher levels of Av. P. This can be explained by the fact that plants grown on forestland use phosphorus more quickly than cereal crops grown on agricultural land, leading to phosphorus depletion. Microbial activity in agricultural land also contributes to phosphorus immobilization. Agricultural land in both watersheds has the lowest C:N ratio, indicating faster nitrogen release and mineralization. Grassland and forestland, on the other hand, have higher C:N ratios, suggesting lower total nitrogen pools due to low mineralization. This aligns with the findings of Geissen et al. (Citation2009) in southeast Mexico. The C:N ratios in all land use types fall within the common range of 10–15, as described by Hazelton and Murphy (Citation2016), providing an ideal environment for microbial activities and nutrient release for crop plant uptake.
The effects of topographic positions on SOC, TN, C:N ratio, and Av.P were analysed. There were no statistical differences in these parameters based on topographic position in both micro-watersheds (). However, there were marginal variations in different topographic positions. In the non-conserved micro-watershed, the mean values of SOC, TN, and C:N ratio ranged from 1.88% to 2.4%, 0.17% to 0.2%, and 10.25 to 12.11, respectively. In the conserved micro-watershed, the mean values ranged from 2.4% to 2.76%, 0.2% to 0.24%, and 11.83 and 12.5, respectively. SOC, TN, and C:N ratio showed higher values in the upper position of the conserved micro-watershed and the middle position of the non-conserved micro-watershed, with the lowest values found in the lower position in both micro-watersheds (). Normally, soil nutrients, including SOC, nitrogen, and phosphorus, move from upper to lower positions due to runoff water (Raghubanshi, Citation1992, Amare et al., Citation2013). However, in this study, the trend was opposite, possibly due to local land management practices. The replanted sites in the conserved micro-watershed were located at higher elevations, reducing runoff and leading to a higher SOC, TN, and C:N ratio at the upper position. Additionally, the moderate slope gradient at the upper elevation reduced soil erosion, contributing to higher values of these parameters. Similar trends have been observed in previous studies in Taiwan and India (Raghubanshi, Citation1992, Tsui et al., Citation2004). In contrast, Av. P had the highest mean value in the lowest position in both watersheds, likely due to the application of phosphorus-containing fertilizer used on agricultural land. This finding is consistent with previous studies in Ethiopia that found higher Av. P values at lower slope positions (Moges & Holden, Citation2008, Amare et al., Citation2013, Dessalegn et al., Citation2014).
There was no statistically significant variation in overall SOC, TN, C:N ratio and Av.P between the conserved and non-conserved micro-watersheds (). However, the mean of SOC, TN, and C:N ratio were higher in the conserved micro-watershed than in the non-conserved one. This can be explained by the implementation of the management practices in the conserved area, which generates additional biomass from replanting activities and tree lucerne plant’s atmospheric nitrogen fixation (Terefe et al., Citation2020). This finding is consistent with previous studies conducted by Mulugeta and Karl (Citation2010), Masha et al. (Citation2021), and Sinore et al. (Citation2021), which found higher levels of SOC content in conserved areas as compared to non-conserved areas.
3.2.3. Cation exchange capacity (CEC), percent base saturation (PBS) and exchangeable cations (Ca2+, Mg2+, K+ and Na+)
CEC, Exchangeable Ca2+, Mg2+, and K+ did not show a statistically significant difference (P < 0.05) across the land use types, except exchangeable sodium (Na+) and PBS in the non-conserved micro-watershed (). None of these parameters were significant in the conserved micro-watershed (). In both micro-watersheds, the highest PBS (117% in the non-conserved and 98.8% in the conserved) was found in forestland, while the lowest (77.38% in the non-conserved and 74.38% in the conserved) was found in agricultural land. Similarly, the lowest value of exchangeable Na+ was found in the agricultural land of both micro-watersheds. Exchangeable Na+ was highest in grassland (0.8 Cmolc (+) kg−1 in the non-conserved and 0.69 Cmolc (+) kg−1 in the conserved) in both micro-watersheds. Although exchangeable K+, Ca2+, and Mg2+ did not vary significantly across land use types in both micro-watersheds, grassland had the highest exchangeable K+ (0.86 Cmolc (+) kg−1 in the non-conserved and 0.79 Cmolc (+) kg−1 in the conserved). The lowest exchangeable K+ was observed in agricultural land (0.71 Cmolc (+) kg-1) and forestland (0.76 Cmolc (+) kg-1) in the non-conserved and conserved micro-watersheds, respectively. Forestland and grassland had the highest and lowest levels of exchangeable Ca2+ in both micro-watersheds, while its value was higher in the land use of non-conserved micro-watersheds. Exchangeable Mg2+ in the non-conserved micro-watershed followed a similar trend for exchangeable Ca2+. However, grassland and agricultural land had the highest (6.66 Cmolc (+) kg−1) and lowest (5.49 Cmolc (+) kg−1) exchangeable Mg2+ in the conserved micro-watershed, respectively (). Exchangeable Ca2+ was the predominant basic cation in all land uses of both micro-watersheds, followed by Mg2+, K+, and Na+ in decreasing order. Grassland had the lowest exchangeable Ca2+ content, whereas forestland had the highest content. The current result confirms calcium degradation due to continuous crop cultivation, erosion, crop residue clearance, and overgrazing of the grasslands. Warra et al. (Citation2015) similarly confirmed the degradation of nutrients in the Kasso catchment of Bale Mountain in Ethiopia. Evidence has shown that land use differences do not affect soil CEC significantly, even though agricultural (in a conserved micro-watershed) and forest (in a non-conserved micro-watershed) land had a higher CEC and grassland in both micro-watersheds had a lower CEC. The higher soil CEC observed in forestland might result from the presence of high concentrations of exchangeable bases such as Ca2+ and Mg2+, as revealed through Pearson correlation (). During the discussion, farmers in the study area brought up the issue of understory forested areas spontaneously burning. Numerous studies have reported higher concentrations of Ca2+ and Mg2+ due to wood ash and other factors under the homestead land use system compared to other land uses in Ethiopia (Haileslassie et al., Citation2006, Duguma et al., Citation2010, Haile et al., Citation2022). As a result, the addition of ash to forestland’s soil would be another factor in the soil’s increased Ca2+ and Mg2+ levels, which would lead to an increase in CEC.
Table 5. Effects of land-use types and topographic positions on soil CEC, exchangeable base cations, and PBS (mean ± standard error) in selected micro-watersheds of the Central Highlands of Ethiopia.
The investigation found that exchangeable Mg2+, K+, and Na+ did not vary significantly by topographic position, except for CEC, exchangeable Ca2+, and PBS, which were significantly different (p < 0.001) in the conserved micro-watershed. In the non-conserved micro-watershed, CEC, Ca2+, Mg2+, and PBS varied notably, while Na+ and K+ did not vary by topographic position. Specifically, for both micro-watersheds, the mean exchangeable Ca2+, CEC, and PBS were higher in the lower position than in the middle and upper positions. Moreover, the mean exchangeable Na+ and K+ varied irregularly, with 0.49 Cmolc (+) Kg−1 and 0.71 Cmolc (+) Kg−1 in the lower, 0.63 Cmolc (+) Kg−1 and 0.82 Cmolc (+) Kg−1 in the middle, and 0.59 Cmolc (+) Kg−1 and 0.67 Cmolc (+) Kg−1 in the upper position in the non-conserved micro-watershed. Similarly, Mg2+ varied from 4.09 Cmolc (+) Kg−1 to 7.16 Cmolc (+) Kg−1, with the highest in the lower position to the lowest in the upper position of the non-conserved micro-watershed and the highest in the upper (6.65 Cmolc (+) Kg−1) and lower (5.86 Cmolc (+) Kg−1) in the middle position of the conserved micro-watershed, with no statistically significant difference across elevations ().
As evident from the results, the upper position has lower concentrations of Ca2+, Mg2+, and PBS compared to the lower position in both micro-watersheds. This explains the degradation of exchangeable cations in the upper topographic position and their deposition and accumulation in the lower elevation of the landscape. These findings are consistent with those of Amare et al. (Citation2013) and Tsui et al. (Citation2004), who also observed higher concentrations of Ca2+ and Mg2+ at lower elevations. Tsui et al. (Citation2004) suggested that soils can accumulate soluble ions such as Ca2+, Mg2+, K+, and Na+ from higher elevations and deposit them in lower positions, where leaching is weaker and soil enrichment is stronger. Similarly, the highest concentrations of exchangeable K+, Na+, and CEC were found in the lower position of the conserved micro-watershed, while in the non-conserved micro-watershed they were found in the middle position. This difference may be due to the higher surface level in the lower position class of the conserved micro-watershed, which leads to temporary water logging and increases the vulnerability of monovalent K+ and Na+ to leaching through the soil profile compared to other basic cations. The CEC values in the upper and middle positions of non-conserved and conserved micro-watersheds were found to be the lowest. This could be attributed to heavy rainfall causing cation leaching, particularly when combined with steep slopes. Additionally, the lower CEC value at higher elevations may be due to the decreased presence of the main interlayer cation (Ca2+), which can be attributed to erosive processes and inadequate organic matter management. A similar increasing trend of CEC values from higher to lower positions was observed in the Workamba Watershed in North Ethiopia by Bogale et al. (Citation2021), which was attributed to erosion and deposition processes.
The overall mean exchangeable Mg2+, Na+, K+, and PBS content of soils in the conserved micro-watershed was higher than in the non-conserved areas, though they were not statistically significant. In contrast, the concentrations of exchangeable Ca2+ and CEC were higher in the non-conserved micro-watershed. High clay fractions increase the CEC in soils (Selassie et al., Citation2015). Mulugeta and Karl (Citation2010) also acknowledged that exchangeable cations can be held in greater quantities in soils with higher clay fractions than in soils with lower clay fractions. Therefore, the greater clay fractions and higher Ca2+ in the non-conserved micro-watershed were the root causes of the elevated CEC.
4. Conclusions
This study aimed to assess the effects of watershed-scale management practices on the main soil properties across different land use types and topographic positions within the conserved (Urago) and non-conserved (Mende) micro-watersheds of Becho district, central Ethiopia. The majority of the investigated soil properties demonstrated no variability based on topographic position or land use type. However, in the non-conserved micro-watershed, significant variation was observed in the textural fraction (sand, silt, and clay), SOC, TN, Av. P, exchangeable Na+, and PBS among the different land use types. In the conserved micro-watershed, only the textural fraction (silt and clay), SOC, and C:N ratio were affected by land use types. The study found that sand content, exchangeable Na+, SOC, and TN values were much lower in agricultural land compared to grassland and forestland in both micro-watersheds. The study found that grassland and forestland had the greatest potential to enhance soil quality. Conversely, cereal cropping, the dominant practice, was responsible for the continuous loss of SOC and TN in the study area. Additionally, topographic positions were also found to influence the physical and chemical properties of soil in the micro-watersheds. Soil pH, EC, CEC, exchangeable Ca2+, and PBS were among the parameters demonstrated variation based on topographic positioning, with peak values noted in the lower positions across both studied micro-watersheds. With the exception of clay content, there was no significant differentiation in the investigated parameters between conserved and non-conserved micro-watersheds. This indicates that the efficacy of watershed management practices may be contingent upon the specific interventions implemented and the time required for the land to respond to disturbances. This may explain the minimal observed effect of these practices. The evaluation period for watershed management practices in this study was less than fifteen years. Given this timeframe, it is challenging to definitively ascertain the influence of these practices on soil property improvement within the area under investigation. Further research is essential to elucidate the complex interactions between topographic positions, types of land use, and soil properties in order to inform the development of effective, tailored soil resource management strategies.
Acknowledgement
The authors wish to acknowledge Addis Ababa University and Ambo University for its financial support and Ethiopian National soil laboratory for its laboratory analysis. In addition, the authors would like to acknowledge the local communities, Becho district administrators, and development agents for their valuable support during the data collection process by providing and collecting relevant information.
Disclosure statement
No potential conflict of interest was reported by the author(s).
Data availability statement
The corresponding author in this study is willing to provide the generated and analysed data upon reasonable request.
References
- Abegaz, A., Tamene, L., Abera, W., Yaekob, T., Hailu, H., Nyawira, S. S., Silva, M. D., & Sommer, R. (2020). Soil organic carbon dynamics along chrono-sequence land-use systems in the highlands of Ethiopia. Agriculture, Ecosystems & Environment, 300, 1. https://doi.org/10.1016/j.agee.2020.106997
- Adimassu, Z., Mekonnen, K., Yirga, C., & Kessler, A. (2012). Effect of soil bunds on runoff, soil and nutrient losses, and crop yield in the Central Highlands of Ethiopia. Land Degradation & Development, 25(6), 554–17. https://doi.org/10.1002/ldr.2182
- Alemayehu, T., & Fisseha, G. (2018). Effects of soil and water conservation practices on selected soil physico-chemical properties in Debre-Yakob micro-watershed, Northwest Ethiopia. Ethiopian Journal of Science and Technology, 11(1), 29–38. https://doi.org/10.4314/ejst.v11i1.3
- Amare, T., Terefe, A., G. Selassie, Y., Yitaferu, B., Wolfgramm, B., & Hurni, H. (2013). Soil properties and crop yields along the terraces and toposequece of Anjeni Watershed, Central Highlands of Ethiopia. Journal of Agricultural Science, 5(2), 134–144. https://doi.org/10.5539/jas.v5n2p134
- Amede, T., Geta, E., & Takele, b (2001). Reversing the degradation of arable land in Ethiopian Highlands. In Managing African soils. IIED.
- Asmamaw, L. B., & Mohammed, A. A. (2013). Effects of slope gradient and changes in land use/cover on selected soil physico-biochemical properties of the Gerado catchment, north-eastern Ethiopia. International Journal of Environmental Studies, 70(1), 111–125. https://doi.org/10.1080/00207233.2012.751167
- Badege, B. (2001). Deforestation and land degradation in the Ethiopian Highlands: A strategy for physical recovery. Northeast African Studies, 8, 7–26.
- Becho District Natural Resources Department. (2021). Socio-economic and natural resource report becho Woreda of 2020. Becho Woreda Natural Resource Department, Becho.
- Berihun, M. L., Tsunekawa, A., Haregeweyn, N., Dile, Y. T., Tsubo, M., Fenta, A. A., Meshesha, D. T., Ebabu, K., Sultan, D., & Srinivasan, R. (2020). Evaluating runoff and sediment responses to soil and water conservation practices by employing alternative modeling approaches. The Science of the Total Environment, 747, 141118. https://doi.org/10.1016/j.scitotenv.2020.141118
- Bogale, M., Wondie, G., & Shafi, A. (2021). Effects of campaign-based soil and water conservation practice on soil properties: The case of Workamba watershed, Debark District, North Ethiopia. Environment and Natural Resources Journal, 19(4), 292–301. https://doi.org/10.32526/ennrj/19/2020256
- Bojo, J., & Cassells, D. (1995). Land degradation and rehabilitation in Ethiopia. A Reassessment.‖ World Bank.
- Chaurasia, M., Patel, K., Bhadouria, R., & Rao, K. S. (2023). Spatial variability in soil physicochemical parameters across land use classes in the peri-urban landscape. Environment, Development and Sustainability,1–25. https://doi.org/10.1007/s10668-023-03653-8
- Dagnachew, M., Kebede, A., Moges, A., & Abebe, A. (2020). Land use land cover changes and its drivers in Gojeb River catchment, Omo Gibe Basin, Ethiopia. Journal of Agriculture and Environment for International Development (JAEID), 114, 33–56.
- Dessalegn, D., Beyene, S., Ram, N., Walley, F., & Gala, T. S. (2014). Effects of topography and land use on soil characteristics along the toposequence of Ele watershed in southern Ethiopia. CATENA, 115, 47–54. https://doi.org/10.1016/j.catena.2013.11.007
- Duguma, L., Hager, H., & Sieghardt, M. (2010). Effects of land use types on soil chemical properties in smallholder farmers of central highland Ethiopia. Ekologia, 29(1), 1–14. https://doi.org/10.4149/ekol_2010_01_1
- Ebabu, K., Tsunekawa, A., Haregeweyn, N., Adgo, E., Meshesha, D. T., Aklog, D., Masunaga, T., Tsubo, M., Sultan, D., Fenta, A. A., & Yibeltal, M. (2020). Exploring the variability of soil properties as influenced by land use and management practices: A case study in the Upper Blue Nile basin, Ethiopia. Soil and Tillage Research, 200, 104614. https://doi.org/10.1016/j.still.2020.104614
- Elias, E. (2016). Soils of the Ethiopian highlands: Geomorphology and properties CASCAPE project. ALTERA, Wageningen University and Research Centre (Wageningen UR), The Netherlands.
- Erkossa, T., Williams, T. O., & Laekemariam, F. (2018). Integrated soil, water and agronomic management effects on crop productivity and selected soil properties in Western Ethiopia. International Soil and Water Conservation Research, 6(4), 305–316. https://doi.org/10.1016/j.iswcr.2018.06.001
- Estefan, G., Sommer, R., & Ryan, J. (2013). Methods of soil, plant and water analysis: A manual for the West Asia and North Africa region (3rd ed.). International Center for Agricultural Research in the Dry Areas.
- Fenta, A. A., Tsunekawa, A., Haregeweyn, N., Tsubo, M., Yasuda, H., Kawai, T., Ebabu, K., Berihun, M. L., Belay, A. S., & Sultan, D. (2021). Agroecology-based soil erosion assessment for better conservation planning in Ethiopian river basins. Environmental Research, 195, 110786. https://doi.org/10.1016/j.envres.2021.110786
- Fenta, A. A., Yasuda, H., Shimizu, K., Haregeweyn, N., & Negussie, A. (2016). Dynamics of soil erosion as influenced by watershed management practices: A case study of the Agula watershed in the semi-arid highlands of Northern Ethiopia. Environmental Management, 58(5), 889–905. https://doi.org/10.1007/s00267-016-0757-4
- Field, A. P., & Miles, J. (2009). Discovering statistics using SPSS:(and sex and drugs and rock’n’roll) (3rd ed.). SAGE Publications.
- Foth, H. D. (1990). Fundamentals of soil science (8th ed.). John Wiley & sons.
- Geissen, V., Sánchez-Hernández, R., Kampichler, C., Ramos-Reyes, R., Sepulveda-Lozada, A., Ochoa-Goana, S., de Jong, B. H. J., Huerta-Lwanga, E., & Hernández-Daumas, S. (2009). Effects of land-use change on some properties of tropical soils—An example from Southeast Mexico. Geoderma, 151(3–4), 87–97. https://doi.org/10.1016/j.geoderma.2009.03.011
- Girmay, G., Singh, B. R., Nyssen, J., & Borrosen, T. (2009). Runoff and sediment-associated nutrient losses under different land uses in Tigray, Northern Ethiopia. Journal of Hydrology, 376(1–2), 70–80. https://doi.org/10.1016/j.jhydrol.2009.07.066
- Gong, J., Chen, L. D., Fu, B. J., & Wei, W. (2007). Integrated effects of slope aspect and land use on soil nutrients in a small catchment in a hilly loess area, China. International Journal of Sustainable Development & World Ecology, 14(3), 307–316. https://doi.org/10.1080/13504500709469731
- Haile, G., Itanna, F., Teklu, B., Agegnehu, G., & Wang, X. (2022). Variation in soil properties under different land use types managed by smallholder farmers in central Ethiopia. Sustainable Environment, 8(1), 2093058. https://doi.org/10.1080/27658511.2022.2093058
- Haileslassie, A., Priess, J. A., Veldkamp, E., & Lesschen, J. P. (2006). Smallholders’ soil fertility management in the Central Highlands of Ethiopia: Implications for nutrient stocks, balances and sustainability of agroecosystems. Nutrient Cycling in Agroecosystems, 75(1–3), 135–146. https://doi.org/10.1007/s10705-006-9017-y
- Haileslassie, A., Priess, J., Veldkamp, E., Teketay, D., & Lesschen, J. P. (2005). Assessment of soil nutrient depletion and its spatial variability on smallholders’ mixed farming systems in Ethiopia using partial versus full nutrient balances. Agriculture, Ecosystems & Environment, 108(1), 1–16. https://doi.org/10.1016/j.agee.2004.12.010
- Hailu, M. E., Ahmed, M. A., & Naji, T. A. (2022). Spatio-temporal variation on land use and land cover and its drivers under watershed management activities in Becho, Central Highlands of Ethiopia. Environmental & Socio-Economic Studies, 10(4), 22–34. https://doi.org/10.2478/environ-2022-0021
- Hailu, W., Moges, A., & Yimer, F. (2012). The effects of Fanya juu soil conservation structure on selected soil physical & chemical properties: the case of Goromti Watershed, Western Ethiopia. Resources and Environment, 2(4), 132–140. https://doi.org/10.5923/j.re.20120204.02
- Haregeweyn, N., Tsunekawa, A., Poesen, J., Tsubo, M., Meshesha, D. T., Fenta, A. A., Nyssen, J., & Adgo, E. (2017). Comprehensive assessment of soil erosion risk for better land use planning in river basins: Case study of the Upper Blue Nile River. The Science of the Total Environment, 574, 95–108. https://doi.org/10.1016/j.scitotenv.2016.09.019
- Hazelton, P., & Murphy, B. (2016). Interpreting soil test results: What do all the numbers mean? CSIRO Publishing.
- Hurni, H. (1988). Degradation and conservation of the resources in the Ethiopian highlands. Mountain Research and Development, 8(2/3), 123–130. https://doi.org/10.2307/3673438
- Hurni, H. (1993). Land degredation, famine, and land resource scenarios in Ethiopia. In D. Pimentel (Ed.), World soil erosion and conservation (pp. 27–62). Cambridge University Press.
- Kahsay, A., Haile, M., Gebresamuel, G., Mohammed, M., & Okolo, C. C. (2023). Dynamics of soil properties as impacted by contrasting lithology, slope class, and land use types: a case study in semi-arid highlands of northern Ethiopia. Environmental Monitoring and Assessment, 195(9), 1091. https://doi.org/10.1007/s10661-023-11706-8
- Khan, F., Hayat, Z., Ahmad, W., Ramzan, M., Shah, Z., Sharif, M., Mian, I. A., & Hanif, M. (2013). Effect of slope position on physico-chemical properties of eroded soil. Soil Environment, 32, 22–28.
- Khresat, S., Al-Bakri, J., & Al-Tahhan, R. (2008). Impacts of land use/cover change on soil properties in the Mediterranean region of northwestern Jordan. Land Degradation & Development, 19(4), 397–407. https://doi.org/10.1002/ldr.847
- Kirui, O. K., & Mirzabaev, A. (2014). Economics of land degradation in Eastern Africa. ZEF Working Paper Series.
- Lemenih, M., Karltun, E., & Olsson, M. (2005). Assessing soil chemical and physical property responses to deforestation and subsequent cultivation in smallholders farming system in Ethiopia. Agriculture, Ecosystems & Environment, 105(1–2), 373–386. https://doi.org/10.1016/j.agee.2004.01.046
- Liu, X., Herbert, S. J., Hashemi, A. M., Zhang, X., & Ding, G. (2006). Effects of agricultural management on soil organic matter and carbon transformation - a review. Plant, Soil and Environment, 52(12), 531–543. https://doi.org/10.17221/3544-PSE
- Margesin, R., & Schinner, F. (2005). Manual for soil analysis-monitoring and assessing soil bioremediation. Springer Science & Business Media.
- Masha, M., Yirgu, T., Debele, M., Belayneh, M., & Nayak, A. K. (2021). Effectiveness of community-based soil and water conservation in improving soil property in Damota Area, Southern Ethiopia. Applied and Environmental Soil Science, 2021, 1–11. https://doi.org/10.1155/2021/5510587
- Melaku, N. D., Renschler, C. S., Holzmann, H., Strohmeier, S., Bayu, W., Zucca, C., Ziadat, F., & Klik, A. (2017). Prediction of soil and water conservation structure impacts on runoff and erosion processes using SWAT model in the northern Ethiopian highlands. Journal of Soils and Sediments, 18(4), 1743–1755. https://doi.org/10.1007/s11368-017-1901-3
- Mengistu, D., Bewket, W., & Lal, R. (2016). Conservation effects on soil quality and climate change adaptability of Ethiopian watersheds. Land Degradation & Development, 27(6), 1603–1621. https://doi.org/10.1002/ldr.2376
- Moges, A., & Holden, N. M. (2008). Soil fertility in relation to slope position and agricultural land use: a case study of Umbulo Catchment in southern Ethiopia. Environmental Management, 42(5), 753–763.
- Mohawesh, Y., Taimeh, A., & Ziadat, F. (2015). Effects of land use changes and soil conservation intervention on soil properties as indicators for land degradation under a Mediterranean climate. Solid Earth, 6(3), 857–868. https://doi.org/10.5194/se-6-857-2015
- Mulualem, T., Adgo, E., Meshesha, D. T., Tsunekawa, A., Haregeweyn, N., Tsubo, M., Ebabu, K., Kebede, B., Berihun, M. L., Walie, M., Mekuriaw, S., & Masunaga, T. (2021). Exploring the variability of soil nutrient outflows as influenced by land use and management practices in contrasting agro-ecological environments. The Science of the Total Environment, 786, 147450. https://doi.org/10.1016/j.scitotenv.2021.147450
- Mulugeta, D., & Karl, S. (2010). Assessment of integrated soil and water conservation measures on key soil properties in South Gonder, North-Western Highlands of Ethiopia. Journal of Soil Science and Environmental Management, 1, 164–176.
- Osman, K. T. (2013). Soils: principles, properties and management. Springer Science & Business Media.
- Peverill, K., Sparrow, L., & Reuter, D. J. (1999). Soil analysis: an interpretation manual. CSIRO publishing.
- Raghubanshi, A. (1992). Effect of topography on selected soil properties and nitrogen mineralization in a dry tropical forest. Soil Biology and Biochemistry, 24(2), 145–150. https://doi.org/10.1016/0038-0717(92)90270-8
- Retta, M. A., Addis, H. K., Beyene, T. F., & Lisetskii, F. (2022). Impact of soil and water conservation measures and slope position on selected soil attributes at a watershed scale. Applied and Environmental Soil Science, 2022, 1–11. https://doi.org/10.1155/2022/9743511
- Sarkar, D. (2005). Physical and chemical methods in soil analysis. New Age International.
- Selassie, Y. G., Anemut, F., & Addisu, S. (2015). The effects of land use types, management practices and slope classes on selected soil physico-chemical properties in Zikre watershed, North-Western Ethiopia. Environmental Systems Research, 4(1), 7. https://doi.org/10.1186/s40068-015-0027-0
- Sinore, T., Doboch, D., & Clemente, R. (2021). Effects of soil and water conservation at different landscape positions on soil properties and farmers’ perception in Hobicheka sub-watershed, Southern Ethiopia. Applied and Environmental Soil Science, 2021, 9295650. https://doi.org/10.1155/2021/9295650
- Smith, J. L., & Doran, J. W. (1997). Measurement and use of pH and electrical conductivity for soil quality analysis. Methods for Assessing Soil Quality, 49, 169–185.
- Spaargaren, O. C., & Deckers, J. (1998). The World reference base for soil resources: An introduction with special reference to soils of tropical forest ecosystems. Pages 21-28 in Soils of tropical Forest ecosystems: Characteristics, ecology and management. Springer.
- Sumner, M. E., & Miller, W. P. (1996). Cation exchange capacity and exchange coefficients. In D. L. Sparks (Ed.), Methods of soil analysis: Part 3 Chemical methods (pp. 1201–1229). Soil Science Society of America.
- Terefe, H., Argaw, M., Tamene, L., Mekonnen, K., Recha, J., & Solomon, D. (2020). Effects of sustainable land management interventions on selected soil properties in Geda watershed, central highlands of Ethiopia. Ecological Processes, 9(1), 1–11. https://doi.org/10.1186/s13717-020-0216-2
- Tsui, C.-C., Chen, Z.-S., & Hsieh, C.-F. (2004). Relationships between soil properties and slope position in a lowland rain forest of southern Taiwan. Geoderma, 123(1–2), 131–142. https://doi.org/10.1016/j.geoderma.2004.01.031
- Vancampenhout, K., Nyssen, J., Gebremichael, D., Deckers, J., Poesen, J., Haile, M., & Moeyersons, J. (2006). Stone bunds for soil conservation in the northern Ethiopian highlands: Impacts on soil fertility and crop yield. Soil and Tillage Research, 90(1–2), 1–15. https://doi.org/10.1016/j.still.2005.08.004
- Wang, J., Fu, B., Qiu, Y., & Chen, L. (2001). Soil nutrients in relation to land use and landscape position in the semi-arid small catchment on the loess plateau in China. Journal of Arid Environments, 48(4), 537–550. https://doi.org/10.1006/jare.2000.0763
- Warra, H. H., Ahmed, M. A., & Nicolau, M. D. (2015). Impact of land cover changes and topography on soil quality in the Kasso catchment, Bale Mountains of southeastern Ethiopia. Singapore Journal of Tropical Geography, 36(3), 357–375. https://doi.org/10.1111/sjtg.12124
- Yimer, F., Ledin, S., & Abdelkadir, A. (2006). Soil property variations in relation to topographic aspect and vegetation community in the south-eastern highlands of Ethiopia. Forest Ecology and Management, 232(1–3), 90–99. https://doi.org/10.1016/j.foreco.2006.05.055
- Yimer, F., Ledin, S., & Abdelkadir, A. (2007). Changes in soil organic carbon and total nitrogen contents in three adjacent land use types in the Bale Mountains, south-eastern highlands of Ethiopia. Forest Ecology and Management, 242(2–3), 337–342. https://doi.org/10.1016/j.foreco.2007.01.087
- Zeng, X., Zhang, W., Cao, J., Liu, X., Shen, H., & Zhao, X. (2014). Changes in soil organic carbon, nitrogen, phosphorus, and bulk density after afforestation of the “Beijing–Tianjin Sandstorm Source Control” program in China. CATENA, 118, 186–194. https://doi.org/10.1016/j.catena.2014.01.005