
 ?Mathematical formulae have been encoded as MathML and are displayed in this HTML version using MathJax in order to improve their display. Uncheck the box to turn MathJax off. This feature requires Javascript. Click on a formula to zoom.
Abstract
Food insecurity happens in both developing and developed countries. This paper addresses spatial and temporal patterns of food insecurity and its determinants factors. The study used explanatory and descriptive research methods. This data was originated from household survey of 229 respondents who were interviewed during March and April 2022. Households self-report result shows that 52 (22.7%) of the respondents were food secure and 177 (77.3%) were food insecure. Estimated household food insecurity access via household food insecurity access scale showed that 82.1% was uncertain on food supply whereas having preferences of the type of and insufficient feeds variety food was 86%, which means 14% of respondents’ feed sufficient variety and preferences food. The proportion of respondents’ foods that are not wanted and eating a limited variety of food was reported 83% this resulted due to inability to eat preferred food. In general, 77.33% of respondents were food insecure, which described based on food insecure scale 28.8% mildly, 25.1% moderately and 23.3% severely. Season of food in/security was identified corresponding food insecure season from mid of September to December 6 (3.2%), from beginning of January up to April 34(18.4%), and from first May to end of August 144 (78.3%) which shows food security is good during the harvesting season and declined its security level. The spatial trend of the food security problem was reviewed in different agro-ecology zone. 35% of mid highland and 65% of low land were reported as food insecure. Policy makers would strengthen the existing coping and adaptation strategies.
REVIEWING EDITOR:
1. Introduction
Food security can be defined by different scholars in many ways so that some of them are:- The meaning of food security has been a flexible concept over the years (El Bilali et al., Citation2020). According to FAO (Citation2021) food security means that all people need, at all times, physical and economic access to sufficient and nutritious food that meets their dietary needs and preferences and enables them to live healthy and active lives. Household food insecurity concept includes complications with the amount of food available, food uncertainty for supply and instability of food for consumption (Tutunchi et al., Citation2011). In other dimension food security defined in terms of fulfilling four components such as satisfactory food availability, sufficient access, appropriate utilization, and stability food (Bovell-Ammon et al., Citation2019). Food insecurity has been connected with numerous nutrition and health effects in both developing and developed countries (Bernard de Raymond et al., Citation2021).
Globally, and particularly across the African continent, food insecurity has been on the rise (Oluwole et al., Citation2023). From 8.3% (604.5 million) in 2014 to 11.9% (927.6 million) in 2020, extreme global food insecurity is increasing at a rate never seen before (A. Olutosin et al., Citation2021). The continent of Africa has the second-highest rates of food insecurity worldwide, both at moderate and concerning levels, after Asia. According to Fernandes and Samputra (Citation2022), there has been a concerning rise in the incidence of food insecurity, with figures jumping from 17.7% (203.5 million) in 2014 to 25.9% (346.6 million) in 2020. Compared to other sub-regions, North Africa has the least amount of food insecurity, with rates rising from 29.7% (65.1 million) in 2014 to 30.2% (74.5 million) in 2020 (Global Hunger Index, 2022).
According to the 2020 Global Food Security Index (GFSI) scores released by the Economic and Intelligence Unit, which benchmarks 32 African countries out of 113 total countries, most African countries, with the exception of those in North Africa, currently struggle with moderate (40–59.9/100) to weak (20–39.9/100) food security score levels. These nations are suffering greatly from hunger and food insecurity. About 83.3 percent (10 out of 12) of the countries in the weak score group are in Sub-Saharan Africa, indicating a significant issue with food insecurity in the region. Only four Sub-Saharan African countries were ranked among the lowest countries globally and in Africa with a weak food security index score, according to the 2020 GFSI results. Only four North African countries—Morocco, 62.0, Algeria, 61.8, Tunisia, 61.4, and Egypt, 61.1—and Sierra Leone, 37.0, Malawi, 36.7, Zambia, 36.6, and Sudan, 36.0—were ranked among the good (60–79.9/100) food security index score group.
According to the GFSI, Sub-Saharan Africa has the lowest overall food security environment in the world, scoring an average of 47 points in 2022. The region does the best on the Quality and Safety pillar (50.3) and the worst on the Affordability pillar (44.8) of the index’s four pillars. The region has serious concerns about access to cheap food because a sizable portion of the population lives below the global poverty line and there are insufficient food safety net policies in place. However, the Quality and Safety pillar has comparatively high scores when compared to other pillars.
Ethiopia has an overall food security environment score of 44.6, placing it 100th out of 113 countries in the index and 19th out of 28 Sub-Saharan African nations (Economist impact, 2022). Because to its high amounts of micronutrients and outstanding nutritional standards, it receives the best grade in the Quality and Safety pillar. The biggest issue facing Ethiopia is affordability; the nation finds it difficult to maintain stable prices or offer food safety-net initiatives to the large number of citizens living below the international poverty line. But the nation also has issues with sustainability, adaptation, and the availability pillar ().
Figure 1. Source: Adapted from global food security index, 2022.
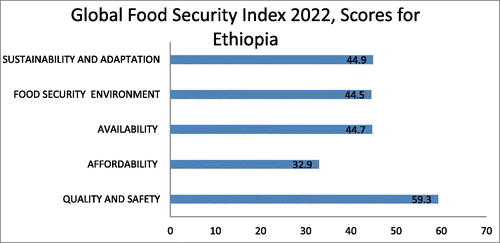
Ethiopia’s primary problem, as illustrated in , is lowering the cost of food for its people, even if the country has made success in reducing production volatility. Ethiopia does well in terms of micronutrient availability and nutritional standards in terms of quality and safety, but it has difficulty with dietary diversity. Considering the continuing civil war, the nation scores poorly on political and societal barriers to access. This problem is more extensive than issues with the food system, and in order to guarantee food availability and cost, it would be necessary to take targeted action and find a solution to enhance general security (Economist impact, 2022).
Food insecurity in Ethiopia specifically smallholders farmers has for a long time been a challenge (Alemu & Mengistu, Citation2019). The driving force like El Niño Southern Oscillation (ENSO) is the most prominent inter-annual climate variability on Earth with large ecological and societal impacts (IPCC, Citation2014). The driving force like ENSO results food insecurity and malnutrition, and shocked livelihoods of the vulnerable and poorest people in Ethiopia has been common problems (Ayal et al., Citation2023). For instance, in 2021 the Ethiopia government appealed to its international allies for emergency food aid to feed 10.2 million people. In addition, this special strategic plan provides nutrition programs for the local population, approximately 2.3 million people, including 400,000 severely malnourished children. A recent report indicates that 8.2 million vulnerable and food-insecure people obtained aid through the Productive Safety Net Programme (FAO, Citation2021).
Ethiopia is categorized globally as one of the most susceptible countries with regard to climate change/variability (Kassahun, Citation2009). This situation in Ethiopia is worsened, due to the developmental challenges that the country experiences, including widespread poverty, limited health services, environmental degradation, conflict and food insecurity (Feleke et al., Citation2005).
Shashogo district is one of exposed districts due to natural threats and climate change/variability (Mogos, Citation2016). However, there is no basic information of food insecurity and determinant factors of food insecurity. A very interesting aim of this work was to identify coping mechanisms among smallholders and to determine the exact proportion of food in secured level. Therefore, this article designed to fill this research gap. The objective of the study was to (1) analyse the spatial trends and patterns of the food security in different agro-ecological zones (2) assess the temporal variations of the food security (3) identify the coping mechanisms the households practice to minimize the impacts of food insecurity, (4) analyse the determents for the food (in) security by smallholder farmers in the study areas.
These studies describe in details problem of food in/security in different dimension. Also study extends on identifying determining the food security status of small holder farmers in Shashogo district in southern Ethiopia. In addition to that the study examines impacts of demographic and socio-economic factors that disturb food security in the district. The relevance of this study is that it serves as a reference source for other researchers conducting research related to small holder farmers in the district. This study will be a good basis for anyone interested in studying this field of study with related research topics. Significant of study is provided basic information for stockholders and small holder farmers. Limitations of this article is does not used climate parameters either present or future scenarios to identifying food insecurity.
2. Conceptual framework
Concept of food security emerged in 1974 by considering availability of food and stability of food price is main issues for basic food stuff. Though, the concept is broad, diversified and dynamic which, alters understanding of concept of food security in various ways due to in different geographical location, based on wealth status, socio-economic condition (Blanco & Consultant, Citation2012; FAO, Citation2021). Today the concept of food security defined as achieved by the unit of analysis shifted at household and individual level than from global and national level. According to IPCC (Citation2014) food security is defined as available and access for all people at any times to enough food to enable people perform their operational activity in good and healthy manner.
Study household food in/security status and its determinants are important for understanding of the theory of food security. The main hypothesis considered in this study includes: general explanations of food insecurity based on previous studies and models of food insecurity. Small holder farmers of household food security grants in this district to be produce sufficient food for their consumption whether own production, purchase food grain from market, sell livestock and others. Hence, household food security defined as the commutative good access and availability of food from different source of obtained.
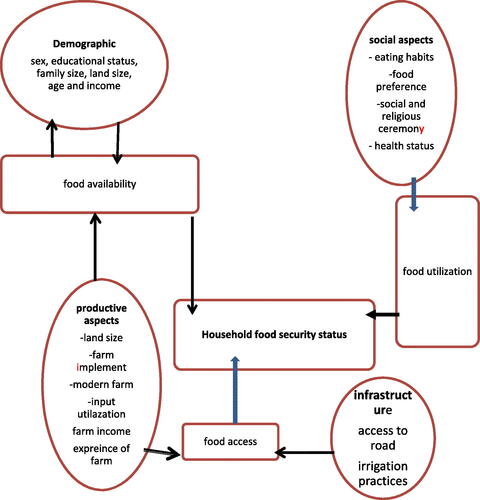
An analytical framework was developed based on the general terms of food security those contains four food security pillars such us availability, stability, access and utilization. The frameworks of Food security were incorporated with in determining factors household food security status. These consist of the demographic, productive asset, bio-physical, socio-cultural factors and infrastructural (). The results of the study contribute for identifying whether the small holder farmers are food secure or not in the study area. The interrelated components of among food security status of household and its determining factors are describes as follows flow chart:
Figure 2. Conceptual frames of food security and determinants factors.
Adapted source (FAO, Citation2015).
Food insecurity is reverse definition of food security. Food insecurity defined as all people at any time have not enough food, in sufficient available food and is not accessible? Due to high demands of peoples to having food for sustenance (Bovell-Ammon et al., 2019). The classification of food insecurity based on duration, intensity of the problem and strategies used to withstand the problem are classified either transitory or chronic it depends up on the intensity of food insecurity problem. Chronic food insecurity defined as ability to buy or produce enough food for their household consumption at a time this results due to lack of availability and access of asset or resources (Pradhan et al., Citation2013).
According to Bernard de Raymond et al. (Citation2021), food insecurity manifests itself due to market failures, which are mainly affected by recurrent droughts and various climatic factors. The temporary decrease in a household’s access to sufficient food as a result of instability in available food production is referred to as temporary food insecurity. And various described reasons for temporary food insecurity such as increased food prices, crop failures, temporary diseases, seasonal fluctuations and the sum of all factors lead to temporary food insecurity (FAO, Citation2021).
3. Methodology
Methodology is the branch of philosophy that examines the principles and procedures of inquiry in a particular discipline (Kelley and Maxwell, Citation2003). In this sub topic describe study area, method data collection and method data analysis.
3.1. Study area
Shashogo Woreda is located in Hadiya zone central Ethiopia between latitudes 7° 23’6.5’’N to 7° 23’33’’N,36° 51’24’’E to 37° 17’18’’E. Wereda is found in east of Hosanna which far from capital city of Hadiya zone by 54 km and 226 km south of Addis Ababa the Capital city of Ethiopia. Shashogo district is one among fourteen district and one town administration of Hadiya Zone which is surrounded in North and North - East by Zone of Silte, in South by Zone of Kembata T,Lemmo Districts in the West, Halaba zone in the East and in South - West by Anni Lemo District ().
Figure 3. Map of study area.
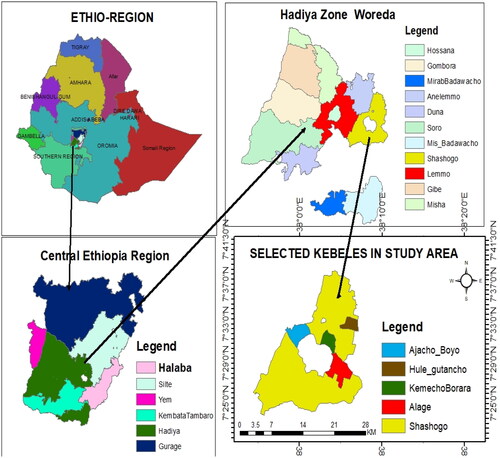
Shashogo Woreda contains 36 kebeles and two small municipalities. The two small municipalities are Bonosha and Doesha. Bonosha is an administrative town of Shashogo Woreda. According to 2007 National and Housing census Population of Population, the population of the district is about 116,287 and from this 56,167 (48.3%) are males and 60120 (51.7%) are females (Ethiopia Population Census, Citation2007).
Shashogo district is classified based on agro-ecologically as lowland and mid lowland. The mean annual rainfall differs from 557 to 1,535mm whereas an annual mean temperature varies from 17°C to 20°C. The district receives a two season’s rainfall in a year which the Belg (short rain seasons) rainy season is from half of March to half of May whereas July to September is the major rainy season in a year. June to September is the long rainy season in a district, which agricultural product production and its activity is very high in the study area. Ranges of total annual rainfall are 1005.1 mm recorded (Mogos, Citation2016).
The ranges of altitude roughly estimated from 1876 to 2257 m above to sea level. The district has an agriculturally suitable land in terms of soil types and good climatic condition. There are five soil types in the district such as vertisol, chromic luvisol, eutric vertisol, and lithic leptosol. From this vertisol is mainly dominant soil in the area which covers almost whole area of Shashogo district (Abinet Tadesse, Citation2011).
Water resources are vital for irrigational purpose (Kundzewicz et.al, Citation2007). The district has seasonal and perennial Flow Rivers such as Merancho, Metenichoso, Gudar, and Bilate. All rivers are seasonal except, Bilate is Perennial River. Volume of water declines in Bilate River flow in the course of dry season. In general some studies indicate water resource in Shashogo district is shallow and decreasing. Boy is one of largest lake and swamped area in district its coverage 3,210 hectares land (Destaye Gobena, Citation2009). This Lake use for ecosystem regulation and livestock rearing yet and so.
The most livelihood activity predominant in this study area are livestock rearing and crop farming which means agricultural activity is dominates. Rain fed agricultural activity most common whereas with respect to area coverage maize, wheat, teff, millet, and sorghum are the dominant crops and in addition to this pepper is spice group but its coverage in area of cultivates is second than Maize crop. Cultivable land coverage estimated 50% of the land is maize in a district. The main cash crop is pepper in the area. The district is suitable for some of fruit trees like papaya, mango, avocado, and orange and coffee which are perennials (S. Chufamo et al., 2008).
Drought and flood affect district for several times among in SNNPR districts as the result of this rearing of livestock and it production is poor. In addition to this human population pressure highly increases in expansion of farm land by decreasing commonly grazing land which results poor livestock production. Vital fodder resources for livestock are crop residues (SWLRM, 2022). Some of the livestock types in a Shashogo district are sheep, cattle, horse, goat, donkey, chicken and mule. Mule, donkey and horse provide service of transport whereas other provides as a source of food, retail meat and supply of milk to their household consumption and sold. Overall livestock in district essential asset, good for generating income and enhancing soil fertility through provided that manure for recycling nutrient on the farms.
3.1.1. Land use pattern
Understanding land size is very important for agricultural production. In study district total land size is 35,329hectares. From this cultivable land is highly increased by the factor of 46.5% which means initial in 1973, 4,516.92 hectares now it is 16,425.63 hectares (Destaye Gobena, Citation2009). However grazing area, wet land, Bush cover, bare land extremely decreased in addition to that Water bodies and Swamp area decreased due to high sedimentation see it details in .
Table 1. Description of land coverage.
3.2. Methods
3.2.1. Sampling techniques
This study employed multistage sampling techniques. In the initial step, district of Shashogo was selected from fourteen districts in Hadiya zone purposely reason for this is a district is severely affected by extreme climate change/variability and climate related risks. District of Shashogo is characterized by two distinct agro-ecological zones, midland and lowland. Next randomly selects two kebeles from each crucial stratified two agro-ecological zones in total four kebeles were selected from the total of 36 rural kebeles in the woreda see in details in . In third step the sample size determination is based on probability proportional sampling method was applied and pulls the sample households from each agro-ecological zone in each Kebele. Fourth step household head list was obtained from each Kebele administration office then done stratified into poor, medium and better-off and at the end household heads selected by using simple random sampling technique.
Table 2. Distribution of sample size based on agro-ecology.
Total sample size obtained by applying probability proportional for this study were 229 sample households, for responding questionnaires during survey periods (March and April 2022).
To determine the sample size, formula provided by Kothari (Citation2004) was employed. In this study for obtaining required sample size was used Kothari formula based on confidence level 95%, variability level by 5% degree and precision level at 6%. According to these scholars the maximum acceptable precision level is less than 10% so that in this study 0.6% precision level applied.
N represents total population, n is sample size and e is acceptable error values.
229 is total sample size in study cite, whereas sample size in each Kebele determine based with referring proportion of total populations.
3.2.2. Data source and type
The sources of data were both secondary and primary. The primary sources of data were generated from household survey, group discussions, key informant interviews and field observations. The primary data includes demographic, institutional, socioeconomic activities and biophysical attributes of the respondents. In addition to those information on food security level smallholder farmers, opportunity and the constraints to assured food security. For household-level data collection were based on open and close-ended survey questionnaire. In addition to generating complementary ideas, eight focus group discussions were conducted and twelve Key informants interviews. Secondary data were collected from documents, reports and literature reviews.
3.2.3. Data analysis
The research methods were descriptive and explanatory methods designed to addresses food insecurity level in smallholder farmer and its determinants factors in the study area. The progression of smallholder farmer with food security directly related with socio-economic and demographic features of the households (FAO, Citation2021; Mekonnen et al., Citation2021). Consequently, researcher apply multidimensional ways of analysing method to attain aim of dissertation objective which means identifying food in/security of households.
There are several methods to study access to household food insecurity. In this study household food insecurity access scale was designed to classify the households into food secure and insecure groups then to classify the food insecure groups further into mildly, moderately and severely food insecure households. The household food insecurity access scale have nine items questionnaire which initial developed for developing country (A. Olutosin et al., Citation2021) it presented in and questions designed for respondents based on three elements of food insecurity, those respondent food supply uncertainty, quality of food insufficient it expresses in terms of preferences and variety food and having insufficient food (Coates et al., Citation2007).
Table 3. Availability of food to household in the last a month (HFIAS).
Analysed using the frequency of occurrences (rarely if once or twice, sometimes- if three to ten times, or often- if more than ten times). The responses are computed from responses of households on the nine HFIAS generic questions. The responses or perceptions of households (on supply, quality, and uncertainty) against the questions (e.g. whether any adults in the household had to eat less than they thought they should, whether respondents worried about household’s food run out etc) are summarized in a scale to provide a continuous indicator of the degree of a households food security. The food security status of households is thus categorized based on the cut off points on the scale (Dessale, Citation2020).
First, a HFIAS category variable is calculated for each household by assigning a code for the food insecurity (access) category in which it falls. The maximum score for a household is 27 (the household response to all nine frequency-of-occurrence questions was ‘often’, coded with response code of 3); the minimum score is 0 (the household responded ‘no’ to all occurrence questions. The higher the score, the more food insecurity (access) whereas lower the score, the less food insecurity (access) a household experienced.
Using the cut-off point on the scale, food secure and insecure households were distinguished based on the continuous whole numbers of HFIAS value. There is no universal cut-off point to divide households into food secure and insecure. According to certain studies, the HFIAS 17 should be used as the starting point for binary household classification (FAO, Citation2008a). However, research by Garedew Dinku (Citation2017) and Maxwell (2013) include households that are food secure and slightly food insecure together as ‘food secure,’ while households that are moderately and severely food insecure are grouped together as ‘food insecure’. The HFIAS score of ≥17 was utilised as a cut-off point divide the study households into food secure and food insecure groups, based on research done in Mozambique by the Food and Agriculture Organisation (FAO, Citation2008b). Households with an HFIAS score of 17 or more were classified as food insecure, while those with a score of less than 17 were classified as food secure. Multivariate ordered logit model is employed when the dependent variables has >2 categories otherwise a binary logistic regression was fitted to the dichotomous dependent variable (A. Olutosin et al., Citation2021). To determine the impact of explanatory variables, a binary logistic regression was fitted to the dichotomous dependent variable coded based on cut off point divided either food insecure or food secure (N. Fumane, Citation2014).
Calculate the Household Food Insecurity Access category for each household. 1 = Food Secure, 2 = Mildly Food Insecure Access, 3 = Moderately Food Insecure Access, 4 = Severely Food Insecure Access
Percentage of households that fall in each food insecurity (access) category
3.2.4. Econometric analysis
Based on previous empirical studies indicates varies factors able to affect households food security, for instance household size, farmland size, income level, application of fertilizer, livestock ownership, status of education of household heads and different source of financial provision to the agricultural sector were recognised as the important determining factors of food in/security (Deressa, Citation2005; FAO, Citation2008a; Gitz & Meybeck, Citation2016; Ingutia & Sumelius, Citation2022; Mendelsohn & Kurukulasuriya, Citation2007; Yadav et al., Citation2018; Ziervogel & Ericksen, Citation2010). According to Ingutia and Sumelius (Citation2022) living for a long time with farm activity, income generating from off-farm activity, water and soil conservation practices were identified as important determinants factors of food security.
Some parameters have been assumed as determinant agents of food security such as sex, age level, family size, education status, land holding size, income generation from nonfarm activities, access to expert services, usage of fertilizer, ownership of livestock, use of small scale irrigation and access to credit affect as positively or negatively households food security.
Binary logistic regression model: Binary logistic regression model was used in this study to identifying determinants factors of food security. Household status of food either security or insecurity is dependent variable whereas determinants factors are independents variables. The status of food security has been treated as a dichotomous response variable by taking 1 for the food secured households and 0 otherwise. Therefore, food security statuses of households were treated as dichotomous dependent variable. If the dependent variable was dichotomous, binary Logit Model has been employed as recommended (Getaneh et al., Citation2022; J. Ntwenya et al., Citation2015). The HFIAS score of 17 was used as a cut off point to create a dichotomous dependent variable (Coates et al., Citation2007; FAO, Citation2008b; Garedew Dinku, Citation2017). Cut-off points on the scale enable categorical classification of whether households are food secure or not.
In this study household food security and its determinants interactions are identified by using binary logistic regression model and households with an HFIAS score of 17 were classified food insecure and
were classified food secure.
Model mathematically,
(1)
(1)
Pi is represent probability being food secure
Xi is represent a vector of explanatory variables
α is represent intercept
β is represent coefficient of the ith independent variable for i start from 1, 2 ………….k
e is represent base of natural logarithm
Simple way to interpretation of coefficients based on the independent variables (Xi) and dependent variable (Yi). Then transform logistic model and justify it in terms of the log of odd and odds ratios. The odds ratio is the ratios of the probability that a household would be food secure (Pi) to the probability of a household not being food insecure (1-Pi) is given as:
(2)
(2)
Taking the natural logarithm is called the logit model
The equation could be rewritten by considering the error term into account:
(3)
(3)
Logistic regression model is applied to identifying determinants of the food security by using EquationEquation (3)(3)
(3) which expresses in details in EquationEquation (4)
(4)
(4) .
(4)
(4)
(5)
(5)
Where Fs is food security, Hs is household size, WS is wealth status, Es for educational status, Ai for annual income, Lo for livestock ownership, and Pn participation on non-farm activity.
αo Is a constant, total expansion when every explanatory variables are zero. β1-10 is the coefficient of variables, is the residual term.
Model outcome expressed mathematically,
(6)
(6)
(7)
(7)
From this binary logistic regression equation, decided household size and sex were negatively affect food in/security where us wealth status, education status, age, land size, annual income, use of small scale irrigation to grow, livestock ownership and participation in nonfarm activities were affects positively.
The parameters of coefficients of independent variables were estimated using the maximum likelihood approach in the model. Wald test statistic applicable for coefficients of independent variables identification. The Wald test is interpreted when the p-value is less than or equal to 0.05 and the independent variable was considered significant. If it is greater than 0.05, it indicates that the independent variable is not significant, which initially supports the hypothetical model (Dessale, Citation2020; Gbetibouo & Hassan, Citation2005; Nazrawit Ayele, Citation2019; Ouda et al., Citation2007).
4. Results of finding
4.1. General profile of respondents
The general profile of the respondent describes as follows in which consist of age, marital status, sex, level of educational and family size each household.
Table 4. Demographic and socioeconomic characteristics.
Based on descriptions of general characteristics of the sample households more dominant male and married. The percentage of male headed respondents was estimated 72.5%, while the remaining 27.5% were female headed respondents. On the other hand wealth status is medium income level more dominant. Most of sample households were able to read and write which means they followed primary and secondary education.
Table 5. Socio-economic characteristics of households.
4.1.1. Socio-economic conditions of the Shashogo districts
In order to answer the socio-economic level of households, in this study in related questions were asked and discussed with it accordingly in .
The age of respondents is very critical handling food insecurity problem and understanding climate change effects via long life experience. So that in this study the average age of household heads was estimated50 years old which is more productive and active age. Land resource is good assets for all activities which held by smallholder farmers in the study district. Report shows that all respondents have they own land but size of land varies from one another’s. The average land holding was 1.4 ha, minimum 0.2 ha and maximum 5 ha. Based on survey conducts basic income source of respondents in a Shashogo district is production agriculture yields. A total of 85% people involving in agricultural activity, 13% practices livestock production, 2% of have got income from daily labourer work and remaining people involved in different activity and remittance. The mean value of income of respondents per in a year was just over 22000 birr. So the sources of incomes were being generated from livestock product, livestock and sell of cereal crop. Beside of this, source of income generated from non-farm activities was less significant its mean value estimated less than 1000 birr per a year this finding is resemble with world bank reports (World Bank, Citation2016).
4.2. Status of Food Security in smallholders farmers
Status of Food Security in smallholder farmers directly or indirectly interrelated with the demographic, economic characteristics of the households, social capital and marketing and its chain which are beyond the control of the households (FAO, Citation2021; Mekonnen et al., Citation2021). In this section identifying the food in/security level of households were employed by two different indicators which are self-report and HFIAS scale.
4.2.1. Estimate status of food security
In this section status of food availability of smallholder farmers were analysed by applying households’ self-report system. Each households head request to answered condition of food either secured or in secured so that the result indications that 52 (22.7%) of the respondents were food secure and 177(77.3%) were food insecure. Twenty seven percent of respondents were produces amount of food for their own consumption and market supply, which is nearly the same numbers with those who were better off income in household head. This a line with Deressa (Citation2005) Ethiopia agriculture system depend mostly in rain fed due to this fact lose food production and income from it. So that consequences of this were certainly undermine household and national food security. Several poor countries in world experience complications in having a cereal crops in each year and high number of populations are undernourished (Sarkar et al., Citation2019).
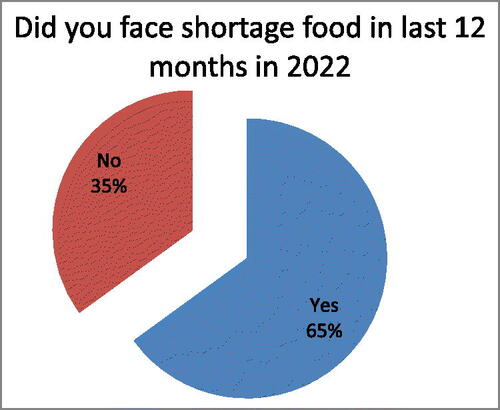
Food shortage is expressed in terms of availability of food production whereas food security defined as availability of food at any time for all people for health and activity life (Blanco & Consultant, Citation2012). Responds report indicates that challenged food shortage in 2022 was real happened. Challenged of food shortage during survey reported based on respondents 65% agreed food shortage following a prescribed point in time and 35% the respondents not faced food shortage (). The information forward, from key informant interview agricultural yield declined is common case study area for a prolonged period nearly all the year since 1992. Some basic reason of food shortage and security were justified by key informant interview such as traditional farming method, no advanced irrigational farming, low awareness of utilization of available water resource, scarcity of surface and ground water.
Figure 4. Condition of food availability in the last 12 months in 2021.
4.2.2. Household food access based on HFIAS
In this section study addresses the respondent ability to access food by using the household food insecurity access scale (HFIAS). HFIAS method is applicable for measuring food in/security access through questions and answered anxiety, uncertainty on supply, insufficient quality and quantity of food. The HFIAS is designed as a continuous measure of the access level of food insecurity in one month period.
Respondents’ responses to general questions Nos. 1, 2, 3, and 4 were summarized in and revealed poor food quality. The result shows that 82.1% were insecure about food supplies, while 17.9% had assured food security. Similarly, 86% of respondents indicated that food type choice and preferences were insufficient, while the remaining 14% received sufficient preferences and choices. An estimated 83% of respondents were unable to ensure the quality of their edible food due to an inability to eat limited choices, not eating preferred foods, and eating unwanted foods.
HFIAS analysis from questions 5, 6, 7, 8, and 9 in shows that 66.2% of the sample households were being reducing consumption due to this eating reduced meal than needed, less meals in a day, absolutely absent of food, staying whole day and night without eating.
Table 6. Household food insecurity access scale.
Table 7. Extent of food insufficient months in 2022.
Using HFIAS, households have been categorized as food secure, moderately food insecure, mildly food insecure, and severely food insecure. The response variable has four values as:
The examination of the HFIAS estimated 77.33% of respondents of food access level were insecure and 22.77% secure. Occurrences condition of this food insecurity level were 28.8% mildly, 25.1% moderately and 23.3% severely food insecurity. This finding is nearly similar finding with Dereje Tolera (Citation2019), according to him higher number of peoples were food in secured than secured in Ethiopia.
4.2.3. Spatial and temporal trends of food security
The results from key informants and focus group discussion show that the majority of community in the Shashogo district obtained sufficient amount of food in harvesting and post-harvesting season which from September to January in this time interval plenty of cereal crops were available. Good opportunity of community to food access and availability beginning secured from September to end in January then start to decline.
The result shows that, from total respondents 177 (77.3%) were faced to insufficiency of food amount. In , results from September to December 8.5%, from December 30 to April 23.2% and from April 30 to end of August 68.4% temporal faced to food insufficiency these due to different factor as mentioned in Section 4.4.
Spatial trend of food security problem was verified in different months 35% of mid highland and 65% was low land agro ecology reported as food insecure. This analysis shown low land agro ecology was more vulnerable than mid highland.
4.4. Factors affecting the trends of food security
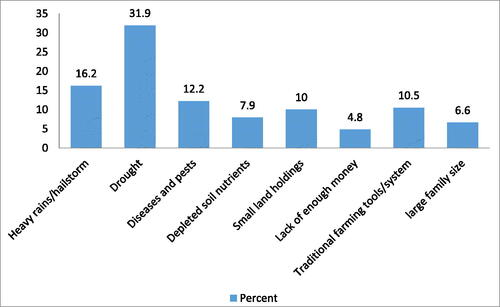
Number of meeting conducted with focus groups in each kebeles its results indicates that traditionally farming activity is contributes to the food insecurity, why? In a district farmers depend on rain fed agriculture. In addition to FGD and key informant reports that increasing climate change/variability, market uncertainties and declined income obtained from farm activity is some reasons for food insecurity. As described in , several possible reasons were point out for food shortage in district such us drought, heavy rains, depleted soil nutrients, traditional farming system, small land holdings, shortage income, large family size, diseases, and pests. This finding is line with different literatures (Bernard de Raymond et al., Citation2021; Feleke et al., Citation2005; Mekonnen et al., Citation2021; R. Mearns & Norton, Citation2010).
Figure 5. Root cause of food in/security.
4.4.1. Logistic regression analysis results
Logistic regression is used to describe data and to explain the relationship between one dependent and two or more independent variables. Hence, logistic regression was conducted to identify the determinants of household food security Dependent variable in this study is household food security and independent variables entered on identifying its determinants were sex, age, marriage status, house hold size, wealth status, land size, annual income, and production of crops using irrigation, status of education and non-farm income. The omnibus model test result shown was statistically significant at (df = 10, N = 229) = 0.00, p < 0.05. The variation of food security status in the household’s described by Cox & Snell model R2 is 37.6% and Nagelkerke R2 is 51.6%.
Among many variables four of the variables those are annual income, land size, scale up irrigation, having livestock and income generating from off-farm activities were found to be statistically significant between food insecure and secure which its model coefficient is less than 0.05. See in detail interpreted and discussed as follows in .
Table 8. Food security determinant factors.
Use of irrigation is assumed to be positive and help to assure food security. This assumption is true and shows that it has positively affected food security of households which is statistically significant at (p < 0.05). The analysis report indicates coefficient indicates that households who grow some crop using small scale irrigation were 2.779 times more likely to become food secure than those who do not use irrigation. This is expected because in the area with rain-fed rely on single-season harvest, it enables households to grow crops both for food and additional income and hence increasing the probability of a household to become food secure.
Land holding size: It was hypothesized that, farm land size was assumed to be enhancing agricultural products which means increasing land size good contribute to household for food security. The result in shows that land holding size was significantly and its coefficient 0.045 which means significant at 5%. Result explained in here keeping other factors constant, increases land size by 1.212 times the odds more likely to be food secure. In general for more crops growing and raise livestock adequate land size good opportunity as income sources and food for household consumption.
Nonfarm income: Was assumed respondents obtained income from no farm activity expected to positively contribute to the food security. The result shows respondents generate income from off farm activity, the chance of the food secure increases by 4.55 times than that households who do not participate in nonfarm activities.
Livestock ownership: Assumed in this study livestock ownership was positively contribute to the food security via providing income source and its product. The results of model shows ownership of livestock increases by one unit increases the odds ratio of a respondent to be food secure by 2.302 factors more probable. Ownership of livestock was positive and significant and its odds ratio is 9.993 see in . This implies livestock ownership have a positively effect and assumption is true. Livestock have provided multipurpose for households such as manure for enhance soil fertility, transportation, source of income and cultivate power.
4.5. Opportunities and challenges of food security
For addressing opportunities and challenges of food in/security conducted IKI and FGD. AS conducted field observation there are an opportunities as well as key informant provided information so many opportunity to assured food insecurity treats among those Boy lake and Bilite river water for irrigation farming practices to enhancing agricultural yields in districts. Those are good opportunity to assured food security through enhancing irrigation agriculture to produce more crop productivity. In addition to that FGD indicates many hinders issues was challenges of food security from this climate change and variability is main challenges which manifested via effects of Belg season crop lost in recent ten years. Based on FGD reports several reasons were obstacles of adaptation option and challenges of food security which includes shortage of land, poor potential for irrigation, lack of money to acquired modern techniques, shortage of labour, non-availability of farm inputs, shortage of improved seeds and inadequate knowledge of climate change/variability.
4.6. Coping mechanisms of food insecurity
Various coping mechanisms have been identified, such as aid from relatives, cash from work, earnings from off-farm operations, credit money and animals sold based on FGD and key informant interviews reports. In addition to, based on , mechanisms for coping with food insecurity, the majority of respondents’ coping mechanisms were buying grain from the market and earning income from non-agricultural activities was the second option to cope with food insecurity.
Table 9. Coping mechanisms of smallholder farmers.
4.7. Limitations of the study
Based on the literature, this study evaluated food insecurity among smallholder farmer households in the Shashogo district in central Ethiopia using the HFIAS module. Because different approaches to examining the food insecurity of smallholder farmers’ households may provide different results, the conclusions drawn from this study should not be applied to other household food (in)security studies conducted in Ethiopia or elsewhere. In this study, the study district’s smallholder farmers are the main subject. This paper did not take into account climate characteristics in either the present or the future, thus the next stage for researchers will need to establish how climate change will affect food security.
Conclusions and recommendation
The result shows that majority of respondents were confronted with food shortages for more than three months. The spatial trend of the food security problem has been confirmed in different agro-ecological zones. From this 35% of the mid-highlands and 65% of the lowlands were reported as food insecure. This analysis revealed that agro-ecology was more vulnerable in lowland regions than in mid-highland areas.
Households self-report result shows that 22.7% of the respondents were food secure and 77.3% were food insecure whereas, HFIAS report shows that, 28.8% mildly, 25.1% moderately and 23.3% severely food insecure.
Among the many variables, four variables, namely annual income, land size, extension of irrigation, livestock and income from non-agricultural activities, were found to be statistically significant between food insecurity and food security, with their model coefficient value below 0.05.
Various coping mechanisms have been used in districts like: - aid from relatives, cash from work, loan money, sale of animals, and animal products. In addition, the majority of respondents’ coping mechanisms in times of food insecurity were buying grains from the market, and earning income from off-farm activities was the second way to deal with food insecurity.
Recommendations
Policy makers and stakeholders are raising awareness among smallholder farmers to ensure food security by increasing agricultural yields. Policy makers and stakeholders are providing new, advanced farming technologies that go beyond the traditional farming system. Complementing current coping and adaptation strategies has a positive impact on smallholder food security.
Author contribution
Tamrat Lolaso conceived and Analyzed and interpreted the data; Contributed reagents, materials, analysis tools or data; Wrote the paper. Engdawork Assef Conceptualizing document and Teshale Woldeamanuel writing review and editing.
| Abbreviations | ||
| FGD | = | Focus group discussion |
| ha | = | hacters |
| HFIAS | = | Household food insecurity access scale |
| HH | = | household head |
| Km | = | kilometre |
| mm | = | milometer |
| SWLRM | = | Shashogo woreda land resource management |
| SNNPR | = | south nation nationality people region |
Disclosure statement
No potential conflict of interest was reported by the author(s).
Additional information
Notes on contributors
Tamrat Lolaso
Tamrat Lolaso first degree in chemistry Master’s degree in Climate change and developmet and currently PhD candidate in Hawassa University.
Engdawork Assef
Engdawork Assef (PhD) associate professor in Addis Abeba University in development and Environmental science.
Teshale Woldeamanuel
Teshale Woldeamanuel Ph.D holder in general Forestry and Natural Resources.
References
- Alemu, T., & Mengistu, A. (2019). Impacts of climate change on food security in Ethiopia: Adaptation and mitigation options: A Review. In Azeiteiro, U.M. (Ed.), Climate change-resilient agriculture and agroforestry, climate change management (pp. 397–412). Springer International Publishing. https://doi.org/10.1007/978-3-319-75004-0_23
- Ayal, D. Y., W/Michael, T., Getahun, A. B., Ture, K., Zeleke, T. T., & Tesfaye, B. (2023). Climate variability induced household food insecurity coping strategy in Gambella Zuria Woreda, Southwestern, Ethiopia. Climate Services, 30, 100382. https://doi.org/10.1016/j.cliser.2023.100382
- Bernard de Raymond, A., Alpha, A., Ben-Ari, T., Daviron, B., Nesme, T., & Tétart, G. (2021). Systemic risk and food security. Emerging trends and future avenues for research. Glob. Food Secur, 29. 100547. https://doi.org/10.1016/j.gfs.2021.100547
- Blanco, A. M., & Consultant, I. (2012). Food Security in Latin America 49.
- Bovell-Ammon, A., Cuba, S. E. d., Coleman, S., Ahmad, N., Black, M. M., Frank, D. A., Ochoa, E., & Cutts, D. B. (2019). Trends in Food Insecurity and SNAP participation among immigrant families U.S.-born young children. Children (Basel, Switzerland), 6(4), 55. https://doi.org/10.3390/children6040055
- Chufamo, S., T.W.A., et.al. (2008). Socio-economic Impacts of Climate Change on Smallholder Livelihoods in Shashogo District, Hadiya Zone, South Ethiopia pp 8-14.
- Coates, J., Swindale, A., & Bilinsky, P. (2007). Household Food Insecurity Access Scale (HFIAS) for Measurement of Food Access: Indicator Guide: Version 3: (576842013-001). https://doi.org/10.1037/e576842013-001
- Dereje Tolera, G. (2019). Food security and livelihood strategies of rural farm households with focus on female-headed households in Sasiga District, East Wollega Zone, Ethiopia. ADDIS ABABA Ethiop.
- Deressa, T. (2005). Measuring the impact of climate change on South African agriculture: the case of sugarcane growing regions.
- Deressa, T. (2007). Measuring the economic impact of climate change on Ethiopian agriculture.
- Dessale, M. (2020). Determinants and Food Security Impacts of Small-Scale Irrigation in Ethiopia. Bus. Econ. J, Department of Agricultural Economics, Wollo University, Ethiopia 11, p, 8.
- Destaye Gobena. (2009). Application of GIS and remote sensing for flood hazard and risk analysis: the case of Boyo catchment.
- El Bilali, H., Henri Nestor Bassole, I., Dambo, L., & Berjan, S. (2020). Climate change and food security. J. Agric. For, 66 https://doi.org/10.17707/AgricultForest.66.3.16
- Ethiopia Population Census. (2007). Population and Housing Census of Ethiopia.
- FAO. (2008a). Report on use of the Household Food Insecurity Access Scale and Household Dietary Diversity Score in two survey rounds in Manica and Sofala Provinces, Mozambique.
- FAO. (2008b). Climate change and food security: A framework document.
- FAO. (2015). Climate change and food security: risks and responses food.
- FAO. (2021). The state of food security and nutrition in the World 2021. FAO, IFAD, UNICEF, WFP and WHO. https://doi.org/10.4060/cb4474en
- Feleke, S. T., Kilmer, R. L., & Gladwin, C. H. (2005). Determinants of food security in Southern Ethiopia at the household level. Agric. Econ, 33, 351–363. https://doi.org/10.1111/j.1574-0864.2005.00074.x
- Fernandes, M., & Samputra, P. L. (2022). Exploring linkages between food security and economic growth: A systematic mapping literature review. Potravinarstvo Slovak Journal of Food Sciences, 16, 206–218. https://doi.org/10.5219/1734
- Fumane, N. (2014). Determining the food security status of households in a South African township.
- Garedew Dinku. (2017). The impact of Multipurpose Agricultural Cooperatives On Ruaral Households’ Food Security And Well-Being In East Shewa Zone Oromia Region, Ethiopia. PhD Thesis Addis Ababa Univ. Sch. Grad. Stud. Addis Ababa
- Gbetibouo, G. A., & Hassan, R. M. (2005). Measuring the economic impact of climate change on major South African field crops: A Ricardian approach. Glob. Planet. Change, 47, 143–152. https://doi.org/10.1016/j.gloplacha.2004.10.009
- Getaneh, Y., Alemu, A., Ganewo, Z., & Haile, A. (2022). Food security status and determinants in North-Eastern rift valley of Ethiopia. J. Agric. Food Res, 8, 100290. https://doi.org/10.1016/j.jafr.2022.100290
- Gitz, V., & Meybeck, A. (2016). Climate change and food security: risks and responses.
- Ingutia, R., & Sumelius, J. (2022). Determinants of food security status with reference to women farmers in rural Kenya. Scientific African, 15, e01114. https://doi.org/10.1016/j.sciaf.2022.e01114
- IPCC. (2014). Climate change impacts, adaptation, and vulnerability: Working Group II contribution to the fifth assessment report of the Intergovernmental Panel on Climate Change. Cambridge University Press.
- Kassahun, M. M. (2009). Climate change and crop agriculture in Nile basin of Ethiopia: measuring impacts and adaptation options p82.
- Kelley, K., & Maxwell, S. E. (2003). Sample Size for multiple regression: Obtaining regression coefficients that are 4. Accurate, not simply significant. Psychological Methods, 8, 305–321. https://doi.org/10.1037/1082-989X.8.3.305
- Klaus, V. G., Hanano, A., Wiemers, M., & Fritschel, H. (2023). Global Hunger Index: Food Systems Transformation and Local Governance. https://www.researchgate.net/publication/375604644.
- Kothari. (2004). Research methodology. Visit us at www.newagepublishers.com
- Kundzewicz et.al. (2007). Freshwater resources and their management. Climate Change 2007: Impacts, Adaptation and Vulnerability. Contribution of Working Group II to the Fourth Assessment Report of the Intergovernmental Panel on Climate Change. Cambridge University Press. 173–210.
- Mearns, R., & Norton, A. (2010). Social dimensions of climate change: equity and vulnerability in a warming world.
- Mekonnen, A., Tessema, A., Ganewo, Z., & Haile, A. (2021). Climate change impacts on household food security and adaptation strategies in southern Ethiopia. Food and Energy Security, 10. https://doi.org/10.1002/fes3.266
- Mendelsohn, R., & Kurukulasuriya, P. (2007). Endogenous irrigation: The impact of climate change on farmers in Africa, Policy Research Working Papers. The World Bank, https://doi.org/10.1596/1813-9450-4278
- Mogos, M. (2016). Projection of future climate and its impacts on crop production and possible adaptation strategy: Case Study of Hadiya Zone Shashogo Woreda (pp. 3–13).
- Nazrawit Ayele, N. (2019). Climate-smart agriculture and food security nexus: practices, adoption strategies and technologies in Hidhabu abote woreda, Oromia region, central Ethiopia 121.
- Ntwenya, J., Kinabo, J., Msuya, J., Mamiro, D., & Katalambula, L. (2015). Household food insecurity and associated factors in rural communities: A case of Kilosa District, Tanzania. https://doi.org/10.5897/AJAR2012.1718
- Olutosin, A., Oluwaseun, A., Sawicka, B., & Pszczółkowski, P. (2021). Assessing Food Insecurity and Its Drivers among Smallholder Farming Households in Rural Oyo State, Nigeria. : The HFIAS Approach. https://doi.org/10.3390/agriculture11121189
- Oluwole, O., Ibidapo, O., Arowosola, T., Raji, F., Zandonadi, R. P., Alasqah, I., Lho, L. H., Han, H., & Raposo, A. (2023). Sustainable transformation agenda for enhanced global food and nutrition security: A narrative review. Frontiers in Nutrition, 10, 1226538. https://doi.org/10.3389/fnut.2023.1226538
- Ouda, S. A., El-Marsafawy, S. M., & Eid, H. M. (2007). Assessing the economic impacts of climate change on agriculture in Egypt : A Ricardian approach, Policy Research Working Papers. The World Bank. https://doi.org/10.1596/1813-9450-4293
- Pradhan, P., Warchold, A., Schoenlau, V., & Kropp, J. (2013). Status and trends of food security in South Asia 13.
- Sarkar, A., Sensarma, S.R., vanLoon, G.W. (Eds.) (2019). Sustainable solutions for food security: Combating climate change by adaptation. Springer International Publishing, Cham. https://doi.org/10.1007/978-3-319-77878-5
- Tadesse, A. (2011). The impact of area enclosure on soil quality and farmers’ perception: the case of Tachignaw Gimbichu enclosure in Shashogo woreda, southern Ethiopia. Addis Ababa University, 71.
- Tutunchi, H., Ostadrahimi, A., Mahboob, S., & Tabrizi, S. J. (2011). Analysis of food insecurity and surveillance based on the FANP method in the northwest of Iran 8.
- World Bank. (2016). Ethiopia’s great run: the growth acceleration and how to pace it. World bank group.
- Yadav, S.S., Redden, R.J., Hatfield, J.L., Ebert, A., Hunter, D. (Eds.). (2018). Food security and climate change (1st ed.). John Wiley & Sons.
- Ziervogel, G., & Ericksen, P. J. (2010). Adapting to climate change to sustain food security. 1(4), 525–540. pp1-17. https://hdl.handle.net/10568/3229 https://doi.org/10.1002/wcc.56