
 ?Mathematical formulae have been encoded as MathML and are displayed in this HTML version using MathJax in order to improve their display. Uncheck the box to turn MathJax off. This feature requires Javascript. Click on a formula to zoom.
Abstract
The study examined the utilization of sprouted finger millet-maize composite flour in breakfast cereal production, with a focus on its physicochemical, functional, and sensory attributes. The study followed a one factor design in which maize flour (MF) was substituted with sprouted finger millet (SFMF) at varying proportions (0%, 40%, 50%, 60%, 70%, and 90%) to investigate the physicochemical and functional characteristics. The tristimulus colour (L* value), pH, amount of water and oil absorption capacity, proximate composition, emulsion capacity and stability, swelling power and solubility index of composite flour samples were analyzed. Breakfast cereal samples made from composite flour were analyzed for sensory characteristics and tristimulus colour (L* value). Notably, the moisture and ash content of the composite flour samples displayed significant increases (p ≤ 0.05) as the proportion of Sprouted Finger Millet Flour (SFMF) incorporation rose, while carbohydrate and protein contents decreased significantly (p ≤ 0.05). Functional properties demonstrated significant increases (p ≤ 0.05) in the composite flour samples, except for bulk density, which decreased significantly (p ≤ 0.05) with increasing SFMF content. The L* values for the composite flours significantly (p ≤ 0.05) decreased. In sensory evaluations of the breakfast cereal samples, those with 40% and 50% SFMF received the highest overall acceptability, colour, and taste scores (p ≤ 0.05). The findings of this study suggest that nutritious breakfast cereal can be produced using finger millet-maize composite flour, characterized by elevated levels of ash and crude fiber, alongside low carbohydrate and moisture content.
REVIEWING EDITOR:
Introduction
Breakfast cereals are an important part of the human diet since they offer a quick and wholesome choice for breakfast. They are an excellent source of nutrients like iron and B vitamins since they are frequently fortified with vitamins and minerals (Akonor et al., Citation2023a; Lu, Citation2023). Breakfast cereals may also contain a lot of fiber, which promotes healthy digestion and aids in blood sugar regulation. Breakfast cereals that contain whole grains provide a balanced diet and may lower the chance of developing chronic illnesses like diabetes and heart disease. Furthermore, a wide spectrum of individuals may easily acquire breakfast cereals due to their diversity and ease, which promotes the adoption of healthier eating habits. All things considered, breakfast cereals serve as an easy and nutritious option to start the day on a healthy note (Lu, Citation2023).
Underutilized and marginalized food crops such as finger millet, Frafra potato, and yellow-fleshed cassava are less regarded plant species in terms of their promotion and exploration but are nonetheless well adapted to diverse and adverse climatic conditions (Akonor et al., Citation2023b; Osei Tutu et al., Citation2024; Padulosi et al., Citation2002). Even though the indigenous potential and ethnobotanical information of these wonderful crops are well known to individuals, their commercial importance as well as market values is not well known (Thakur, Citation2014). Hence, these crops are gradually going extinct. Therefore, ensuring their existence is of tremendous importance as a food security crop to help feed the exponentially growing world’s population for decades to come (Frona et al., Citation2019; Osei Tutu et al., Citation2023).
Finger millet (Eleusine coracana (L.) Gaertn) formerly a Ghanaian staple food crop and one of the minor cereal crops of Ethiopia, Nigeria, Burkina Faso and Niger is an underutilized and marginalized cereal crop. Even though it is cultivated extensively in places like India and Asia, it is marginally grown in Africa. In Ghana, finger millet is predominantly cultivated in the more arid northern parts, alongside other cereal crops such as maize and sorghum (SRID-MoFA, Citation2011). It is an important staple food crop for smallholder farmers who grow it as well as individuals in areas where they are cultivated (Rooney & Serna-Saldivar, Citation2000). Finger millet, a chief dryland crop, has the tendency to tolerate adverse environmental conditions when grown in areas not liable to flood, or in soils with poor water holding capacity (FAO, 2001). As a result, this group of small grains can be widely grown in varied and adverse environments, typically in the semi-arid to sub-humid drought-prone agro ecosystems (Chandra et al., Citation2016).
Finger millet has gained importance in recent years because of its nutritional content in terms of starch, dietary fiber and high mineral profile (Pore & Magar, Citation1979). Regardless of these benefits, the harvested area and consumption of finger millet have reduced significantly due to urbanization, changing food preferences, non-exposure and unavailability of products suiting the taste of rural and urban inhabitants. Therefore, further promotion of finger millet requires diversification of products in terms of incorporating it in healthy foods, bakery products and ready-to-eat foods (Sinha & Sharma, Citation2017). Attention has been given to the utilization of millet flour in the production of baked products such as bread, cookies and crackers with the objective of targeting gluten sensitive or diabetic consumers (Rai et al., Citation2014). Cereal products such as ‘Tombrown’ and ‘weani-mix’ typically have processed maize and rice flour as their sole ingredients. The replacement or substitution of this flour with finger millet flour will advance the nutritional quality of such products (Sinha & Sharma, Citation2017).
For several reasons, date fruit is frequently added to breakfast formulations. Dates are a better option for sweetening breakfast items because they are naturally sweet and can improve the flavour of meals without the need for added sugar (Omotayo Jimoh et al., Citation2023). Secondly, dates are a good source of dietary fibre, which helps support healthy digestion and helps you feel fuller for longer periods, both of which can help with weight management. Furthermore, dates are a great source of vital nutrients that support general well-being and health, like vitamins, potassium, and magnesium. Finally, because dates naturally contain sugars, they are a great option for reviving the body’s metabolism after a night of fasting and providing a quick energy boost in the morning. All things considered, eating date fruit for breakfast can enhance its sweetness, fiber content, and nutritional value, making it a satisfying and tasty way to start the day (Akonor et al., Citation2023c; Omotayo Jimoh et al., Citation2023).
Composite flour technology presents excellent potential for developing countries. While consumer trials have been scarce in recent years, food products made from composite flours have been well accepted in places like Sri Lanka, Sudan, Kenya, Nigeria, and Senegal (Pragya, Citation2012). Studies have shown that cereal-based food products without enrichment with vitamins and minerals can result in mineral and vitamin deficiencies, especially iron and vitamin A among infants fed with these cereal-based complementary foods (Bhaskarachary et al., Citation2008). Moreover, mineral and vitamin supplements are not readily available and accessible for use by most middle and low socioeconomic status families at the household-level in Africa because of cost and high level of illiteracy (Sinha & Sharma, Citation2017). Thus, making breakfast cereal from sprouted finger millet, maize, and date fruit composite flour would provide a nutritious, affordable and easily accessible meal to all at the household-level.
This study produced a composite instant breakfast cereal using sprouted finger millet, maize, and date fruit composite flour. The acceptability and nutritional profile of the resulting instant breakfast cereal were then evaluated.
Materials and methods
Finger millet, Maize and Date fruits were obtained from the local market at Madina, Accra. The samples were transported to the Department of Family and Consumer Sciences, University of Ghana and stored at room temperature (25 °C) until they were used. Analytical grade reagents were bought from the Ecological laboratory, University of Ghana, Accra.
Experimental design
A one-factor (or completely randomized) design, which was considered as the different levels of incorporation of sprouted finger millet (0%, 40%, 50%, 60%, 70%, and 90%) in the composite flour was used. The sample with 0% sprouted finger millet flour served as a control. Each experiment was performed in triplicate.
Sprouting of finger millet
Finger millet was sorted, washed, soaked in water, and sprouted according to the procedure described by Onyango et al. (Citation2012) with modification. The grains were thoroughly washed before soaking in clean tap water at ambient temperature (about 25 °C) for 12 hrs. The grains were then drained and spread on trays that had been lined with moistened and pre-sterilized jute sacks. Water was sprinkled on the grains at 12 hours intervals for 48 hours. The germinating seeds were also turned at 12-hour intervals to avoid excessive matting. After the 48 hours stipulated time, the sprouted seeds were dried in the air oven (Baird and Tatlock London Ltd, Chadwell Heath Essex, England) at 45 °C for 12 hours and cooled to room temperature. The sprouted dried seeds were devegetated by hand rubbing and winnowing to separate the dried rootlets and sprouts from the grain.
Production of flours
Sprouted finger millet flour
Sprouted and dried finger millet was milled using a Hammer mill (Size 8 laboratory mill, Christy and Norris Ltd, Chelmsford, England) to obtain the sprouted finger millet flour. A 250-µm aperture sieve was used to sift the sprouted finger millet flour sample for a consistent particle size flour. The flour was packaged using airtight polyethylene and then packed into a plastic container with a lid and stored in a freezer at −10 °C until used.
Maize flour
Maize grains were sorted and washed thoroughly with clean tap water and soaked at ambient temperature (about 25 °C) overnight for 12 hours. The grains were then drained and spread on trays, dried in an incubator oven (Genlab limited, Tanhouse Lane, Widnes, Cheshire) at 120 °C for 15 minutes and cooled to room temperature. The dried grains were then milled using a Hammer mill (Size 8 laboratory mill, Christy and Norris Ltd, Chelmsford, England) to obtain the maize flour. A 250 µm sieve was used to sift the maize flour sample, kept in airtight polyethylene bags and stored in a freezer at −10 °C until ready for use.
Date fruit flour
Date fruit was sorted and washed thoroughly with clean water. The date fruits were spread on baking trays and dried in the incubator oven (Genlab limited, Tanhouse Lane, Widnes, Cheshire) at 45 °C overnight for 12 hours and cooled to room temperature. The dried date fruits were milled using a Hammer mill (Size 8 laboratory mill, Christy and Norris Ltd, Chelmsford, England) to obtain the date fruit flour. The flour was sifted, kept in airtight polyethylene bags and stored in a freezer at −10 °C until ready for use.
Formulation of composite flour
The resulting Sprouted Finger Millet Flour (SFMF) was used to formulate five (5) different flour combinations and a control () with Maize Flour (MF) and Date Fruit Flour (DFF) using a universal fritter (QS513) to evenly mix each formulation to obtain uniform composite flour. These were subsequently referred to as composite flour samples. The proportions of the formulations represented by randomized digit codes are presented in .
Table 1. Percentage of finger millet flour to maize flour and date fruit flour in composite flour formulations.
Colour and total colour difference analysis of flour
The colour of the composite flour samples were determined using a modified method from Yadav et al. (Citation2012) with modifications from Akonor et al. (Citation2023a). The colour of the composite flour samples were determined with a Hunter Lab Colour Analyzer (CR310 Chroma meter, Konica Minolta, Tokyo, Japan 76981007) to obtain the L* (lightness), a* (redness) and b* (yellowness) values as well as the ΔE* (total colour change). The chromo-meter was calibrated with a white color standard. Three measurements were performed, and results were averaged. In addition, total color change (ΔE) was calculated using the following equations:
whereΔL* (L* sample minus L* standard) = difference in lightness and darkness (+ = lighter, – = darker)Δa* (a* sample minus a* standard) = difference in red and green (+ = redder, – = greener)Δb* (b* sample minus b* standard) = difference in yellow and blue (+ = yellower, – = bluer).
Proximate composition
Proximate composition was determined on the composite flour samples. The crude protein content of the samples was determined by Kjeldahl Nitrogen Method as described by Amin and Flowers (Citation2014). The nitrogen value obtained was multiplied by 6.25 to obtain crude protein values. The weight difference methods were used to determine moisture and ash content while crude fat of the samples was determined using the AOAC procedure with petroleum ether as solvent. The carbohydrate content was determined by calculation using the difference method by means of the equations below:
The gross energy values (Kcal/100 g samples) of the composite flour samples were estimated using the factors for protein (4Kcal/g), fat (9 Kcal/g) and carbohydrate (4 Kcal/g).
The equation is: Food energy = (% Crude protein × 4) + (% Fat content × 9) + (% Carbohydrate × 4).
pH and titratable acidity (TA)
The pH of the composite flour samples was determined according to Chinma et al. (Citation2012) with modifications. 10 g of each sample was weighed and mixed with 100 mL of distilled water. The subsequent suspensions were stirred with a magnetic stirrer for 30 minutes. The resulting solutions were centrifuged at 5000 × g at 18 °C for 20 minutes. 40 mL each of the supernatants were used in the assay (Jenway 495r) and the pH of the supernatant of each sample was then measured with a standardized Mettler Toledo pH meter (model: SevenCompact S220, USA). The total titratable acidity was determined by titrating 40 mL of supernatant with 0.1 M NaOH (sodium hydroxide) until a pH of 8.5 was recorded. Results obtained were expressed as the mL of 0.1 M NaOH needed to titrate 10 g of composite flour samples.
Oil and water absorption capacity
Water (WAC)/oil (OAC) absorption capacity of the composite flour samples were determined using the AACC method 56–20 (AACC, Citation2000) with modifications. 5 g of the composite flour samples were mixed with 20 mL of distilled water/oil in a weighted 45 mL centrifuge tube. The semi-liquid mixtures were agitated on a vortex mixer for two minutes, allowed to stand at 30 °C for 30 minutes, and then centrifuged (Eltek centrifuge, MP 400 R, Electrocraft, India) at 500 × g for 20 minutes. The clear supernatant was dispensed and discarded. The adhering drops of water were removed with a white tissue paper and the tube was weighed.
The weight of the water/oil absorbed by 5 g of composite flour samples was calculated and expressed as water/oil absorption capacities as follows:
where V1 = initial volume of distilled water
V2 = final volume of distilled water
1 = density of water
where 0.93 is the density of oil.
Emulsion capacity and stability of flour
The emulsion capacity was determined following Chandra et al. (Citation2015). Three grams of the composite flour was suspended in a mixture of 10 mL of vegetable oil and 10 mL of distilled water in a weighed 45 mL centrifuge tube. The mixture was then emulsified using a vortex mixer at high speed for 3 minutes.
The resulting emulsion was then centrifuged (Eltek centrifuge, MP 400 R, Electrocraft, India) at 500 x g for 20 minutes. The ratio of the height of the emulsion layer to the total height of the mixture was calculated as emulsion capacity percentage. The formula for calculating the emulsion capacity is as follows:
The method of Chandra et al. (Citation2015) with modifications was used to determine the emulsion stability of the composite flour samples. The composite flour (5.0 g) was suspended in a mixture of 10 mL each of vegetable cooking oil and distilled water. The mixture was then heated at 80 °C for 30 minutes in a water bath. The resulting mixture was then cooled under running water for 20 minutes and centrifuged (Eltek centrifuge, MP 400 R, Electrocraft, India) at 500 × g for 20 minutes. With the same calculation method for the emulsion capacity, emulsion stability was obtained. All tests were done in triplicate.
Swelling capacity and solubility index of flour
Swelling capacity was determined by the method of Okaka and Potter (Citation1997) with modifications from Akonor et al. (Citation2023b). A 100 mL graduated cylinder was filled with 10 g of the flour sample and made up to the 10 mL mark with distilled water. Distilled water was then added to obtain a total volume of 50 mL. The top of the graduated cylinder was tightly covered using aluminum foil and mixed by inverting the cylinder. The suspension was afterwards inverted again after 5 minutes and left to stand for 20 minutes. The volume occupied by the sample was taken after the 20th minute before the supernatant was carefully transferred into a weighed petri dish. Swelling power was obtained by weighing the residue after the 20th minute then dividing the residue weight by the original weight of the composite flour on a dry weight basis.
The solubility index was determined by evaporating the supernatant contained in a weighed petri dish over a steam bath and finally dried in an incubator oven at 105 °C for 6 hours. The weight of the dissolved solid was determined with an electric balance, after all the solvent had been evaporated. The solubility index of the composite flour samples was calculated as follows:
whereW1 = the weight of the of the petri dishW2 = weight of the dissolved solid and the petri dish after dryingW3 = the original sample weight.
Bulk density of flour
Bulk density was determined following the method of Mandge et al. (Citation2014) with modifications from Osei Tutu et al. (Citation2019) by measuring 10 mL capacity graduated cylinder, weighed, and recorded. The cylinder was filled with the flour sample, tapped gently from the bottom for 30 times until there was no further dimension of the sample level. The values were calculated using the relation:
where the ρb is the bulk density in kg m−3; Ws is the weight of the sample in kg; and Vs is the volume occupied by the sample in m3.
Determination of dispersibility of flour
The dispersibility of composite flour samples was determined following the method of Olapade et al. (Citation2014). A total of 10 g of the flour sample was weighed into 100 mL measuring cylinder and distilled water was added up to 50 ml mark. It was stirred vigorously and allowed to stand for 3 hours. The volume of the settled particle was then noted and subtracted from 100 to obtain the percentage dispersibility, using the equation as follows:
Breakfast cereal preparation
The composite breakfast cereal was made following the procedure of Onyango et al. (Citation2012) with modifications. The preparation was done at the Food Product Development laboratory at the Department of Family and Consumer Sciences of the University of Ghana. Composite flour, fat (margarine) and salt were mixed thoroughly in a universal fritter (QS513) for 3 minutes to obtain a homogenous mixture. The proportion used to prepare the breakfast cereal is presented in . The resulting mixture was placed in a clean dry bucket and covered. The mixture was then left overnight to naturally ferment for 12 hours at ambient temperature (25 °C). This was done for all six different samples. The mixtures were then mixed with water in the ratio of 1:3, that is 1 part of solid (mixture of composite flour, margarine and salt) and 3 parts of water to obtain a consistent slurry suitable for drum drying. The slurry was prepared by gradually adding the solid mixture (composite flour, margarine and fat) to the water while stirring until the solid mixture was evenly distributed in the water. A double drum dryer was used to dry the slurry (Kalogianni et al., Citation2002). Steam was the source of heat for heating the counter rotating drums at 45 pounds per square inch and then rotated at 5 rotations per minute.
Table 2. Proportion of ingredients for making breakfast cereal.
Sensory evaluation of breakfast cereal samples
Blay’s (Citation2012) relative preference mapping method was followed to conduct sensory evaluation. The breakfast cereal samples were evaluated for colour, aroma, mouthfeel, taste, and overall acceptability. 80 semi-trained panelists who voluntarily participated in the test were regular consumers of breakfast cereals. They were randomly selected to evaluate the coded samples using a nine-point Hedonic scale (where 1 = dislike extremely and 9 = liked extremely). They were also asked to state reasons for which of the breakfast cereal coded sample was more acceptable and rank the samples from the most preferred to the least preferred. Each panelist was served with six different samples. Water was used as the palate cleanser in between samples tasting.
Statistical analysis
A completely randomized design was used to study the effect of different levels of sprouted finger millet flour (SFMF) incorporation on the functional and physicochemical and sensory evaluation of the breakfast cereal. Statistical analyses of data were performed using R Statistical Software 64-bit version 3.3.1 (R Stats), and Microsoft Office Excel 2013. The means and standard deviations of measured variables and multiple range tests of treatments following a one factor ANOVA were calculated using R Statistical Software (version 3.3.1). All tests were conducted at (α < 0.05).
Results and discussion
displays the alterations in colour parameters (L*, a*, b*, and ΔE*) of the composite flour samples. The results of the colour analysis revealed a noteworthy distinction (p ≤ 0.05) in the L* values between the composite flour sample containing 0% Sprouted Finger Millet Flour (SFMF) and the composite flour samples incorporating varying levels of SFMF. The values of L* and b* decreased with increasing Sprouted Finger Millet Flour (SFMF) in the formulations even though it was difficult to observe the colour difference among the composite flour samples with Sprouted Finger Millet Flour by sight. Hence, the addition of SFMF to Maize and Date Fruit flours significantly decreased L* and b* value for all the composite flour samples except the control composite flour sample with 0% SFMF. Thus, as SFMF increases in the composite flour sample, L* and b* value significantly decreased which was also found in breakfast cereals blended with pumpkin powder (Ghafoori & Hosseini Ghaboos, Citation2018). The values of a* significantly increased with increasing amount of SFMF in the composite flour samples. The total colour difference (ΔE*) value was an essential index to assess the color change in the flour samples. Wu et al. (Citation2021) proposed that a ΔE* value greater than or equal to 3.0 could be a significant visual change in numerous circumstances. ΔE showed a degree of colour change in the composite flour samples with different level of SFMF incorporation compared with control. Composite flour with 90% level of SFMF had the least ΔE* (0.86) while the highest (21.89) was recorded in the sample with 0% level of SFMF. The total color change decreased with increasing level of SFMF substitution in the composite flour samples. The proximate composition determined on the composite flour sample included moisture, protein, total carbohydrates, fat, total ash, and were expressed on dry matter basis, except for moisture.
The proximate composition of the composite flour samples is presented in . The results show significant differences (p ≤ 0.05) in moisture content for all composite flour samples. The composite flour sample with 0% SFMF (control) had the highest moisture content while the composite flour sample with 90% SFMF was the least. The composite flour samples recorded moisture contents ranging from 8.01% to 9.25%, which were found to be within the previously reported values of 8.2% and 14.1% (Contreras-Jiménez et al., Citation2019; Li & Zhu, Citation2017; Srilekha et al., Citation2019). This could be attributed to the inverse relation between the rate of absorption of moisture and seed size, since a larger seed offers a smaller surface area per unit mass (specific surface area) for moisture transfer. The decrease in moisture content as SFMF increased could be because the sprouted millet flour recorded a lower moisture content than the maize flour, hence, the substitution of the maize flour with finger millet flour resulted in a significant decrease in moisture content (Thilagavathi et al., Citation2015). There were significant differences (p ≤ 0.05) in moisture content between the composite flour sample with 0% SFMF and the composite flour samples with 40%, 50%, 60%, 70%, and 90% SFMF. However, there were no significant differences (p ≤ 0.05) in moisture content among composite flour formulations with 40%, 50%, 60%, 70%, and 90% SFMF incorporations. The moisture content in all samples was however within standards since the threshold for moisture in flour-based products is 13% (Nasir et al., Citation2003) to ensure prolonged shelf life without lumping and moldiness.
Table 3. Physical and chemical characteristics of composite flour samples.
The fat content of the composite flour formulations with different percentage incorporations of SFMF showed significant differences (p ≤ 0.05) as presented in . The fat content decreased significantly (p ≤ 0.05) with increasing amount of SFMF incorporation. This could be attributed to total solid loss during soaking and the use of fat as a source of energy during sprouting which resulted in the reduction in fat content of the sprouted finger millet. This could also be due to varietal difference (Osei Tutu et al., Citation2024; Srilekha et al., Citation2019).
The ash content increased with increasing incorporation of SFMF. As observed in , composite flour samples with 0% SFMF differed significantly (p ≤ 0.05) from the composite flour formulations with 40%, 50%, 60%, 70%, and 90%. However, there was no significant difference (p ≤ 0.05) among composite samples with 40%, 50%, and 60%, 70%, and 90% SFMF incorporations. The ash content ranged from 2.21% to 4.89% among the composite flour samples. The highest total ash content was observed in composite flour sample with 90% SFMF whiles the least was recorded in the composite sample with 0% SFMF. The ash content obtained for the composite flour samples was slightly higher than what was reported by Twinomuhwezi et al. (Citation2020), who recorded a total ash content (1.01% to 0.83%) of composite flours of amaranth, rice, millet, and soybean. The mineral content of finger millet has been found to differ significantly among different finger millet varieties as factors such as genetic make-up and the environmental conditions dominant in the growing region affect its mineral content (Akonor et al., Citation2023c; Osei Tutu et al., Citation2024). This could account for the higher ash content recorded in the composite flour samples studied, especially the samples with SFMF incorporation, but low in composite flour sample with no SFMF.
There were significant differences (p ≤ 0.05) in protein content among all the composite flour samples, with composite flour sample having 0% SFMF incorporation recording the highest protein content value (12.75%) and composite flour sample with 90% SFMF recording the lowest protein content value of 9.80% as indicated in . These protein levels are higher than those reported by Ramashia et al. (Citation2019) who found the protein content of finger millet to be 7.77%. However, the findings of this study indicate that the protein content of the composite flour is within the reported range (4.88% to 15.58%) in sixteen finger millet studied by Singh and Srivastava (Citation2006). also indicates that the protein content of the composite flour formulations decreased significantly (p ≤ 0.05) as percentage of SFMF increased. This trend could be due to the fact that even though finger millet contains relatively high amounts of essential amino acids in its albumen and globulin fractions, its prolamin fraction is very low in lysine, arginine and glycine (Ife, Citation2017). This accounted for the varied amount of protein content in the composite flour formulations as percentage of SFMF increased.
The carbohydrate and fat content of the composite flour samples ranged from 52.65% to 68.33% and 1.87%–2.59%, respectively, as shown in . The carbohydrate levels are below the range reported by Salifu et al. (Citation2012) for some maize (75.35%–77.85%) in Ghana and Srilekha et al. (Citation2019) for finger millet (74.75%). It was observed that the carbohydrate content of composite flour formulations decreased significantly (p ≤ 0.05) as percentage of SFMF increased. The reduction in carbohydrates content with increasing percentage of SFMF in the composite flour samples could be attributed to the fact that the finger millet sprouted for 24 hours. Hence, some of the complex long chain carbohydrates might have been broken down into simple short chain polysaccharide and easily used up during the process of sprouting (Siddiqua et al., Citation2019). Ife (Citation2017) and Twinomuhwezi et al. (Citation2020) reported similar findings.
The pH of the composite sample with 90% SFMF significantly varied (p ≤ 0.05) from the other composite flour samples as shown in . The pH values ranged from 4.86 to 5.62, with composite flour with 0% SFMF having the highest value of 5.62. The pH values obtained on the composite flour samples also indicate that these samples are mildly acidic (and will have a sour taste). Again, it can be inferred from that the pH of the composite flour samples significantly (p ≤ 0.05) decreased with increasing SFMF percentage in the composite flour samples. This agrees with the finding of Saalia et al. (Citation2012) and Adedeji et al. (Citation2014). The decreases of pH values as SFMF increases indicate good quality composite flour, which reduces the microbiological load in food products (Ramashia et al., Citation2019).
presents the variations in colour parameters (L*, a*, b*, and ΔE*) for the composite flour samples. The results of the colour analysis revealed a significant distinction (p ≤ 0.05) in the L* values between the composite flour sample with 0% SFMF and those 40%–90% levels of SFMF incorporation. Although it was challenging to discern the colour differences among the composite flour samples by the naked eye, both L* and a* values decreased as SFMF content increased in the formulations. Consequently, the addition of SFMF to Maize and Date Fruit flours significantly reduced the L* and a* values for all the composite flour samples, except the control sample with 0% SFMF. This pattern of decreased L* and a* values with increasing SFMF content was consistent with observations in breakfast cereals blended with pumpkin powder (Ghafoori & Hosseini Ghaboos, Citation2018). On the other hand, the b* values notably increased with greater amounts of SFMF in the composite flour samples. The total colour difference (ΔE*) value served as a crucial indicator for evaluating colour changes in the flour samples. According to Wu et al. (Citation2021), a ΔE* value greater than or equal to 3.0 could signify a substantial visual change in many instances. ΔE indicated varying degrees of colour change in the composite flour samples with different levels of SFMF incorporation compared to the control. Notably, the composite flour with a 60% SFMF content exhibited the smallest ΔE* (0.86), while the highest ΔE* (10.01) was recorded in the sample with 0% SFMF. The overall colour change decreased as the level of SFMF substitution increased in the composite flour samples.
Table 4. Colour and total colour difference of composite flour samples.
All composite flour samples showed a significant (p ≤ 0.05) difference in their emulsifying capacities and stabilities as indicated in . The sample with 90% SFMF had a higher emulsifying capacity and stability whiles the sample without SFMF showed the least emulsifying capacity and stability. Similarly, Ocheme et al. (Citation2015) reported that the emulsion capacity of the flour made from finger millet with different germinating times, increased from 58.6% to 65.5% with increasing order of germination. This could be because of an increase in the area of the stabilized oil droplet at the interface signifying a function of the food components (Imtiaz et al., Citation2011). Emeka-Ike and Ike (Citation2020) also reported similar findings of the physicochemical properties of pumpkin seed composite flours. The emulsion stability of the composite flour samples significantly (p ≤ 0.05) increased with increasing the amount of SFMF. This may be due to colloidal particles carrying electrical charges that promote the stability of the colloid as well as in the formed emulsions by aiding particles of similar charge to resist each other thereby inhibiting their precipitation (Chandra et al., Citation2015). Again, these variations might be due to differences in protein subunit, molecular weight distribution and amino acid composition.
Table 5. Functional characteristics of composite flour samples.
Solubility is the amount of soluble solids in the supernatant in the determination of swelling volume (Singh et al., Citation2005). The amount in mL/g of the swelling power and the percentage of the solubility index of composite flour samples are presented in . The solubility index of the composite flour samples ranged from 2.40% to 27.34%. The solubility index of the composite flour samples increased with increasing SFMF incorporation (p < 0.05).
The highest value (27.34%) was obtained with the composite flour with 90% SFMF and the least (2.40%) with 0% SFMF. The increase in solubility index as the percentage of SFMF increased could be because of the increased amylase activity as well as increase in the levels of soluble sugars because of germination (Nefale & Mashau, Citation2018).
High solubility of composite flour samples with increasing sprouted SFMF indicates that the flour will nutritionally be suitable for infants (Milkesa, Citation2020). Swelling power indicates the water holding capacity of starch. The swelling power in commercial starches is important for the quality and texture of some food products because it stabilizes them against effects such as syneresis, which occasionally occurs during retorting or freezing (Kaur et al., Citation2011).
The swelling power ranged from 2.53 to 4.89 mL/g. Similarly, Ocheme and Chinma (Citation2008) carried out a study on the effects of soaking and germination on the physicochemical characteristics of millet flour for porridge production and reported an increase in the swelling power of millet flour because of soaking and germination. The increase in swelling power was because of an increase in soluble solids led to by the breakdown of lipid, fiber and larger amount of amylose–lipid complex in flour that could inhibit the swelling of starch granules (Ocheme et al., Citation2015; Osei Tutu et al., Citation2023). The observed higher swelling power of the composite flour samples could be because of the reduced fat content of the sprouted finger millet, indicating the utilization of fat by the growing finger millet during soaking and germination (Ramashia et al., Citation2019). Swelling capacity is regarded as a quality indicator in most food products, since it indicates the non-covalent bonding between molecules of starch granules (Iwe et al., Citation2016). Hence, composite flours with a good swelling power as in the case of the findings of this study, is very useful in the food manufacturing industry.
The bulk density of the composite flour samples ranged from (0.92 to 1.10 kg/m3) as shown in . Bulk density is an essential factor that determines the grade and test weight of the grains during drying, processing and storage (Adebowale et al., Citation2012). The highest bulk density was for the composite flour sample with 0% SFMF (1.10 kg/m3) and the least for the sample with 90% SFMF (0.92 kg/m3). The current study revealed that bulk density depends on the particle size as well as the initial moisture content of the samples under study. A higher bulk density suggests the suitability of flours for use in food preparations; on the other hand, a lower bulk density would be a great opportunity in the formulation of complementary weaning foods (Ramashia et al., Citation2018). In this study, bulk density for the composite flour samples decreased significantly (p < 0.05) with increasing amount of SFMF. Hence, with the exception of samples with 0% and 90% SFMF, the samples would be suitable to use in the preparation of instant weaning food formulations (Chandra & Samsher, Citation2013).
Percentage dispersibility of composite flour samples ranged from 50.97 ± 0.04 to 93.05 ± 0.10. Composite flour sample with 90% SFMF recorded the highest (93.05 ± 0.10) while the lowest value was recorded in the sample with 0% SFMF. Values obtained from the composite flour samples were all significantly different from each other in dispersibility. The result indicated that percentage dispersibility significantly increased with increasing SFMF in the samples. These findings were similar to those reported by Olapade et al. (Citation2014) who reported dispersibility ranging from 68% to 70.67% in Cassava-Bambara composite flours. According to Eke-Ejiofor (Citation2015), the increasing values of dispersibility may help in the reconstitution of starch in water to give fine and consistent paste during mixing. Similar findings were observed by Awolu et al. (Citation2017) who investigated the effect of the addition of pearl millet flour subjected to different processing on the pasting characteristics and cookies quality of rice-based composite flour.
shows the functional properties of the composite flour samples. It is indicated that the water absorption capacity (WAC) values for composite flour sample ranged from 2.13 to 2.92 mLg−1. The formulation with 90% SFMF had the highest absorption capacity (2.92 mLg−1) whiles formulation with 0% SFMF had the least (2.13 mLg−1). The values significantly (p ≤ 0.05) increased with increasing SFMF in the composite flour formulations, which could be because of the soaking and sprouting. Sprouting may have caused the hydrolysis of proteins and starches, hence the polar hydrophilic ends of these major chemical constituents of the composite flour samples, the carbohydrates, and proteins, which bind water molecules accounted for this. Also, the production of compounds such as soluble sugars during sprouting that have loose starch structure polymers have good water holding capacity, hence the higher WAC (Adedeji et al., Citation2014). Ramashia et al. (Citation2019) reported similar findings of WAC of finger millet flours. The increase in the WAC has a link with the increase in the amylose leaching and solubility and loss of starch crystalline structure (Dasa & Binh, Citation2019). Hence, high WAC of flour indicates that they can be very useful in the formulation of different food products including breakfast cereal, processed cheese, and bakery products and doughs.
Figure 1. Water and oil absorption capacity of flour samples.
SFMF 0, SFMF 40, SFMF 50, SFMF 60, SFMF 70, SFMF 80, and SFMF 90 are composite flour samples with 0%, 40%, 50%, 60%, 70%, 80%, and 90% of sprouted finger millet flour, respectively. Values for water and oil absorption capacity are average of triplicate result.
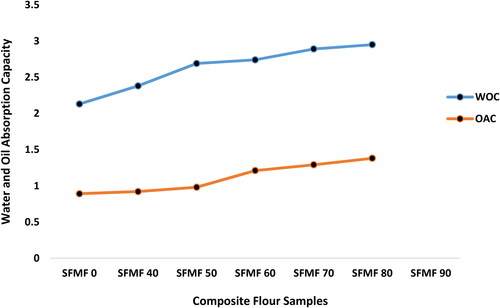
The OAC of composite flour samples ranged from 0.87 to 1.69 mLg−1. The formulation with 70% SFMF had the highest OAC value (1.29 mLg−1) while that with 0% SFMF had the least OAC value (0.87 mLg−1) (). Ramashia et al. (Citation2019) reported a similar trend. The increase in OAC with increasing SFMF percentage could be associated with the solubilization and dissociation of proteins leading to the exposure of the non-polar components contained in the protein molecules (Deepali et al., Citation2013; Shrestha & Srivastava, Citation2017; Tharise et al., Citation2014). However, the composite flours samples in this study are said to have the potential of being valuable in food structural interaction, for example, shelf-life extension, improved palatability, and retention of flavor in bakery products where the absorption of fat is desired (Elisa et al., Citation2015).
shows the mean liking scores of the sensory attributes and the mean overall acceptability scores for the five (5) composite breakfast cereal samples.
Table 6. Sensory evaluation of composite breakfast cereal samples.
Sensory scores given by panelists ranged from 5.53 to 8.90, an indication of different levels of liking the product. Breakfast cereal samples had significant (p ≤ 0.05) differences in all sensory attributes.
However, there were no significant differences (p ≤ 0.05) in the mean liking scores for breakfast cereal containing 40% to 60% finger millet flour in terms of taste, aroma, mouthfeel, and overall acceptability. Similarly, breakfast cereal containing 70% and 90% SFMF also showed no significant differences (p ≤ 0.05) in taste. Mouthfeel did not significantly differ (p ≤ 0.05) across breakfast cereal samples containing SFMF ranging from 0% to 70%, which may be attributed to a uniform particle size in the composite flour utilized (Okpala et al., Citation2013; Osei Tutu et al., Citation2024). Consequently, panelists were unable to distinguish between the mouthfeel of breakfast cereal samples made with SFMF ranging from 0% to 70%. However, some composite breakfast cereal samples exhibited, particularly in 90% SFMS, significant differences (p ≤ 0.05) in aroma, flavor, and overall acceptability scores (), although overall acceptability scores were generally high (all rated above 7). These variations in liking scores among certain composite breakfast cereal samples suggest that the addition of SFMF influenced the sensory properties and acceptability of the composite breakfast cereal samples. Overall, panelists favored composite breakfast cereal samples containing 40% and 60% SFMF over the control made solely from maize flour (). This indicates that substituting breakfast cereal formulations with 40% to 60% finger millet flour could result in composite breakfast cereal preferred over those containing only maize as the main ingredient.
Conclusion
This study has demonstrated that processing instant breakfast cereal with varying concentrations of finger millet, maize, and date fruit flours has notable effects on its physical, chemical, functional, and sensory attributes. Incorporating SFMF into MF and DF resulted in composite flour with higher fiber and ash content but lower carbohydrates, protein, and fats. Substituting MF with SFMF ranging from 40% to 70% positively impacted the pH, water, and oil absorption capacity, while negatively affecting the Tristimulus colour of the composite flour formulations. Composite breakfast cereal containing 40% to 60% SFMF emerged as the most preferred in terms of sensory characteristics and showed minimal deviation compared to samples with 0% SFMF. The addition of SFMF to the breakfast cereal samples also notably influenced panelists’ sensory perception. Although higher fiber content was recorded in all composite formulations, further exploration could focus on reducing fiber content due to its potential impact on mineral bioavailability, particularly in children in developing nations where undernutrition in vulnerable groups such as children is severe. Based on these findings, it is recommended to consider a 40 to 60% SFMF range when manufacturing a composite breakfast cereal with sprouted finger millet-maize-dates composite flour.
Ethical approval
This study obtained ethical approval with clearance number ECBAS 048/15–16, from the Ethics Committee of the College of Basic and Applied Science (ECBAS), University of Ghana, Legon, Accra, Ghana, was obtained for this study because there were semi-trained panel of human assessors used for sensory evaluation of food products. The panel of assessors gave informed consent before conducting the sensory evaluation.
Disclosure statement
No potential conflict of interest was reported by the authors.
Additional information
Funding
Notes on contributors
Reuben Acheampong
Reuben Acheampong (MPhil) is a research fellow and a PhD candidate in Food Science and Technology at the University of Ghana. His research centers on the characterization of biomolecules, specifically plant-derived proteins and starches, with a focus on the potential of underutilized, climate-resilient crops. He has experience in both academia and industry, having worked at the University of Ghana and Nestle, Ghana.
Crossby Osei Tutu
Dr. Crossby Osei Tutu (PhD) is a Lecturer and Research Scientist at the University of Ghana, Legon, Accra. His research focuses on the utilization of indigenous food crops that are climate-smart, underutilized, or at risk of extinction. He also works on developing improved technologies to ensure these crops can be successfully used in food and industrial applications. Additionally, he collaborates with research institutes and the food industry both locally and internationally.
Joris Gerald Niilante Amissah
Dr. Joris Gerald Niilante Amissah (PhD) is a Senior Lecturer at the University of Ghana, Legon. His research focuses on using processing and packaging technologies to develop innovative value-added food products for local consumption and export, enhancing the shelf-life and consumer acceptance of local Ghanaian foods, including dairy, livestock products, grains, tubers, fruits, and vegetables. He is also interested in reducing postharvest losses, food processing, preservation, and packaging.
Angelina Opoku Danquah
Prof. Angelina Opoku Danquah is an Associate Professor at the University of Ghana, Legon. Her research focuses on developing food products using underutilized foods to address nutritional problems in developing countries. These problems stem from factors like population growth, reliance on a few staple foods, and socio-cultural changes disadvantaging traditional African diets. To combat undernutrition, she advocates for using indigenous foods such as African yam bean, finger millet, tiger nuts, and oyster mushrooms to enhance the nutritional value of meals. Additionally, Prof. Danquah’s interests include adolescents’ eating patterns, food enzymology, and the food hygiene practices of street vendors.
Firibu Kwesi Saalia
Prof. Firibu Kwesi Saalia is a full Professor at the University of Ghana, and the inaugural holder of the OR Tambo Research Chair in Food Science and Technology, recognized for his pioneering work in food safety and quality. This chair is one of 10 Research Chairs appointed across Africa. His research interests include food processing (thermal and non-thermal), chemical and physical properties of foods, food chemistry and toxicology, and food nutraceuticals. He collaborates with the food industry locally and internationally.
References
- AACC. (2000). Approved method of the AACC (9th ed.). St. American Association of Cereal Chemists.
- Adebowale, A. A., Fetuga, G. O., Apata, C. B., & Sanni, L. O. (2012). Effect of variety and initial moisture content on physical properties of improved millet grains. Nigerian Food Journal, 30(1), 5–10. https://doi.org/10.1016/S0189-7241(15)30007-2
- Adedeji, O. E., Oyinloye, O. D., & Ocheme, O. B. (2014). Effects of germination time on the functional properties of maize flour and degree of gelatinization of its cookies. Africa Journal of Food Science, 8(1), 42–47.
- Akonor, P. T., Osei Tutu, C., Affrifah, N. S., Budu, A. S., & Saalia, F. K. (2023a). Kinetics of β-carotene breakdown and moisture sorption behavior of yellow cassava flour during storage. Journal of Food Processing and Preservation, 2023, 1–9. https://doi.org/10.1155/2023/2155029
- Akonor, P. T., Osei Tutu, C., Affrifah, N. S., Budu, A. S., & Saalia, F. K. (2023c). Effect of different drying techniques on the functionality and digestibility of yellow-fleshed cassava flour and its performance in food application. Journal of Food Processing and Preservation, 2023, 1–11. https://doi.org/10.1155/2023/1775604
- Akonor, P. T., Osei Tutu, C., Arthur, W., Adjebeng-Danquah, J., Affrifah, N. S., Budu, A. S., & Saalia, F. K. (2023b). Granular structure, physicochemical and rheological characteristics of starch from yellow cassava (Manihot esculenta) genotypes. International Journal of Food Properties, 26(1), 259–273. https://doi.org/10.1080/10942912.2022.2161572
- Amin, M., & Flowers, T. H. (2014). Evaluation of Kjeldahl digestion. Journal of Research Science, 15(2), 159–179.
- Awolu, O. O., Olarewaju, O. A., & Akinade, A. (2017). Effect of the addition of pearl millet flour subjected to different processing on the antioxidants, nutritional, pasting characteristics and cookies quality of rice-based composite flour. Journal of Nutritional Health & Food Engineering, 7(2), 247–256. https://doi.org/10.15406/jnhfe.2017.07.00232
- Bhaskarachary, K., Ananthan, R., & Longvah, T. (2008). Carotene content of some common (cereals, pulses, vegetables, spices and condiments) and unconventional sources of plant origin. Food Chemistry, 106(1), 85–89. https://doi.org/10.1016/j.foodchem.2007.05.071
- Blay, M. Y. (2012). Relative Preference Mapping. Consumer preference mapping using wine show derived data [Unpublished Doctoral thesis] (Department of Food Science, Charles Sturt University, Australia. 150–160.
- Chandra, Dinesh, Chandra, Satish, Sharma, A.K., Pallavi, (2016). Review of finger millet (Eleusine coracana (L.) Gaertn): A power house of health benefiting nutrients. Food Science and Human Wellness, 5(3), 149–155. https://doi.org/10.1016/j.fshw.2016.05.004
- Chandra, S., & Samsher, S. (2013). Assessment of functional properties of different flours. African Journal of Agricultural Research, 8(38), 4849–4852.
- Chandra, S., Singh, S., & Kumari, D. (2015). Evaluation of functional properties of composite flours and sensorial attributes of composite flour biscuits. Journal of Food Science and Technology, 52(6), 3681–3688. https://doi.org/10.1007/s13197-014-1427-2
- Chinma, C. E., Abu, J. O., & Akoma, S. N. (2012). Effect of germinated tiger nut and Moringa flour blends on the quality of wheat-based bread. Journal of Food Processing and Preservation, 38(2), 721–727. https://doi.org/10.1111/jfpp.12023
- Contreras-Jiménez, B., Torres-Vargas, O. L., & Rodríguez-García, M. E. (2019). Physicochemical characterization of quinoa (Chenopodium quinoa) flour and isolated starch. Food Chemistry, 298, 124982. https://doi.org/10.1016/j.foodchem.2019.124982
- Dasa, F., & Binh, L. N. (2019). A comparative study on rheological, functional and color properties of improved Millet Varieties and Injera. Journal of Agricultural Science and Food Research, 10(3), 1–8. https://doi.org/10.35248/2593-9173.19.10.267
- Deepali, A., Anubha, U., Preeti, S. N., & Krishi, V. K. D. (2013). Functional characteristics of malted flour of foxtail, barnyard and little millets. Annals Food Science and Technology, 14(1), 44–49.
- Eke-Ejiofor. (2015). Physico-chemical and pasting properties of starches from cassava, sweet potato and three leaf yam and their application in salad cream production. International Journal of Biotechnology and Food Science, 3(2), 23–30.
- Elisa, J., & Rusmarilin, H., & Ridwansyah, R., & Yusraini, E., (2015). Functional and rheological properties of composite flour from sweet potato, maize, soybean and xanthan gum. Journal of the Saudi Society of Agricultural Sciences, 2, 171, 177. 16. https://doi.org/10.1016/j.jssas.2015.05.005
- Emeka-Ike, P. C., & Ike, C. C. (2020). Evaluation of physicochemical properties and microbiological safety of pumpkin (Cucurbita pepo) seed composite flours. GSC Biological and Pharmaceutical Sciences, 12(3), 061–072.
- Frona, D., Janos, S., & Harangi-Rakos, M. (2019). The challenge of feeding the poor. MDPI Journal for Sustainability, 2017, 3–4.
- Ghafoori, F., & Hosseini Ghaboos, H. (2018). Physicochemical and sensory characteristics of breakfast cereals blended with pumpkin powder. Iranian Journal of Nutrition Science and Food Technology, 13(1), 95–104. http://nsft.sbmu.ac.ir/article-1-2322-en.html.
- Ife, I. (2017). Effect of germination time on the proximate composition and functional properties of moringa seed flour. 6(2), 117–133.
- Imtiaz, H., Burhan-Uddin, M., & Gulzar, M. (2011). Evaluation of weaning foods formulated from germinated wheat and mungbean from Bangladesh. African Journal of Food Science, 5(17), 897–903.
- Iwe, M. O., Onyeukwu, U., & Agiriga, A. N. (2016). (2016). Proximate, functional & pasting properties of FARO 44 rice, African yam bean & brown cowpea seeds composite flour. Cogent Food & Agriculture, 2(1), 1142409. https://doi.org/10.1080/23311932.2016.1142409
- Kalogianni, E., Xynogalos, V. A., Karapantsios, T. D., & Kostoglou, M. (2002). Effect of feed concentration on the production of pregelatinized starch in a double drum dryer. LWT, 35(8), 703–714. https://doi.org/10.1006/fstl.2002.0925
- Kaur, M., Oberoi, D. P., Sogi, D. S., & Gill, B. S. (2011). Physicochemical, morphological and pasting properties of acid treated starches from different botanical sources. Journal of Food Science and Technology, 48(4), 460–465. https://doi.org/10.1007/s13197-010-0126-x
- Li, G., & Zhu, F. (2017). Physicochemical properties of quinoa flour as affected by starch interactions. Food Chemistry, 221, 1560–1568. https://doi.org/10.1016/j.foodchem.2016.10.137
- Lu, Y. (2023). Impacts of parental breakfast consumption literacy on children’s home breakfast consumption. Nutrition and Health, 2601060231159943. https://doi.org/10.1177/02601060231159943
- Mandge, H. M., Sharma, S., & Dar, B. N. (2014). Instant multigrain porridge: effect of cooking treatment on physicochemical and functional properties. Journal of Food Science and Technology, 51(1), 97–103. https://doi.org/10.1007/s13197-011-0461-6
- Milkesa, F. (2020). Review on some cereal and legume based composite biscuits. International Journal of Agricultural Science and Food Technology, 6, 101–109. https://doi.org/10.17352/2455-815X.000062
- Nasir, M., Butt, M. S., Faqir, M., A., Sharif, K., & Minhas, R. (2003). Effect of moisture on the shelf life of wheat flour. International Journal of Agriculture and Biology, 5(4), 458–459.
- Nefale, F. E., & Mashau, M. E. (2018). Effect of germination period on the physicochemical, functional and sensory properties of finger millet flour and porridge. Asian Journal of Applied Sciences, 6(5), 360–367. https://doi.org/10.24203/ajas.v6i5.5466
- Ocheme, B., Adedeji, O. E., Lawal, G., & Zakari, U. M. (2015). Effect of germination on functional properties and degree of starch gelatinization of sorghum flour. Journal of Food Research, 4(2), 159–165. https://doi.org/10.5539/jfr.v4n2p159
- Ocheme, O. B., & Chinma, C. E. (2008). Effects of soaking and germination on some physicochemical properties of millet flour for porridge production. Journal of Food Technology, 6(5), 185–188.
- Okaka, J. C., & Potter, N. N. (1997). Functional properties of cowpea wheat flour blends in bread making. Journal of Food Science, 42(3), 828–833. https://doi.org/10.1111/j.1365-2621.1977.tb12614.x
- Okpala, L., Okoli, E., & Udensi, E. (2013). Physico-chemical and sensory properties of cookies made from blends of germinated pigeon pea, fermented sorghum and cocoyam flour. Food Science & Nutrition, 1(1), 8–14. https://doi.org/10.1002/fsn3.2
- Olapade, A. A., Babalola, Y. O., & Aworth, O. C. (2014). Quality attributes of fufu (fermented cassava) flour supplemented with bambara flour. International Food Research Journal, 21(5), 2025–2032.
- Omotayo Jimoh, M., Olufemi Olurin, T., & Seun Odunayo, O. (2023). Development and quality evaluation of extruded breakfast cereal from blends of ofada rice and cowpea (Vigna unguiculata) with date palm fruit. Journal of Agriculture and Crops, 93(93), 293–301. https://doi.org/10.32861/jac.93.293.301
- Onyango, C. A., Ochanda, S. O., Mwasaru, M. A., Ochieng, J. K., & Mathooko, F. M. (2012). Development of instant breakfast cereals from optimized flours of pearl millet, red and white sorghum. Journal of Applied Biosciences, 51, 3559–3566.
- Osei Tutu, C., Amissah, J. G. N., Amissah, J. N., Akonor, P. T., Arthur, W., Budu, A. S., & Saalia, F. K. (2023). Physicochemical and microstructural characteristics of Frafra potato (Solenostemon rotundifolius) starch. International Journal of Food Properties, 26(1), 1624–1635. https://doi.org/10.1080/10942912.2023.2228513
- Osei Tutu, C., Amissah, J. G. N., Amissah, J. N., Akonor, P. T., Budu, A. S., & Saalia, F. K. (2024). (2024). Application of Frafra potato (Solenostemon rotundifolius) flour in the development of gluten-free bread. Heliyon, 10(2), e24521. https://doi.org/10.1016/j.heliyon.2024.e24521
- Osei Tutu, C., Amissah, J. G. N., Amissah, J. N., Akonor, P. T., Budu, A. S., & Saalia, F. K. (2024). (2024). Physical, chemical, and rheological properties of flour from accessions of Frafra potato (Solenostemon rotundifolius). Journal of Agriculture and Food Research, 15, 100974. https://doi.org/10.1016/j.jafr.2024.100974
- Osei Tutu, C., Amissah, J. G. N., Amissah, J. N., & Saalia, F. K. (2019). Physicochemical and sensory characteristics of bread made from wheat-frafra potato (Solenostemon rotundifolius) composite flour. Science and Development, 3, 20–29.
- Padulosi, S., Hodgkin, T., Williams, J. T., & Haq, N. (2002). Underutilized crops: trends, challenges and opportunities in the 21st Century. In Engels, J., Rao, V.R. and Jackson, M. (Eds.), Managing plant genetic diversity (pp. 323–338). CAB International.
- Pore, M. S., & Magar, N. G. (1979). Nutrient composition of hybrid varieties of finger millet. India Journal of Agricultural Sciences, 49(7), 526–531.
- Pragya, S. (2012). Finger millet for food and nutritional security. African Journal of Food Science, 6(4), 77–84.
- Rai, S., Kaur, A., & Singh, B. (2014). Quality characteristics of gluten free cookies prepared from different flour combinations. Journal of Food Science and Technology, 51(4), 785–789. https://doi.org/10.1007/s13197-011-0547-1
- Ramashia, S. E., Anyasi, T. A., Gwata, E. T., Meddows-Taylor, S., & Jideani, A. I. O. (2019). Processing, nutritional composition and health benefits of finger millet sub-Saharan Africa. Food Science and Technology, 39(2), 253–266. https://doi.org/10.1590/fst.25017
- Ramashia, S. E., Gwata, E. T., Meddows-Taylor, S., Anyasi, T. A., & Jideani, A. I. O. (2018). Some physical and functional properties of finger millet (Eleusine coracana) obtained in sub-Saharan Africa. Food Research International (Ottawa, Ont.), 104(2017), 110–118. https://doi.org/10.1016/j.foodres.2017.09.065
- Rooney, L. W., & Serna-Saldivar, S. O. (2000). Handbook of cereal science and technology (2nd ed.). Marcel Dekker.
- Saalia, F. K., Ankamah, S., Otubuah, B., Barfi, N. K., & Tano-Debrah, K. (2012). Development and characterization of low viscosity porridge (Koko) flour by co-fermenting with millet malt, 1, 551. https://doi.org/10.4172/scientificreports.551
- Salifu, A., Okai, D., Boateng, M., & Ewool, M. (2012). A comparative study of local Ghanaian maize imported yellow maize and two new quality protein maize (qpm) varieties–etubi. Online Journal of Animal and Feed Research, 2(3), 218–223.
- Shrestha, R., & Srivastava, S. (2017). Functional properties of finger millet and barnyard millet flours and flour blends. International Journal of Scientific Research (Ahmedabad, India), 6(6), 775–780.
- Siddiqua, A., Ali, M., & Ahmed, S. (2019). Functional properties of germinated and non-germinated cereals: A comparative study. Bangladesh Journal of Scientific and Industrial Research, 54(4), 383–390. https://doi.org/10.3329/bjsir.v54i4.44573
- Singh, S., Raina, C. S., Bawa, A. S., & Saxena, D. C. (2005). Effect of heat-moisture treatment and acid modification on rheological, textural and differential scanning calorimetry characteristics of sweet potato starch. Journal of Food Science, 70(6), E373–E378. https://doi.org/10.1111/j.1365-2621.2005.tb11441.x
- Singh, P., & Srivastava, S. (2006). Nutritional composition of sixteen new varieties of finger millet. Journal Community of Mobilization and Sustainable Development, 1(2), 81–84.
- Sinha, R., & Sharma, B. (2017). Use of finger millet in cookies and their sensory and nutritional evaluation. Asian Journal of Dairy and Food Research, 36(03), 264–266. https://doi.org/10.18805/ajdfr.v36i03.8962
- SRID-MoFA. (2011). Statistics Research and Information Directorate (SRID) ‘Agriculture in Ghana: Facts and Figures’, May 2011.
- Srilekha, K., Kamalaja, T., Uma Maheswari, K., & Neela Rani, R. (2019). Nutritional composition of little millet flour. International Research Journal of Pure and Applied Chemistry, 1–4. https://doi.org/10.9734/irjpac/2019/v20i430140
- Thakur, M. (2014). Underutilized food crops : treasure for the future. India Research Journal, 5(2), 174–183.
- Tharise, N., Julianti, E., & Nurminah, M. (2014). Evaluation of physico-chemical and functional properties of composite flour from cassava, rice, potato, soybean and xanthan gum as alternative of wheat flour. International Food Research Journal, 21(4), 1641–1649.
- Thilagavathi, T., Kanchana, S., Banumathi, P., Hemalatha, G., Vanniarajan, C., Sundar, M., & Ilamaran, M. (2015). Physico-chemical and functional characteristics of selected millets and pulses. Indian Journal of Science and Technology, 8(S7), 147–155. https://doi.org/10.17485/ijst/2015/v8iS7/70075
- Twinomuhwezi, H., Awuchi, C. G., & Rachael, M. (2020). Comparative study of the proximate composition and functional properties of composite flours of. American Journal of Food Science and Nutrition, 6(1), 6–19.
- Wu, W., Xiao, G., Yu, Y., Xu, Y., Wu, J., Peng, J., & Li, L. (2021). Effects of high pressure and thermal processing on quality properties and volatile compounds of pineapple fruit juice. Food Control, 130, 108293. https://doi.org/10.1016/j.foodcont.2021.108293
- Yadav, D. N., Thakur, N., & Sunooj, K. V. (2012). Effect of partially de-oiled peanut meal flour (DPMF) on the nutritional, textural, organoleptic and physico-chemical properties of breads. Food and Nutrition Sciences, 03(04), 471–476. https://doi.org/10.4236/fns.2012.34067