
 ?Mathematical formulae have been encoded as MathML and are displayed in this HTML version using MathJax in order to improve their display. Uncheck the box to turn MathJax off. This feature requires Javascript. Click on a formula to zoom.
Abstract
A new term, the occupancy rate (OR) of the ancestors of a breed, defined as the proportion of autosomal genomic information inherited from a common ancestor, has been proposed. The associations between the ORs of three paternal ancestors (Tajiri, Kedaka, and Fujiyoshi) of Japanese Black cattle (JBK) and carcass traits of the progeny of sire candidates were analyzed using data from the field progeny test conducted by the Livestock Improvement Association of Japan. The results suggest that further Kedaka OR accumulation will positively affect beef marbling score (BMS) and carcass weight (CW) and further Fujiyoshi OR accumulation will positively affect BMS. Thus, the optimal range that intersects the Fujiyoshi and Kedaka proportions produce the best CW and BMS. Moreover, further Tajiri OR accumulation negatively affects CW. Additionally, further Tajiri OR accumulation will positively affect BMS, but the effect is less than those of Kedaka and Fujiyoshi ORs. I conclude that the OR is a useful index for evaluating economic traits in animal genetic resources.
PUBLIC INTEREST STATEMENT
Sustainable livestock industry development plays a crucial role in achieving Sustainable Development Goals. Maintaining genetic diversity is crucial for conserving animal genetic resources. The genetic diversity of cattle breeds, particularly in developed countries, has rapidly decreased owing to the introduction of artificial insemination using frozen semen in the 1960s. This is due to the limited number of sires with high productivity used for offspring production, even after they pass away. In beef and dairy cattle, sire candidate performance has been evaluated primarily using the economic traits of their progeny meat and production as indexes. Therefore, sire breeding is time-consuming and laborious. My goal is to establish an innovative sire breeding program that utilizes innovative selection indexes to minimize the time and effort required.
REVIEWING EDITOR:
1. Introduction
Maintaining genetic diversity is crucial to conserve animal genetic resources. The effective population size (Ne) is one of the most important parameters in the definition of selection programs because its magnitude determines the effects of both random genetic drift and inbreeding (Caballero, Citation1994; Falconer, Citation1989). According to FAO (Citation2015), a population with critical Ne level (below 50 animals) will begin to lose fitness and viability in the long term. Among animal genetic resources, thoroughbred racehorses are the most famous and largest closed animal populations worldwide. All modern thoroughbreds trace back to three stallions, Byerley Turk, Darley Arabian, and Godolphin Arabian, imported into England from the Middle East in the late 17th and early 18th centuries. Continued selection over 300 years has raised the question of whether genetic diversity has remained. According to McGivney et al. (Citation2020), the Ne of the (1) global population was 330; (2) North American and South Africa cohorts were the highest and the lowest, respectively (Ne = 226 and 93, respectively); and (3) Australian/New Zealander and European cohorts were moderate (Ne = 197 and 198, respectively). They also suggested that the Ne was higher when all regions were considered together, indicating an opportunity to exploit regional variation to improve genetic diversity in the global population and maintain thoroughbred genetic diversity beyond the critical Ne level set by the FAO (Citation2015). Meanwhile, the genetic diversity of cattle breeds in developed countries has been rapidly decreasing due to the introduction of artificial insemination (AI) using frozen semen in the 1960s, as only few sires with high productivity were used for offspring production, even after they passed away. For example, Wickham and Banos (Citation1998) reported that the five most used sires accounted for 50% progeny-tested Holstein bulls born in 1990, compared with 14% in 1979. According to Makanjuola et al. (Citation2020), the Ne for Canadian Holsteins and Jerseys are 43–66 and 64–85, respectively. Thus, the introduction of innovative technologies, such as AI and genomic selection, will lead to a rapid loss of genetic diversity, even in large population breeds such as Holstein. Meanwhile, the introduction of innovative technologies into local breeds can result in a significant loss of genetic diversity, unlike in breeds with large populations and global distribution. Xu et al. (Citation2019) estimated that the current Ne for North, South, and Southwest Chinese cattle breeds are 34, 27, and 31, respectively. Nomura et al. (Citation2001) estimated that the Ne of Japanese Black cattle (JBK) decreased from 32.1 in 1987 to 13.4 in 1996, suggesting that the current Ne of JBK populations is likely to be lower than that in 1996. These reports suggest that the Ne levels in local cattle breeds in China and Japan are substantially lower than the FAO critical levels.
JBK, Japanese Brown, Japanese Shorthorn, and Japanese Polled are four breeds that originated in Japan and are designated as ‘Wagyu’ cattle (Japan Livestock Products Export Promotion Council Secretariat Citation2020). Of the four breeds, JBK accounts for more than 98% of the Wagyu population, and is recognized worldwide for its exceptional meat quality and high marbling. The population size of JBK in Japan in 2023 was 1.88 million (Ministry of Agriculture, Forestry and Fisheries, Citation2023), and its meat exports have been increasing yearly (Agriculture & Livestock Industries Corporation Citation2021). Tajiri, Kedaka, and Fujiyoshi are the most prominent paternal ancestors in the JBK, although other minor paternal ancestors are locally maintained (Komatsu et al., Citation2018).
Ne is an excellent index for measuring genetic diversity in population genetics, but does not correlate with the economic traits of individual animals. It is well-established that excessive increases in inbreeding coefficients (F-indexes) negatively affect production traits. Recent studies have provided insights into the numerical value of the negative correlation of F-indexes with milk production traits in Holstein (Makanjuola et al., Citation2020) and with reproductive traits in JBK (Nishio et al., Citation2023). However, an additional index having a clear correlation with production traits, and hopefully positively correlated with production traits is necessary. The pedigree of a breed is fully traceable, particularly when only a few paternal ancestors are involved in producing all the progeny, such as in Holsteins and JBK. Thus, the occupancy rate (OR) of the common ancestor may act as a useful index for predicting individual economic values. This is my first attempt to use the term ‘OR,’ which represents the proportion of the autosomal genome information inherited by an individual progeny from a common ancestor. A descriptive figure is shown (). This study aimed to evaluate whether the ORs of common ancestors in sires influenced the phenotypic traits in their progenies.
Figure 1. Diagrams showing how the occupancy rate (OR) is calculated for a sire. (a) Basic explanation of common ancestor bull OR calculation. Two examples of pedigree are presented. The males and females are represented by squares and circles, respectively. The blue squares indicate ancestral bulls. The red squares represent the sires for which the OR of the ancestral bull was calculated. (b) Practical explanation of common ancestor bull OR calculation. Males and females are represented by squares and circles, respectively. The red squares represent the sires for which the OR of the ancestral bull was calculated. We calculated the ORs of ancestors A, B, and C using EquationEquation (1)(1)
(1) in the main text.
Theoretically, the sum of ORs can be between 0 and 0.5. If the sum of the ORs was zero, there were no A, B, or C records in the pedigree. If the OR was 0.5, it meant that A, B, or C occupied every male ancestor in the pedigree.
As the great-grandfather of the sire is ancestor A in the example pedigree, we recognize that the sire (red square) belongs to paternal line A. However, in practice, the OR of A is equal to the OR of C and lower than that of B.
 in the main text.Theoretically, the sum of ORs can be between 0 and 0.5. If the sum of the ORs was zero, there were no A, B, or C records in the pedigree. If the OR was 0.5, it meant that A, B, or C occupied every male ancestor in the pedigree.As the great-grandfather of the sire is ancestor A in the example pedigree, we recognize that the sire (red square) belongs to paternal line A. However, in practice, the OR of A is equal to the OR of C and lower than that of B.](/cms/asset/b9614808-cc56-47d3-be42-7b1dc4801b11/oafa_a_2365222_f0001_c.jpg)
2. Materials and methods
2.1. Materials and data collection
2.1.1. General description of the JBK sire selection process
In Japan, JBK sires are typically selected based on individual performance, progeny, or field progeny tests (Japanese Society of Animal Science, Citation2018). Individual performance tests were used to evaluate the daily gain and feed conversion rates of 7–11-month-old satiated sire candidates (Japanese Society of Animal Science, Citation2018). The winners of the individual performance tests then advanced to the progeny test, which involves raising castrated sons of a candidate in groups (n = 8) and examining their weight gain, feed intake, feed efficiency, meat quantity, and meat quality at a public institution (Japanese Society of Animal Science, Citation2018). Winners of the progeny test advanced to the field progeny test, which is a fattening test involving more than 15 steers and heifers consigned to commercial beef cattle farms throughout Japan. Steers and heifers were raised for approximately 32 and 29 months, respectively. Subsequently, their carcass traits were recorded (Japanese Society of Animal Science, Citation2018). As the fatting results of the field progeny test were obtained on commercial farms, and the fatting period was close to the actual marketing age, producers used the data as a factor in selecting semen from the selling catalog.
2.1.2. Phenotypic data collection
In this study, data of JBK sire candidates brought to the field progeny test from late fiscal years 2010 to late 2019 were collected from the homepage of the Livestock Improvement Association of Japan (LIAJ). During the study period, 342 candidate sires were identified. Among them, sire candidates belonging to minor paternal lines (eight Shigekane, two Eiko, and two 38-Iwata) were excluded. Then, 22 sire candidates from the Okayama, Hiroshima, Tottori, Shimane, and Kumamoto prefectures were excluded because they had local paternal lines. Prefectural sires were also excluded owing to the intense competition between Wagyu beef production areas in Japan, and many prefectures refuse to distribute semen outside the prefecture. Therefore, we should not invoke any particular prefecture. Consequently, 308 candidate sires from the Tajiri, Fujiyoshi, and Kedaka paternal lines developed by LIAJ and the National Livestock Breeding Center (NLBC) were selected. LIAJ is a general incorporated association supported by the prefectures and relatives of livestock producers in Japan, whereas NLBC is a Japanese government-sponsored agency. Therefore, this study treats information from the LIAJ website, including LIAJ and NLBC data, as publicly available.
Data from the field progeny test included the beef marbling score (BMS, no), carcass weight (CW, kg), loin muscle area (LMA, cm2), rib thickness (RT, cm), subcutaneous fat thickness (SFT, cm), and carcass yield (YE) in steers and heifers. BMS, CW, LMA, RT, SFT, and YE are the carcass traits of the offspring. Steer and heifer datasets were collected from each candidate sire. Data were measured in accordance with the Japanese Grading Standards for beef (Japan Meat Grading Association, JMGA, Citation2024). The BMS was graded from 1 (very poor) to 12 (very abundant). The BMS is a ratio scale but appears to be distributed normally; therefore, it was considered an interval scale in this study. To make it easy for non-Japanese people to understand how to measure and calculate the traits BMS, CW, LMA, RT, SFT, and YE, referring to Gotoh et al. (Citation2014) is recommended.
2.1.3. Pedigree data collection
The pedigree of the 308 candidate sires was obtained from the Gyugle and Usi-wiki websites for as many generations as possible until they were connected to the three common ancestors, Tajiri, Kedaka, and Fujiyoshi.
2.2. Calculation of inbreeding coefficient and or of common ancestors
The inbreeding coefficient (Wright’s F (%)) of each candidate sire was calculated as described by Nakajima (Citation2009).
The OR of common ancestor sires per candidate sire was calculated as follows:
(1)
(1)
where n is the number of generations from the sire to the common ancestor bulls and CA is the number of common ancestors, such as Tajiri, Fujiyoshi, and Kedaka, identified per generation. The ORs for Tajiri and Kedaka were calculated using EquationEquation (1)
(1)
(1) , with each of them as their common ancestor. To calculate Fujiyoshi’s OR, the paternal lines of Tajiri and Fujiyoshi had to be separated, because Shiromatsu, the maternal grandfather of Dai-7-Itozakura, belonged to the Tajiri paternal line. Therefore, in this study, Dai-14-Shige, the father of Dai-7-Itozakura, was considered the common ancestor of Fujiyoshi’s paternal line, and the OR of Fujiyoshi was calculated.
2.3. Target traits and their statistical analyses in the present study
2.3.1. Target traits
In Japan, beef quality is determined by assessing the BMS, beef color score (BCS), beef firmness (FIR), and texture (TEX). According to Inoue et al. (Citation2017), the BMS is the most important trait for beef grading because it highly correlates with the FIR, TEX, and BCS. Moreover, beef is graded in combination with the YE, and its quality and unit price per grade were determined. The total price per head was determined by multiplying the unit price by the CW. Therefore, BMS and CW were considered significant traits in this study.
2.3.2. Statistical analyses
The generalized linear model (GLM) procedure was performed to determine the effects of ORs of Tajiri, Kedaka, and Fujiyoshi on BMS and CW using Minitab ver. 18 (Minitab LLC., State College, PA, USA).
BMS and CW was estimated using the following equations:
(2)
(2)
(3)
(3)
where BMS and CW are the response variable for BMS and CW, respectively; F is Wright’s F (%); Tajiri, Kedaka and Fujiyoshi are OR of each ancestor; μ is the intercept of the model formula; the sex effect (Gender) is a covariate coefficient with b0 being 0 and 1 for heifer and steer, respectively; b1–b9 are covariate coefficients of BMS or CW on each traits; e is the residual standard error. The GLMs were calculated using Minitab version 18 (Minitab LLC., State College, PA, USA). The YE was not used in EquationEquations (2)
(2)
(2) and Equation(3)
(3)
(3) because it predicts multiple collinearity problems. YE for meat-type cattle is a virtual value obtained from the LMA, RT, 50% CW, and SFT as follows (JMGA):
(4)
(4)
When YE was added to the model formula, LMA, RT, CW, and SFT were included in the calculation formula many times.
The percentage of variance in the ORs explained by the models was calculated using the following formula:
(5)
(5)
where F variance (Fvar) is the residual variance from the full models in EquationEquations (2)
(2)
(2) and Equation(3)
(3)
(3) , and R variance (Rvar) is the residual variance from the reduced models omitting the ORs of Tajiri, Kedaka, and Fujiyoshi from EquationEquations (2)
(2)
(2) and Equation(3)
(3)
(3) .
Bell Curve for Excel (Social Survey Research Information Co., Ltd., Tokyo, Japan) was used for other statistical analyses, such as the calculation of the mean and standard deviation in a group and Pearson’s correlation coefficient between carcass traits.
3. Results
3.1. Summary of phenotypic data and indexes obtained from pedigree information
summarizes the phenotypic data according to sex, including the BMS, CW, LMA, RT, SFT, and YE. summarizes the indexes obtained from the pedigree information, such as Wright’s F and Tajiri, Kedaka, and Fujiyoshi ORs. BMS, CW, LMA, RT, SFT, and YE were normally distributed, whereas Wright’s F and Tajiri, Kedaka, and Fujiyoshi ORs were not.
Table 1. Summary of the carcass traits of the 308 sire candidates tested.
Table 2. Summary of Wright’s F and ORs of Tajiri, Kedaka, and Fujiyoshi in the sire candidates (n = 308) tested.
3.2. Phenotypic correlations among carcass traits
The pairwise correlations between carcass traits are shown in . The BMS was positively associated with CW, LMA, RT, and YE, while CW was positively associated with BMS, LMA, RT, ST, and YE in steers and heifers. Moreover, LMA was significantly correlated with BMS (heifer: 0.7470; steer, 0.6697) and CW (heifer, 0.5709; steer, 0.5055). Furthermore, YE was significantly correlated with BMS (heifer, 0.6489; steer, 0.5752) and LMA (heifer, 0.8385; steer, 0.8403). As YE is a virtual value obtained from the LMA, RT, 50% CW, and SFT, its correlation with the other traits may be interpreted as artifacts.
Table 3. Pairwise correlations between carcass traits recorded for steers (below diagonal divide) and heifers (above diagonal divide).
3.3. Effects of Tajiri, Kedaka, and Fujiyoshi ORs on BMS in progenies produced by sire candidates
The equation for estimating BMS for steers is as follows:
(6)
(6)
For estimating the BMS for heifers, 0.286 is removed from the formula.
The details of the model are listed in . The BMS was significantly affected by factors other than RT and SFT in both the full GLM and the model omitting ORs. The R2 (%) of the full GLM was 53.75, whereas that of the model that omitted ORs was 52.26. The variance percentage due to the ORs of the three ancestors was 3.11%.
Table 4. Effects of ORs of the most prominent paternal ancestors Tajiri, Kedaka, and Fujiyoshi on BMS in JBK sires.
3.4. Effects of Tajiri, Kedaka, and Fujiyoshi ORs on CW in progenies produced by sire candidates
By estimating the equation for CW for steers is as follows:
(7)
(7)
For the estimation of CW for heifers, 38.47 is removed from the formula.
Details of the model are listed (). In the model omitting ORs from the full GLM, CW was significantly affected by factors other than F (%). In the full GLM, CW was significantly affected by factors other than F (%), Tajiri OR, and Fujiyoshi OR. The R2 (%) of the full GLM was 72.33, whereas that of the model that omitted ORs was 66.98. There was a variance of 16.28% in the ORs of the three ancestors.
Table 5. Effects of ORs of the most prominent paternal ancestors Tajiri, Kedaka, and Fujiyoshi on CW in JBK sires.
3.5. Effects of ORs of Kedaka and Fujiyoshi on the combination of BMS and CW
EquationEquations (6)(6)
(6) and Equation(7)
(7)
(7) for estimating the BMS and CW, respectively, are simply transformed as follows:
(8)
(8)
(9)
(9)
The Tajiri, Kedaka, and Fujiyoshi ORs were 0.020–0.221, 0–0.179, and 0–0.113, respectively (). The sum of Tajiri, Kedaka, and Fujiyoshi ORs in the 308 sires is 0.188 ± 0.0244 (mean ± standard deviation). Based on these data, the simulation data for BW and CW were calculated using EquationEquations (8)(8)
(8) and Equation(9)
(9)
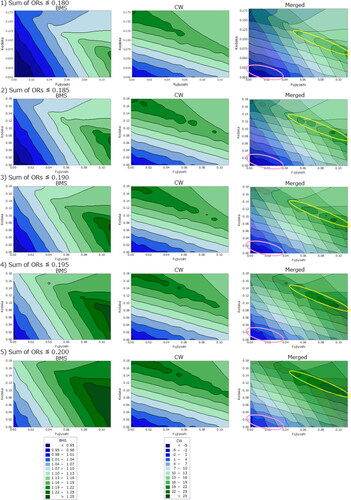
(9) , assuming that the Tajiri, Kedaka, and Fujiyoshi ORs were 0–0.22, 0–0.18, and 0–0.11, respectively. shows the simulation data of the relationship between BMS and CW vs. Fujiyoshi OR (x-axis) and Kedaka OR (y-axis) when the sum of the three ORs was ≤0.180, 0.185, 0.190, 0.195, and 0.200. The BW and CW plots are shown on the left and center, respectively. Merged images between the BW and CW plots are displayed on the right, with identical sum of the ORs. Sires that fell in the overlapping area between the parts those exhibiting high BMS in the left plot and those high CW in the middle plot were considered to have the most advantages for both traits. The yellow circles indicate the areas in the right plots. The pink circled area, indicating low Kedaka and Fujiyoshi ORs. Individuals with extremely high Tajiri OR were located in this area. The sires in the area were assumed to have no merit in terms of BMS or CW.
Figure 2. Simulation data of the relationship between beef marbling score (BMS) and carcass weight (CW) vs. Fujiyoshi occupancy rate (OR) (x-axis) and Kedaka OR (y-axis), respectively, when the sum of the three ORs ≤ 0.180, 0.185, 0.190, 0.195, and 0.200.
3.6. Comparative analysis of carcass traits among Tajiri, Kedaka, and Fujiyoshi paternal lines
shows a data comparison of the progeny obtained from the 308 sire candidates, with the data of each candidate sorted into three paternal lines by sex. The Tajiri steers and heifers had a significantly lower (P < 0.05) CW than the Kedaka or Fujiyoshi steers and heifers. Moreover, the Tajiri steers had a significantly lower LMA than Kedaka steers (P < 0.05), while Tajiri heifers had a significantly lower (P < 0.05) LMA than Kedaka and Fujiyoshi heifers. Furthermore, both Tajiri steers and heifers had a significantly shorter RT than Kedaka and Fujiyoshi steers and heifers (P < 0.05). The SFT and YE were not significantly different between Tajiri, Kedaka, and Fujiyoshi progenies.
Table 6. Comparative analysis of carcass traits among Tajiri, Kedaka, and Fujiyoshi paternal lines.
4. Discussion
According to Nomura et al. (Citation1987), all JBK are paternally derived from sires from five prefectures (Hyogo, Tottori, Shimane, Okayama, and Hiroshima) in the Chugoku District, the western part of Honshu Island. Of the three major paternal lines, such as Tajiri, Kedaka, and Fujiyoshi, the Tajiri paternal line is traceable to ‘Tajiri’ kept in Hyogo Prefecture (Nomura et al., Citation1987). The Kedaka paternal line is traced back to ‘Kedaka’ kept in Tottori Prefecture (Nomura et al., Citation1987). ‘Dai-6-Fujiyoshi’ of Okayama Prefecture is the ancestor to the Fujiyoshi paternal line (Nomura et al., Citation1987). This line has been commonly referred to as the Itozakura paternal line since Dai-6-Fujiyoshi’s grandson, Dai-7-Itozakura, spawned in Shimane Prefecture and gained reputation. Komatsu et al. (Citation2018) classified JBK sires according to the paternal lines and comparatively analyzed their economically important traits based on these lines.
According to homepages written by JBK producers in Japan (Beef-lab.com, Citation2013) and the USA (Lone Mountain Cattle Company, Citation2024), JBK producers believe that the Tajiri paternal line, despite its small body size, can improve meat quality, particularly BMS; the Kedaka paternal line improves body size and LMA; and the Fujiyoshi paternal line improves body size, LMA, and meat quality. Similar descriptions were found when introducing JBK to scientific studies (Komatsu et al., Citation2018; Nomura et al., Citation2005). The data from this study suggest that Tajiri paternal line is unlikely to improve both BMS and CW. However, further Tajiri OR accumulation may negatively affect the CW. Moreover, further Tajiri OR accumulation may positively affect BMS, but the effect is less than that of the Kedaka and Fujiyoshi ORs. In contrast to the Tajiri paternal line, the data from this study suggest that the Kedaka and Fujiyoshi paternal lines improved both CW and BMS. Thus, further Kedaka OR accumulation may positively affect BMS and CW. Moreover, further Fujiyoshi OR accumulation may positively affect BMS.
The advantages of the OR are as follows: (1) individual OR calculation is easy as cattle pedigree information is readily available on the Internet, (2) OR calculation is free of charge, and (3) each individual OR is invariant throughout his or her lifetime. Currently, LIAJ provides a genomic prediction of the breeding values of sires using SNP chips (Onogi et al., Citation2014) and analyzes DNA samples requested by JBK producers for a fee. As analyzing the DNA of all breeding cows on general farms is economically difficult, I believe that breeders and feeders will use ORs when selecting AI semen and buying stock cattle on the calf market, respectively, although the breeders and feeders should decide the preferred traits in a sire and the fattening animal, respectively. In general terms, JBK breeders want sires that produce progeny with high CW and BMS, while JBK feeders want to produce cattle with excellent BMS and CW. This study suggests that sires with a perfect balance between Fujiyoshi and Kedaka ORs produce progeny with a high BMS and heavy CW. However, it is up to the breeders whether the OR proposed in this study can be adopted as a selection index and used in actual breeding.
Inbreeding depression is defined as a decrease in mean performance due to mating between relatives. Uchida et al. (Citation1995) reported that the linear regression coefficients for calf growth traits, such as birth weight, calf market weight, and daily gain-corrected weight at 300 days of age, against the Wright’s F of dams were significant and negative in JBK. This study reported for the first time that the coefficient of BMS of steers and heifers against sire F was significant and negative (although only −0.02413/%), while that of CW against sire F was not significant. Recently, Nishio et al. (Citation2023) have reported that inbreeding depression in reproductive traits such as age at first calving, calving difficulty, and gestation length may have occurred in JBK. Therefore, monitoring inbreeding coefficients is crucial to prevent further inbreeding depression in JBK, for not only meat-producing, but also reproductive traits.
In conclusion, a new terminology, OR, was proposed, and associations between the ORs of three paternal ancestors (Tajiri, Kedaka, and Fujiyoshi) and the carcass traits of the progeny of sire candidates subjected to the field progeny test were analyzed. I found that the Kedaka OR significantly positively affects BMS and CW and the Fujiyoshi OR significantly positively affects BMS. Moreover, the combination of Fujiyoshi and Kedaka ORs is crucial for sire breeding and the Fujiyoshi and Kedaka ORs should be optimally balanced if improvements in both BMS and CW are desired. I believe that these findings can be used to breed new JBK sires efficiently and effectively.
Authors’ contributions
HT designed the study, analyzed the data, wrote the manuscript, and approved the final manuscript.
Ethics approval and consent to participate
Animal care and use committee approval was not applied because the data of the field progeny test were obtained from the LIAJ website. To participate in the field progeny test, JBK cattle producers must first agree to comply with the Standards for the Care and Keeping of Industrial Animals (Notice of the Prime Minister’s Office No. 22 of 1987, Japan; https://www.env.go.jp/nature/dobutsu/aigo/2_data/laws/nt_h25_85_en.pdf). Therefore, after the JBK cattle producers who participated in the field progeny test agreed to comply with the standards, the cattle deposited by LIAJ were fattened on the participating farms with humane care and in accordance with the standards.
Acknowledgments
The author acknowledges the support and advice of Mr. Kunihiko Ogura, President of Lion Co. This work is not a part of the research activities of the National Agriculture and Food Research Organization (NARO, Japan), although the author is affiliated with it.
Disclosure statement
No potential conflict of interest was reported by the author(s).
Data availability statement
The data that support the findings of this study are available from the corresponding author, HT, upon reasonable request.
Additional information
Funding
Notes on contributors
Hideaki Takahashi
Hideaki Takahashi (HT) has published over 70 papers in international journals. He works on animal breeding, genetics, poultry science, and food science including meat and eggs.
References
- Agriculture & Livestock Industries Corporation. (2021). https://www.alic.go.jp/joho-c/joho05_002049.html (in Japanese).
- Beef-lab.com. (2013). BREED “Three major Japanese black bloodlines”. http://beef-lab.com/?p=417 (in Japanese).
- Caballero, A. (1994). Developments in the prediction of effective population size. Heredity, 73(Pt 6)(6), 1–12. https://doi.org/10.1038/hdy.1994.174
- Falconer, D. S. (1989). Introduction to quantitative genetics (3rd ed.). Longman.
- FAO. (2015). The second report on the state of the world’s animal genetic resources for food and agriculture. http://www.fao.org/3/a-i4787e.pdf
- Gotoh, T., Takahashi, H., Nishimura, T., Kuchida, K., & Mannen, H. (2014). Meat produced by Japanese Black cattle and Wagyu. Animal Frontiers, 4(4), 46–54. https://doi.org/10.2527/af.2014-0033
- Gyugle. http://gyugle.web.fc2.com/index.html (in Japanese).
- Inoue, K., Shoji, N., Honda, T., & Oyama, K. (2017). Genetic relationships between meat quality traits and fatty acid composition in Japanese black cattle. Animal Science Journal, 88(1), 11–18. https://doi.org/10.1111/asj.12613
- Japan Livestock Products Export Promotion Council Secretariat. (2020) Livestock Japan. http://jlec-pr.jp/en/beef/beef-miryoku/ (in Japanese).
- Japan Meat Grading Association. (2024). Trading standards for beef carcasses. http://www.jmga.or.jp/standard/beef/ (in Japanese).
- Japanese Society of Animal Science. (2018). Animal husbandry terminology. https://animalwiki.yokendo.com/index.php?curid=1&oldid=12554 (in Japanese).
- Komatsu, S., Nishino, K., Fujimori, Y., Haga, Y., Iwama, N., Arakawa, A., Aihara, Y., Takeda, H., & Takahashi, H. (2018). Epistatic effects between pairs of the growth hormone secretagogue receptor 1a, growth hormone, growth hormone receptor, non-SMC condensin I complex, subunit G and stearoyl-CoA desaturase genes on carcass, price-related and fatty acid composition traits in Japanese Black cattle. Animal Science Journal = Nihon Chikusan Gakkaiho, 89(2), 273–288. https://doi.org/10.1111/asj.12947
- Livestock Improvement Association of Japan. Results of the field progeny test. http://liaj.lin.gr.jp/index.php/detail/data/t/1194995257 (in Japanese).
- Lone Mountain Cattle Company. (2024). Genetic lines of Wagyu. https://www.lonemountaincattle.com/about-wagyu/genetic-lines-of-wagyu/
- Makanjuola, B. O., Maltecca, C., Miglior, F., Schenkel, F. S., & Baes, C. F. (2020). Effect of recent and ancient inbreeding on production and fertility traits in Canadian Holsteins. BMC Genomics, 21(1), 605. https://doi.org/10.1186/s12864-020-07031-w
- McGivney, B. A., Han, H., Corduff, L. R., Katz, L. M., Tozaki, T., MacHugh, D. E., & Hill, E. W. (2020). Genomic inbreeding trends, influential sire lines and selection in the global thoroughbred horse population. Scientific Reports, 10(1), 466. https://doi.org/10.1038/s41598-019-57389-5
- Ministry of Agriculture, Forestry and Fisheries. (2023). Livestock statistics. https://www.maff.go.jp/j/tokei/kekka_gaiyou/tiku_toukei/r5/ (in Japanese).
- Nakajima, T. (2009). Development of the inbreeding coefficient quick reference table “Kōhai-kun. A Major in Agricultural Technology–Livestock, 3, 24–33. (in Japanese).
- Nishio, M., Inoue, K., Ogawa, S., Ichinoseki, K., Arakawa, A., Fukuzawa, Y., Okamura, T., Kobayashi, E., Taniguchi, M., Oe, M., & Ishii, K. (2023). Comparing pedigree and genomic inbreeding coefficients, and inbreeding depression of reproductive traits in Japanese Black cattle. BMC Genomics, 24(1), 376. https://doi.org/10.1186/s12864-023-09480-5
- Nomura, T., Hayashi, H., & Sasaki, Y. (1987). The breeding structure and genetic analysis of the Japanese Black cattle in the Chugoku Districts. Japanese Journal of Zootechnical Science, 58, 21–27. (in Japanese).
- Nomura, T., Honda, T., & Mukai, F. (2001). Inbreeding and effective population size of Japanese Black cattle. Journal of Animal Science, 79(2), 366–370. https://doi.org/10.2527/2001.792366x
- Nomura, T., Honda, T., & Mukai, F. (2005). Monitoring and preservation of genetic diversity in livestock breed: A case study of the Japanese Black cattle population. Current Topics in Genetics, 1, 59–71.
- Onogi, A., Ogino, A., Komatsu, T., Shoji, N., Simizu, K., Kurogi, K., Yasumori, T., Togashi, K., & Iwata, H. (2014). Genomic prediction in Japanese Black cattle: Application of a single-step approach to beef cattle. Journal of Animal Science, 92(5), 1931–1938. https://doi.org/10.2527/jas.2014-7168
- Uchida, H., Ohhira, K., Yamagishi, T., Chiba, K., & Kuchita, K. (1995). The relationship between inbreeding coefficients of cows and their calves’ growth and price traits in Japanese Black cattle. Animal Science and Technology, 66, 55–61. (in Japanese).
- Usi-wiki. http://usicafe.jp/usi-wiki/?usi-wiki-Top (in Japanese).
- Wickham, B. W., & Banos, G. (1998). Impact of international evaluations on dairy cattle breeding. Proceedings of the 6th World Congress on Genetics Applied to Livestock Production, Armidale, Australia, 23, 315–322.
- Xu, L., Zhu, B., Wang, Z., Xu, L., Liu, Y., Chen, Y., Zhang, L., Gao, X., Gao, H., Zhang, S., Xu, L., & Li, J. (2019). Evaluation of linkage disequilibrium, effective population size and haplotype block structure in Chinese cattle. Animals, 9(3), 83. https://doi.org/10.3390/ani9030083