
 ?Mathematical formulae have been encoded as MathML and are displayed in this HTML version using MathJax in order to improve their display. Uncheck the box to turn MathJax off. This feature requires Javascript. Click on a formula to zoom.
Abstract
This study investigated the nutritional, antinutritional, functional, and antioxidant properties of six different soybean seed varieties collected from the Bako Agricultural Research Center (BARC), Ethiopia. The proximate composition of the soybean seed varieties varied significantly from one variety to another. The moisture content ranged from 8.44 to 9.66 g/100 g dry weight basis, crude protein ranged from 35.31 to 47.63 g/100 g, crude fat ranged from 17.53 to 23.75 g/100 g, crude fiber ranged from 5.85 to 11.43 g/100 g, crude ash ranged between 3.4 to 4.8 g/100 g, utilizable carbohydrate ranged from 4.16 to 27.19 g/100 g, and gross energy ranged from 409.82 Kcal/100g to 429.98 Kcal/100g. The minerals in mg/100 g of seeds of soybean varieties also had the following ranges: sodium 2.94 to 4.06, potassium 1062.04 to 1360.80, calcium 174.16 to 268.84, magnesium 153.30 to 204.54, iron 9.84 to 14.30, copper 1.16 to 1.93, zinc 3.24 to 4.61, and phosphorus 691.73 to 1124. In particular, Gute-19 soybean varieties contained significantly high amounts of crude protein, ash, crude fat, calcium, iron, and zinc. Principal component analysis showed nutritional variability and six independent clusters in varieties; this category was useful for preparing products such as soymilk. The antinutrient in mg/100 g of soybean varieties ranges as follows: phytate 198.53 (Keta) to 271.84 (Gute-19), oxalate 1580 to 2020, and tannin 134.93 to 191.62. The molar ratios of the soybean varieties in this study were below the critical/standard value, except for the phytate: Fe ratio. The soybean varieties had total phenol ranges from 1.19 to 2.02 mg GAE/g and total flavonoids from 0.25 to 0.81 mg CE/g. The IC50 values (mg/mL) of the soybean varieties were as follows: DPPH scavenging is 2.10-10.30. The antioxidant activity of all soybean varieties was high, with Gute-19 exhibiting the highest antioxidant activity. Hence, increasing the cultivation, promotion, and consumption of soybean in the country could help in new product development, in addition to soymilk and food supplementation, and mitigate food insecurity and alleviate malnutrition in the country.
REVIEWING EDITOR:
1. Introduction
Soybean (Glycine max L. Merrill) belongs to the Fabaceae family (Sileshi et al., Citation2020). It is native to Asia (Swallah et al., Citation2021) and is one of the oldest world crops; however, it is currently widely grown in both tropical and temperate regions of the world (Sileshi et al., Citation2020). The soybean (U.S.) or soya bean (UK) is a legume that is widely cultivated for its edible bean, which has a variety of uses. The Food and Agricultural Organization (FAO) classifies plants the oilseeds rather than pulse.
Currently, the main challenge that consumers face in their daily menu is the shortage of protein, which is due to the composition of nutrients in the staple food of society. Soy and soy foods are common nutritional solutions for vegetarians because of their high protein content and versatility in the production of meat analogs and milk substitutes. Soybeans have been used in different food applications in the recipes for some infant foods worldwide. Soy oil, soymilk, yuba, and tofu are popularly consumed soybean products for their health benefits and nutrition. Among cereals and other legume species, soybean (Glycine max) has the highest protein content (Qin et al., Citation2022).
The soymilk processing method and process conditions (soaking, de-hulling, germination/sprouting, and blanching) have a significant effect on the quality and acceptance of the produced soymilk. Soybean is an underutilized crop in Ethiopia due to its limited use in kollo (soaked and roasted), ‘nifro’ (boiled seeds), ‘wot’ (sauces made from powdered seeds), and other preparations without understanding the nutritional, antinutritional, antioxidant, and functional properties of different soybean varieties (Dida Bulbula & Urga, Citation2018). In all forms, it may be consumed alone or in combination with cereals (Dida Bulbula & Urga, Citation2018). In addition to traditional foods, it is also better to develop food products from soybeans. Ethiopia has made little effort to add value to the utilization of soybeans for different food applications (Abagoshu et al., Citation2017).
This has profoundly hampered the wider consumption of crops for different food applications, despite its high potential for food security. Moreover, soymilk processing in Ethiopia is uncommon despite the high production of soybeans.
2. Materials and methods
2.1. Materials
Soybean varieties namely (Korme, Bilo-19, Didheesa, Ethio Yugoslavia, Keta, and Gute-19) which are registered and released were collected from the Bako agricultural research center, Ethiopia grown under the same agronomic and management practices were harvested randomly from Bako Agricultural Research Center, Oromia Regional State, Ethiopia in the 2013 E.C harvesting seasons. Then, the soybeans of each variety were coded, packed in polyethylene bags (to prevent moisture loss), and transported to the research incubation center of Wallaga University, Ethiopia.
2.2. Sample preparation and soymilk production procedure
The soybean variety seeds were screened manually to remove some physical hazards and then divided into two categories (one for laboratory analysis and the second for soymilk preparation). The first category was milled separately into a fine powder using an electric grinder until it could pass through a 0.425 mm sieve size. Finally, the powder was packed into an airtight polyethylene plastic bag and stored in a desiccator until further analysis. The second group was kept for the subsequent soymilk preparation.
Soymilk preparation from sprouted soybeans was carried out using a soymilk machine (SC-20 Pristine Plants India Limited). Soybean seeds (1 kg) were thoroughly cleaned and made free from dust, dirt, stubble, and foreign matter. Damaged seeds with cracked hulls etc. are discarded, and the seeds were surface sterilized with 0.1% (w/v) potassium permanganate solution for 5 min, then they were rinsed with distilled water to remove any traces of potassium permanganate. The seeds were soaked in distilled water for 18 h at room temperature (RT). Then, the excess water was drained, the sample was further rinsed with distilled water, and seeds were placed in a single layer on filter paper on sterile plates and placed in a seed germinator at 25 °C, 90% RH for 72h as per the method of Agrahar-Murugkar & Jha (Citation2010). Sprouted soybeans with 67% moisture content were mixed with water in a ratio of 5:1 in the unit, and a pressure of 1 kg/cm2 (15Psi) was generated by infusing food-grade steam at a pressure of 1–3 kg/cm2 (15Psi to 54 psi) by using automatic electric boiler.
2.3. Analysis methods
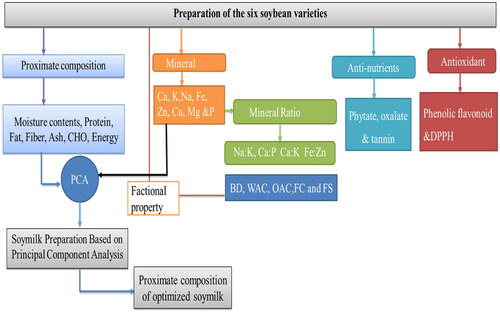
shows a schematic overview of the experimental program, depicting the major quality parameters, from the preparation of the sample to the analytical methods for the characterization of six different genotypes of raw soybean and soymilk.
Figure 1. Frameworks for raw soybean variety characterization.
2.4. Determination of proximate composition of soybean varieties
Proximate determinations of ash, carbohydrate, crude protein, crude fat, crude fiber, and moisture content of soybean followed the (AOAC 2000) method reported by Teshome et al. (Citation2022) method 925 with slight modifications were deemed appropriate. Ash determination was performed in a muffle furnace at 600 °C for 3 h, whereas crude protein determination employed Kjeldahl digestion with the protein content calculated by correction factor (% N*6.25). Crude fat determination was performed using the Soxhlet apparatus, which required approximately 16 h of extraction time, after which evaporation at 70 °C helped to remove the remaining solvent. Moisture Content was determined in an oven at 110 °C to a constant weight. The total carbohydrate (COH) content was calculated using the difference method. To establish the crude fiber, a fresh soybean sample (2 g) was subjected to diluted H2SO4, boiled (30 min), filtered, pre-heated with 150 mL KOH, drops of octanol were added, boiled for 30 min, and filtered. Using a cold extraction unit, acetone was used to wash the sample, which was then dried (130 °C for 1 h), followed by ashing in a furnace at 500 °C. The percentage of crude fiber was determined by weighing the resultant ash. Utilizable carbohydrate content was also calculated using the following difference i.e. 100 – (% crude protein + % crude fiber + % total ash %crude fat).
2.4.1. Determination of gross energy and mineral analysis
The gross energy content was determined by calculating the fat, carbohydrate, and protein content using Atwater’s conversion factors: 4 kcal/g for protein, 9 kcal/g for fat, and 4 kcal/g for carbohydrate (Aletor et al., Citation2002).
2.5. Determination of mineral contents
The mineral contents of soybeans, such as calcium, magnesium, iron, copper, zinc, potassium, and sodium, were determined using Microwave Plasma Atomic Emission Spectroscopy (MP-AES 4200) as reported by Gemede et al. (Citation2015). Six soybean samples were burned to ash for five hours at 550 degrees Celsius in a muffle furnace, then the ash was dissolved in 20% HCl, and boiled to turn it into a solution. After the digested material cooled, it was filtered into a 100 mL acid-washed volumetric flask, and the volume was adjusted with deionized and distilled water. The concentrations of these minerals were determined using calibration curves constructed using standard solutions for each mineral. An atomic absorption spectrophotometer (Shimadzu, model AA-6800) was used to assess the concentrations of calcium, magnesium, iron, and zinc, and flame photometry (Jenway model; pfp7, UK) was used to determine the sodium and potassium contents of the samples. Phosphorus was analyzed using a UV-VIS spectrophotometer (Evolution 220, Thermo Scientific, USA).
2.6. Principal component analysis
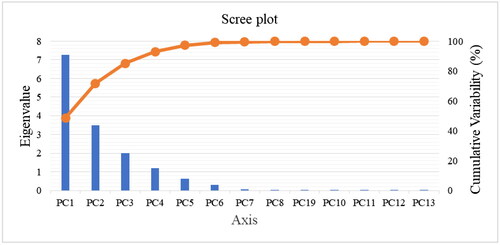
The principal component analysis is a technique used to determine the variables containing the maximum possible variance and to reduce the information of a multidimensional data set displayed in a scatter plot (As, 2011). The nutritional (proximate and mineral) variability of the six soybean varieties was explained by six principal components (PC1, PC2, PC3, PC4, PC 5, and PC 6) (), with eigenvalues higher than one, but only the first two (PC1 and PC2) contributed significantly to the total variability of the variety’s distribution.
Figure 2. Eigenvalue of each principal component of seeds of six soybean varieties in reverse screen plot.
2.6.1. Determination of antinutritional factors: phytate, tannin, and oxalate content
Phytate content was determined by the method described by Vaintraub & Lapteva (Citation1988). About 1.0 g samples were extracted with 10 mL of 2.4% HCl in a mechanical shaker (Eberbach) for 1 h at room temperature, followed by 30 min of centrifugation at 3000 rpm. One milliliter of Wade reagent (containing 0.03% solution of FeCl3.6H2O and 0.3% sulfosalicylic acid in water) was added to 3 mL of the sample solution (supernatant). The mixture was then vortexed for 5 s. The absorbance of the sample solutions was measured at 500 nm using a UV-VIS spectrophotometer (Beckman DU-64 spectrophotometer, USA). The sodium salt of phytic acid was used as a standard for construction of the calibration curve (Absorbance = -0.008 phytic acid mg + 0.4575, R2 = 0.994). The phytate was calculated from the difference between the absorbance of the blank (3 mL of 0.2 N HCl plus 2 mL of wade reagent) and that of the assayed samples. The amount of phytic acid was calculated using the phytic acid standard curve, and the result was expressed as phytic acid in μg/g fresh weight. Calculation of the phytic acid content
Where; W = Weight of sample, As = sample absorbance, Ab = blank absorbance.
The vanillin-HCl method described by Butler et al. (Citation1982) was used to determine the condensed tannin content. Following ten minutes of centrifugation at 3500 rpm, the extracted supernatant solutions (2.0 g of soybean sample were combined with 5 mL of the vanillin-HCl reagent. It was then kept in a water bath for 20 min at 300 °C, and the absorbance at 500 nm was read using a spectrophotometer. The oxalate content of soybean samples was determined using the procedure described by Gemede et al. (Citation2016)., which included three steps: digestion, oxalate precipitation, and permanganate titration.
2.6.2. Determination of the mineral ratios and molar ratio of antinutrients to minerals
The mineral ratio was calculated by dividing the first mineral level by the second mineral level (Jacob et al., Citation2015). The molar ratio of the antinutrients (phytate and oxalate) to minerals (Ca, Zn, and Fe) was predicted by dividing the number of antinutrient (phytate: 660 g/mol; oxalate: 88 g/mol) by the moles of minerals (Ca: 40 g/mol; Zn: 65 g/mol; Fe: 56 g/mol) (Gemede et al., Citation2016; Norhaizan & Nor Faizadatul Ain, Citation2009). The calculated molar ratios were compared with reported critical toxicity values.
2.6.3. Determination of antioxidants of soybean: Total phenolic and flavonoid content
Total Phenolic Compounds (TPCs) in soybean extracts were determined according to the method of Zielinski et al. (Citation2001) with minor modifications. A 0.25 mL of methanolic soybean extract was mixed with 4 mL of distilled water and 0.25 mL of Folin-Ciocalteu reagent, the mixture was Shaked for 30 s, saturated sodium bicarbonate (0.5 mL) was added, and the mixture was allowed to stand for 30 min in the dark. Absorbance was measured at 725 nm using distilled water as a blank. The results are expressed as gallic acid equivalents (mg of GAE per gram of sample) using the calibration curve of gallic acid (Sakthivelu et al., Citation2008).
The flavonoid content was determined by the aluminum trichloride method, using catechin as a reference compound (Zhishen et al., Citation1999). Total flavonoid concentration was measured using a colorimetric assay. Catechin standard solutions were prepared by dissolving catechin in water at concentrations ranging from 10 to 50 μg mL-1. Briefly, 1 mL of appropriately diluted aqueous catechin standard solutions or soybean samples was added to 4 mL of distilled water. At time zero, 0.3 mL of 5% (w/v) NaNO2 was added. 0.3 mL of 10% (w/v) AlCl3 was added 5 min later. At 6 min, 2 mL of 1 mol L-1 NaOH was added and the solution was made up to 10 mL with distilled water and mixed. The spectrum was scanned against a blank by using a spectrophotometer at 850–290 nm. The total flavonoid content was calculated from a calibration curve, and the result was expressed as mg catechin equivalents per mL of sample.
2.6.4. Water absorption capacity, oil absorption capacity, and foaming capacity
The water absorption capacity of soybean flour was determined using the method of Sosulski et al. (Citation1976). 1 g of each sample was measured and mixed with 10 mL of distilled water, vortexed for 1 min, and centrifuged at 3000 rpm for 45 min. WAC was expressed as the weight of water bound to the gram of dry flour. The oil absorption capacity was determined using the method of (Sosulski et al. (Citation1976). One gram of sample was mixed with 10 mL of soybean oil (Sp. Gravity: 0.9092) and allowed to stand at ambient temperature (30 ± 2 °C) for 30 min in preweighed centrifuge tubes. After holding for 30 min, the tube was centrifuged for 25 min at 4000 rpm. OAC was expressed as the weight of oil bound per weight of the sample on a dry basis. The foaming capacity and foaming stability were determined as described by Baljeet et al., with slight modifications. 1.5 g of the sample was homogenized with 50 mL distilled water at 10,000 rpm for 2–3 min using Ultra-Turrax. The suspension was mixed and shaken for 5 min to form foam. The volume of foam was recorded 30 min after whipping to determine foam stability as a percentage of the initial foam volume.
The water absorption, oil absorption, and foaming capacities are expressed as follows:
where Ws is the weight of the sample, W1 is the weight of the centrifuge tube plus the sample, W2 is the weight of the centrifuge tube plus the sediment, AW is the weight after whipping, and BW is the weight before whipping.
2.6.5. Data analysis method
The Minitab software package (version 18) (Minitab Ltd., Coventry CV3 2TE, United Kingdom) was used to perform the data analysis Principal component50 analysis (PCA) was performed using Minitab® software (Minitab Inc., State College, PA) version 17 and (XLSTAT trial version) to evaluate the existence of clusters grouping soybean varieties according to their nutritional (proximate and mineral compositions) PCA (principal component analysis using XLAST). The resultant data, from triplicate determinations given to the analysis of variance (ANOVA), are expressed as the mean ± standard deviation. Probability level of statistical significance was set at P < 0.05 (95% confidence).
3. Results and discussions
3.1. Proximate composition of the selected soybean varieties
The moisture content of soybean varieties ranged from the lowest moisture content of 8.44 g/100 g recorded in soybean varieties obtained from variety Bilo-19 with a significant difference (P < 0.05) and a higher value of 9.66 g/100 g obtained from variety Dhidheessa with significant difference (P < 0.05). The mean moisture contents of the six soybean varieties were 9.05 g/100 g. This finding is in agreement with the result reported by Karkle & Beleia (Citation2010) which was 9.89 g/100 g and slightly higher than (Chen et al., Citation2012) which was 8.54 g/100 g. The mean moisture content of the six different soybean varieties 9.05 g/100 g were also high, similar to the commonly consumed pulses in Ethiopia, such as chickpea and cowpea. If the moisture content is low, maintaining the quality of the food is good. To avoid microbial growth, the moisture content and water activity must be maintained below approximately 10% and 0.60–0.65, respectively, depending on the type of food. Fresh foods with high moisture content often have a water activity close to 0.99 and are particularly prone to microbial growth (Vera Zambrano et al., Citation2019). The low moisture content of the seeds observed in this study also confers good stability (maintaining quality) and high yield when the moisture content is decreased; the other components increase, thus enhancing the other nutritional components of soymilk.
The crude protein content of the six soybean varieties range from 35.31 g/100 g to 47.63 g/100 g (). The highest protein content (47.63 g/100 g) was reported from the six soybean varieties in Bilo-19, and the lowest value was recorded (35.31 g/100 g) in the variety of Ethio-Yugoslavia, which was observed to be significant (P < 0.05) in the mean protein content. The average protein content of the six soybean varieties was 37.10 g/100 g. Legumes are considered a major source of dietary proteins, ranging from 20 to 40 g/100 g of dry matter (FAO, Citation2021). The average protein content in the present study is in agreement with the results reported by Messina (Citation1999), Chen et al. (Citation2012), El-Shemy (Citation2012), and Uwem et al. (Citation2017). Soybean protein content (between 35–40%) is higher and more economical than that of beef (19%), chicken (20%), fish (18%), and groundnut (23%) (Carnovale et al., Citation1990). The high protein content of 47.63% of the sample suggests that it could be used in the management of protein deficiency cases, such as Kwashiorkor. This means that the sample could be used to improve the palatability of the foods in which they are incorporated.
Table 1. Proximate composition of six soybean varieties grown in Ethiopia in g/100g(dwb).
The crude fat contents of the six soybean varieties range from 17.53 to 23.75 g/100 g. The highest crude fat content was recorded in the soybean variety Gute-19 (23.75 g/100 g) and the lowest value was recorded in Korme (17.53 g/100 g). There was a significant interaction effect (P < 0.05) between the varieties. The crude fat content in the present study is in close agreement with the previous work of Murugkar (Citation2014) and Uwem et al. (Citation2017), who reported a crude fat content of soybeans within a range of 18.38 g/100 g 21.6 g/100 g. This result is in the same range as that reported by Szostak et al. (Citation2020). The average crude fat contents of the six soybean varieties were 21.10 g/100 g. The crude fat content was 20.23 g/100 g in the Amandine soybeans and 21.72 g/100 g in the seeds of the Merlin cultivar (Szostak et al., Citation2020). Dietary fats are used to increase the palatability of food by absorbing and retaining flavors I et al. (Citation2007) In this regard, the consumption of soybeans should be encouraged.
The crude fiber content of the six soybean varieties was in the range of 5.85 ± 0.00g/100 g (Korme) to 11.43 ± 0.00 g/100 g (Gute-19) () and the average crude fiber content was 8.16 g/100 g. This value is a little bit closer to the value of crude fiber content of soybean reported and Cited by Liu (Citation1994); Adelakun et al. (Citation2012); Uwem et al. (Citation2017) Nwosu et al. (Citation2019), and which was produced from other varieties of soybean. The crude fiber of the soybean genotypes ranged from 3.75% to 6.009%, according to the findings of Osman (Citation2004), but this value was relatively low compared to this finding, but it was similar to that of the study conducted by I et al. (Citation2007). The presence of fiber in food is known to be beneficial. Fibers have physiological effects on the gastrointestinal tract. These effects include variation in fecal water, fecal bulk, transit time, and elimination of bile acids and neutral steroids, which lower the body’s cholesterol pool.
The ash content, which represents the total mineral content of soybean samples in the present study ranged between 3.4 g/100 g (Gute-19) and 4.8 g/100 g (Keta) (). The mean crude ash content of the six soybean varieties was 4.18 g/100 g, Comparatively, the ash content recorded in the present study was lower than that reported by Uwem et al. (Citation2017) (Bayero et al., Citation2019). The ash content ranged from 3.34% to 5.02% for the genotypes under study is, indicating that the genotypes could be important sources of minerals (Nwosu et al., Citation2019). The low ash content recorded in the present study may be attributed to the loss of samples during the incineration step at high temperatures.
The utilizable carbohydrate content of the six soybean varieties ranged from the highest of 27.19 g/100 g which was recorded under the variety of Korme up to the lowest of 4.16 g/100 g which was recorded in the variety of Gute-19. The average utilizable carbohydrate content of the six soybean varieties was 19.50 g/100 g. The average utilizable carbohydrate content in this study was in the range calculated by Szostak et al. (Citation2020) (19.75 g/100 g). The high carbohydrate content of the genotypes suggests that they could be used in managing protein-energy malnutrition because there is enough carbohydrate to derive energy from to spare protein so that protein can be used for its primary function of building the body and repairing worn-out tissues rather than as a source of energy (Uwem et al., Citation2017).
The gross energy content of the six soybean varieties ranged from 409.82 Kcal/100g in Ethio-Yugoslavia to 429.98 Kcal/100g in Dhidheessa. While the rest four varieties scored Korme 413.09 Kcal/100g, Bilo-19 418.70 Kcal/100g, Gute-19 420.95 Kcal/100g, and Keta 426.95 Kcal/100g respectively. The mean gross energy of the six soybean varieties was 419.92 9 kcal/100 g, which is comparable to the findings of Longo et al. (Citation2004)(417.9 Kcal/100g).
3.2. Mineral composition of the selected soybean varieties
Minerals are vital for overall mental and physical well-being and are essential components of bones, teeth, tissues, muscles, blood, and nerve cells (Soetan et al., Citation2010). They also help in the maintenance of acid-base balance, response of nerves to physiological stimulation, and blood clotting (Hanif et al., Citation2006). The mineral compositions of the six soybean varieties are shown in on a dry-weight basis.
Table 2. Mineral contents of six newly registered and released soybean varieties cultivated and grown in Ethiopia in (mg/100g, dwb).
The sodium content of the six soybean varieties ranges from 2.94 mg/100 g in Gute-19 to 4.06 mg/100 g in Ethio-Yugoslavia. The rest four soybean varieties have the following sodium content 3.24 mg/100 g in Keta, 3.76 mg/100 g in Bilo-19, 3.98 mg/100 g in Dhidheessa, and 4.01 mg/100 g in Korme. The sodium content of the six soybean varieties is listed in . The mean sodium content of six soybean varieties was 3.67 mg/100 g, this value is a little higher than the study reported by K. I. Chen et al. (Citation2012) (2 mg/100 g), but not too far from the study revealed by Etiosa et al. (Citation2018) (3.0 mg/100 g). Sodium is needed in the body in small amounts to help maintain normal blood pressure and normal muscle and nerve function.
The highest potassium content is shown in varieties Bilo-19 1360.80 mg/100 g whereas the lowest potassium content is shown in varieties Dhidheessa 1062.04 mg/100 g, and the rest four varieties are Korme1084.16 mg/100 g, Keta1090.85 mg/100 g, Ethio Yugoslavia 1167.85 mg/100 g, Gute-19 1203.19 mg/100 g respectively. All six varieties were significantly different (P < 0.05). The mean K content of the six soybean varieties was 1161.48 mg/100 g. This value was lower than that reported for the two varieties of soybean, Aldana and Merlin by Biel et al.(2018) (2263 mg/100 g to 2048 mg/100 g, respectively). However, according to the study reported by El-Shemy (Citation2012) (1593 mg/100 g) is almost comparable. This value is slightly lower than that reported by Chen et al. (Citation2012) (1797 mg/100 g). According to the study reported by Massey et al. (Citation2001), the potassium is 2680 mg/100 g–3240 mg/100 g. This difference may have occurred because of genotype differences.
The calcium content of legume seeds, an important component of vegan diets, is low, and their availability is reduced by oxalate and, to a lesser extent, phytate (Biel et al.,2018). The calcium concentration of six soybean varieties ranged from 174.16 mg/100 g to 268.84 mg/100 g. From the six soybean varieties Bilo-19 (203.21 mg/100 g) and Gute-19 (219.49 mg/100 g) were significantly (P < 0.05) high in calcium content, whereas from the six soybean varieties the lowest was (111.11 mg/100 g) (). The result of all the six soybean varieties obtained in this study was between the calcium contents of the soybean variety reported by Eden & Rumambarsari (Citation2020). Magnesium is involved in making proteins and releasing energy, and helps to hold calcium in the enamel of teeth (Etiosa et al., Citation2018). The Mg contents of the six soybean varieties are listed in . The maximum value was obtained for variety Bilo-19 (204.54 mg/100 g), and the lowest value was obtained for variety Keta (153.30 mg/100 g). The average Mg content of the six soybean varieties was 181.02 mg/100 g. This value was slightly lower than that reported by Etiosa et al. (Citation2018) (258.24 mg/100 g). The rest varieties Dhidheessa (161.28 mg/100 g), Korme (168.42 mg/100 g), Gute-19 203.41 mg/100 g, and Ethio -Yugoslavia (194.88 mg/100 g) respectively.
Iron is used in the management of iron deficiency anemia because it is a vital part of red blood cells that carry and release oxygen (Etiosa et al., Citation2018). The highest value of iron content was shown in the variety of Keta (14.30 mg/100 g) and the lower value was recorded in the variety of Korme (9.84 mg/100 g) while the rest varieties Bilo-19(10.10 mg/100 g), Gute-19 (11.24 mg/100 g), Dhidheessa 11.72 mg/100 g, and Ethio-Yugoslavia 13.81 mg/100 g, those value was in the range of the study reported by (Sharma et al. (Citation2014); Etiosa et al. (Citation2018). The variety Dhidheessa was significantly (P < 0.05) associated with Keta, Korme, Bilo-19and Ethio-Yugoslavia.
Copper and nickel are considered micronutrients that are harmful only in excess, but in smaller amounts, they are necessary for proper organ function. The heavy metal content in the soybean seeds varied and was significantly dependent on the factors studied. Of the six soybean varieties, the highest value was recorded in Gute-19 at 1.93 mg/100 g and the lowest copper value was recorded in Dhidheessa at 1.16 mg/100 g. The result varieties score Keta 1.33 mg/100 g, Korme 1.37 mg/100 g, Ethio-Yugoslavia 1.48 mg/100 g, and Bilo-19 1.89 mg/100 g respectively. The mean copper content, varieties was 1.52 mg/100 g these values were higher than those reported by Chen et al. (Citation2012) and Biel et al.(2018) (0.45 mg/100 g).
The highest value of zinc was recorded at 4.61 mg/100 g in variety Gute-19 and the lowest value was 3.24 mg/100 g Dhidheessa, while the rest Korme 3.25 mg/100 g, Ethio-Yugoslavia 4.01 mg/100 g, Keta 4.36 mg/100 g, and Bilo-19 4.39 mg/100 g scores respectively. The mean zinc content of the six soybean varieties was 3.98 mg/100 g. This value is slightly smaller than that reported by Chen et al. (Citation2012) (4.9 mg/100 g). Zinc helps the immune system fight against invading bacteria and viruses. The body requires zinc to produce proteins and DNA, the genetic material in all cells, and also helps in wound healing and the breakdown of carbohydrates (Etiosa et al., Citation2018).
The higher value of phosphorus was recorded in variety Bilo-19 (1124 mg/100 g) and the lower value was recorded in variety Dhidheessa (691.73 mg/100 g), whereas the list soybean variety Korme, Keta, Ethio Yugoslavia, and Gute 19 was scored 769.51 mg/100 g,819.92 mg/100 g, 972.22 mg/100 g, 1049.72 mg/100 g respectively. All six varieties were significantly different (P < 0.05). The average phosphorus content of the six soybean varieties was 973.78 mg/100 g. These values were higher than those reported by El-Shemy (Citation2012) (570 mg/100 g) and lower than those reported by Chen et al. (Citation2012) (1797 mg/100 g).
3.2.1. Mineral ratios of six soybean varieties
The effectiveness of minerals in diets is influenced by mineral-to-mineral interactions, which may either enhance or reduce the absorption of certain micronutrients in the body (Sharma et al. Citation2014; Soetan et al., Citation2010). The mineral ratios of the six soybean varieties used in this study are listed in .
Table 3. Mineral ratios of six soybean varieties.
3.2.1.1. Sodium to potassium ratio
According to the data presented in , The sodium-potassium (Na: K) ratios of the six soybean varieties ranged from 0.001 to 0.004. The Na/K ratio plays an important role in the diet as it reduces high blood pressure and the risk of stroke in the body (Jacob et al., Citation2015). Ijarotimi et al. (Citation2013) also reported that an Na/K ratio of less than one is recommended for diets, particularly for hypertensive patients. According to Alinnor & Oze (Citation2011) and Perez & Chang (Citation2014), the Na/K ratio is also of great importance for the prevention of high blood pressure if the Na/K ratio of the food value is less than one. Lower sodium and higher potassium intakes help to reduce high blood pressure in hypertensive patients (Alinnor & Oze (Citation2011); Perez & Chang (Citation2014). Therefore, the observed Na/K molar ratio of the six soybean varieties in this investigation revealed that the consumption of these soybean meals would help prevent hypertension and might lower blood pressure, and may also be suitable for children who are at risk of high blood pressure.
3.2.1.2. Calcium to phosphorous ratio
The calcium–phosphorous (Ca:P) ratios of the six soybean varieties ranged from 0.181 to 0.280. The recommended Ca/P ratio is >0.5 (Jacob et al., Citation2015). Furthermore, food is considered good if the Ca/P ratio is >1 and poor if this ratio is <0.5 (Alinnor & Oze (Citation2011); (Keyata et al., Citation2020) also reported that the Ca/P ratio must be close to 1 for good Ca and P intestinal utilization. A higher calcium–phosphorous (Ca/P) level in food is required for favorable calcium absorption in the intestine for bone formation (Keyata et al., Citation2020). In line with this, all six soybean varieties of the studied plants showed low Ca:P ratios, which did not help calcium absorption, particularly in growing children who require a high intake of calcium and phosphorus for bone and teeth formation (Ijarotimi et al., Citation2013).
3.2.1.3. Calcium to potassium ratio
As shown in , the Ca: K ratio of the six soybean varieties ranged from 0.149 to 0.230. The Ca/K ratio is called the thyroid ratio because calcium and potassium play vital roles in regulating thyroid activity (Ojiezeh et al., Citation2016). A low Ca/K ratio indicates an increased thyroid expression. Because the Ca/K ratios of the six soybean varieties are low compared to the standard, the formulated diets prepared from soybeans are considered good for the thyroid. In line with this finding, the Ca: K ratios of the six soybean varieties were found to be within the recommended rate for healthy foods, which may help thyroid activity (Keyata et al., Citation2020).
3.2.1.4. Iron to zinc ratio
The Fe/Zn ratios of the soybean varieties ranged from 2.301 to 3.617 (). Iron did not impair zinc absorption up to an iron: zinc ratio of 2:1. A dose-dependent effect was observed up to a ratio of 5:1 to 10:1, and no further zinc inhibition occurred (Pérès et al., Citation2001). On the other side of these findings, one can understand (conclude) that the iron present in the six soybean varieties didn’t impair zinc absorption.
3.2.2. Antinutritional factors of six soybean varieties
Antinutritional factors are naturally occurring compounds in edible seeds. When ingested, they affect nutrient utilization in the human body, especially proteins, vitamins, and minerals, by binding to these compounds, thereby reducing their absorption in the gastrointestinal tract. The contents of antinutritional factors such as tannins, phytic acid, and oxalate (as antinutritional factors) were studied by Nikmaram et al. (Citation2017). The antinutritional factors such as tannins, phytic acid, and oxalate content (as antinutritional factors) of the six locally grown soybean varieties in this study are presented in .
Table 4. Antinutrient content of six different soybean varieties in (mg/100g dwb).
The phytate content of six different newly registered and released soybean varieties from the Bako agricultural research center ranges from 198.53 mg/100 g (Keta) to 271.84 mg/100 g (Gute-19). According to El-Shemy (Citation2012) report, the contents of phytic acid in soybean and fababean seeds without cortex were 342 and 102 mg 100 g-l, respectively, but they were lower in the whole soybean and fababean seeds (212 and 70 mg 100 g-l, respectively), whereas Korme (218.09 mg/100 g), Bilo 19 (230.07 mg/100 g), Ethio Yugoslavia (249.91 mg/100 g) and Dhidheessa (264.49 mg/100 g) scores the respective content of phytic acid. The Mean phytate content of the soybean variety was 238.82 mg/100 g but this value was less than that reported by Megat Rusydi & Azrina (Citation2012). The average phytate contents of the six soybean varieties were slightly higher than the maximum allowable phytate content (200 mg/100 g). Therefore, before consumption, there should be some treatment, such as soaking. The storage form of phosphorus in seeds has been implicated in the reduced absorption of minerals from cereals and legumes because of phytate-mineral-complex formation. Zinc bioavailability is inversely related to dietary phytate (Heaney et al., Citation1991).
Oxalate is an organic acid found in plants, but it can also be synthesized by your body. It binds minerals and has been linked to kidney stones and other health (Djanaguiraman et al., Citation2005). The oxalate content of the six different soybean varieties depicted in this study ranges from 1580 mg/100 g (Dhidheessa) to 2020 mg/100 g (Korme), as shown in . The remaining varieties scored, 1610 mg/100 g (Keta) 1660 mg/100 g, (Ethio Yugoslavia) 1870 mg/100 g, (Bilo- 19)1950 mg/100 g, and (Gute- 19), respectively. The average oxalate content of the six soybean varieties was 1781 mg/100 g. This result was comparable to that of a study conducted by Massey et al. (Citation2001), who found that the total oxalate concentration of 11 different soybean cultivars ranged from 670 to 3500 mg/100 g g dry weight. The present study concurs with Massey et al. (Citation2001); however, it differs significantly from the research published by Djanaguiraman et al. (Citation2005), who examined 116 cultivars of soybean seeds and found that the total insoluble and soluble oxalate concentrations varied from approximately 82 to 285 mg/100 g of dry seeds. This might be due to variations in the soil type, rainfall intensity, and geographic location.
In plants, tannins are involved in defense mechanisms against environmental attacks (Megat Rusydi & Azrina, Citation2012). The six soybean varieties range from Ethio-Yugoslavia (134.93 mg/100 g) to Dhidheessa (191.62 mg/100 g), whereas the other four varieties scored Keta (138.73 mg/100 g), Korme (158.31 mg/100 g), Gute- 19 (165.68 mg/100 g), and Bilo- 19 (147.67 mg/100 g) respectively. The average tannin content of the soybean varieties was 156.16 mg/100 g. According to the study reported by El-Shemy (Citation2012), the tannin content of whole seeds amounted to approximately 30 mg 100 g-l for soybean, but it was lower than that of the current study. The average condensed tannin content of the six soybean varieties was below the maximum allowable condensed tannin content of 60 mg/100 g.
3.3. Antioxidant contents of soybean
3.3.1. Phenolics, flavonoid contents, and DPPH radical scavenging activity of soybean varieties
The antioxidant properties, particularly the total phenolic and flavonoid contents of the six different soybean varieties, are presented in .
Table 5. Total phenolics and flavonoids content of the methanolic extract of six different soybean varieties.
The total phenolic content of the six different soybean varieties was expressed in milligrams of gallic acid equivalent per gram of extract (mg GAE/g) in comparison with a standard gallic acid graph (). It resulted in 1.19 mgGAE/g (Bilo-19) to 2.02 mgGAE/g (Dhidheessa), but the rest soybean variety was 1.45 mgGAE/g (Ethio-Yugoslavia), 1.46 mgGAE/g (Keta), 1.65 mg GAE/g Korme), and 1.74 mg GAE/g (Gute-19). The mean total phenolic content of the six different soybean varieties was 1.56 mg GAE/g. mg GAE/g), and the highest in cultivar according to Kumar et al. (Citation2009) that is (1.34 mgGAE/g), and also in agreement with the study by Mujić et al. (Citation2011) for five different cultivars the lowest in cultivar ‘Danica’ (0.87 mg GAE/g) and the highest in cultivar ‘os55-95’ (2.16 mg GAE/g). This finding was also in agreement with the study reported by Kumar et al. (Citation2010) for six yellow genotypes’ soybean seed coat color the total phenolic content ranged from (1.06-1.50 mg GAE/g). According to a study conducted by Josipovic et al. (Citation2016) on 33 advanced soybean breeding lines, the total Phenolic Content ranged from 2.330 to 3.227 mg GAE/g dry weight in 2010 and from 2.121 to 3.164 mg GAE/g dry weight in 2011.
This is slightly higher than the findings of this study. Similar values for TPC were observed according to Mujić et al. (Citation2011), in several Croatian soybean cultivars phenols were extracted using 80% methanol, and total phenolic content ranged from 0.87 to 2.16 mg GAE/g. Park et al. (Citation2008) suggested that genotype effects had a significant impact on the total phenolic content of soybeans and that the differences in TPC values may be partly due to the genotypic variability of soybeans. Klepacka et al. (Citation2011) also reported that phenolic compound content might be useful as a distinguishing factor for genotype identification. They also suggested that soybean cultivars with the highest content of total phenolic compounds had the lowest IC50 value because of the highest antioxidant activity.
The total flavonoid content in this study was determined as milligrams of catechin equivalent per gram of extract (mg CE/g) after comparison with a catechin standard graph (). The total flavonoid content of the six different genotypes of soybean ranged from 0.25 mg CE/g (Keta) to 0.81 mg CE/g (Gute-19) however the rest soybean genotypes scored 0.42 mg CE/g (Ethio-Yugoslavia),0.43 mg CE/g (Korme), 0.46 mg CE/g (Dhidheessa), and 0.47 (Bilo-19). The average total flavonoid content in the research was 0.48 mg CE/g. A similar value is depicted in the finding of Klepacka et al. (Citation2011), that total flavonoids in the seed extracts of the examined genotypes, of soybean, only reached between 0.32 to 0.61 (mg CE/g) dry plant material. Similarly, the six soybean genotypes were similar to the total flavonoid content of the 33 soybean genotypes investigated by Josipovic et al. (Citation2016), which varied from 0.433 to 0.659, and in 2011, from 0.428 to 0.580 mg/g of dry weight, expressed as catechin equivalents.
Table 7. Proximate analysis of Gute-19 Soymilk.
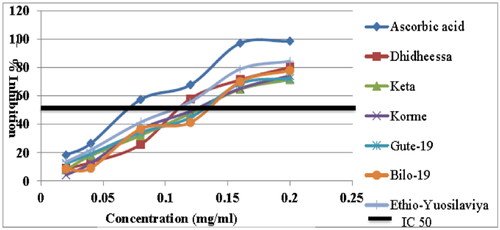
The ratio of flavonoids to phenolics was used to predict the number of flavonoids present. Flavonoid-to-phenolic ratios are shown in . The flavonoid to phenolic ratios of the raw soybean variety for Dhidheessa, Keta, Korme, Gute-19, Bilo-19, and Ethio-Yugoslavia were 0.22,0.17,0.25,0.50,0.40 and 0.29, respectively. The ratio of flavonoid to phenolic content of soybean seeds was significantly increased (P < 0.05). The concentration-response curves of the DPPH radical scavenging activity of the seeds of the six soybean varieties are shown in . In addition to the soybean seeds, the synthetic antioxidant l-ascorbic acid was used as a positive control at the same concentrations. The percentage inhibition of the DPPH radical scavenging activity of the six soybean varieties was evaluated at concentrations of 2–20 mg/mL. The present study revealed that there was an increase in DPPH radical scavenging activity with increasing concentrations of processed soybean extracts. The DPPH scavenging activities of the six soybean extracts were evaluated at different concentrations. The IC 50 also depicted which varieties were greater or less than the standard ascorbic acid (). Therefore, the highest percent of inhibition was for the variety Gute-19 ranging from 13.43–88.13 mg/mL whereas the lowest percent of inhibition was for the variety Keta ranging from 7.84-70.45 mg/mL.
Figure 3. DPPH scavenging activity of methanolic extract of soybean.
3.4. Functional properties
The bulk density, water and oil absorption capacity, foaming capacity, and Foam Stability of the six soybean powders are given in . The bulk density of the soybean powder varieties ranged from 1.55 to 2.09 g/cm3. The bulk density of the soybean varieties of powders of Gute-19 varieties was highest (2.09 g/cm3) but this was significantly (P < 0.05) different from the Korme variety, whereas Keta was the lowest (1.55 g/cm3) again this was significantly (P < 0.05) different from the rest of the varieties except Dhidheessa variety. The mean bulk density (1.79 g/cm3) of the soybean varieties of powders in this study was higher than that (0.721 g/cm3) reported by Milani et al. (Citation2000) for the other two soybean varieties. The bulk density in the present study was also higher than that (0.6735 g/cm3) reported by Kenghe et al. (Citation2013). In another study by Bencini (Citation1986), the bulk density of soybean varieties (cv. TAMS-38 and JS- 335) grown in India is 0.43 g/mL which is lower than the bulk density of all the soybean varieties used in the current study.
Table 6. Functional properties of six soybean varieties powders.
The water absorption capacity of soybean powders ranged from 2.53 3.89 mL/g. The water absorption capacity of Dhidheessa was the highest, but this was not significantly (P > 0.05) different from that of Keta soybean powders. It was low in Bilo-19. The mean water absorption capacity of the six soybean varieties of powders in this study was 3.10 mL/g higher than that reported by Sosulski et al. (Citation1976) for Soybean Flour (2.23 mL/g). Moreover, the mean value of the water absorption capacity of the six varieties of soybeans in the current study was lower than that reported by Bencini (Citation1986) which was 2.77 mL/g.
According to the experimental data presented in , the oil absorption capacity of soybean powders ranged from 2.05 to 2.78 mL/g. The oil absorption capacity of the soybean varieties of powders Ethio-Yugoslavia was the highest, but not significantly (P > 0.05) different from that of Gute-19. In contrast, the oil absorption capacity of Keta was the lowest, but this was not significantly (P > 0.05) different from that of Korme. The mean oil absorption capacity in this study was 2.43 mL/g, which was lower than that reported by Chen et al. (Citation2017). Oil absorption capacity is of great importance because fat acts as a flavor retainer and also increases the soft texture of the mouthfeel of foods, especially bread and other baked foods (Akinhanmi et al., Citation2008; Aremo & Olaofe, Citation2007). High oil absorption capacity is valuable for ground meat formulations, meat replacers and extenders, doughnuts, pancakes, and baked foods (Akinhanmi et al., Citation2008; Amandikwa & Chinyere, Citation2012). Therefore, Ethio-Yugoslavia, followed by Gute-19 varieties of soybean, has the highest oil absorption capacity and is selective for bakery food processing compared with the other four varieties.
The foaming capacities of soybean powders are presented in . The foaming capacity of the soybean varieties of powder ranged from 1.97% to 2.55%. Keta recorded the highest foaming capacity, and Bilo-19 the lowest, but there was a significant difference in the foaming capacity of all the soybean varieties of powders studied. The mean foaming capacity (2.25%) of soybean varieties of powders in the present study was lower than the value (2.5%) reported by Chen et al. (Citation2012) for the soybean cultivars. The foaming stability of the soybean varieties of powders also ranged from 0.23 to 1.03%. The foaming stability of Dhidheessa was significantly (P < 0.05) high and low in Gute-19, but this was significantly (P < 0.05) different from that of the other varieties. The ability to form stable foam is an important property of whipped toppings, frozen desserts, and sponge cakes (Adelakun et al., Citation2012). Foam stability is important because the usefulness of whipping agents depends on their ability to maintain the whip for as long as possible (Dobhal & Raghuvanshi, Citation2018).
3.5. Proximate composition of soymilk from selected varieties (Gute-19) of soybean
These findings provide information on the proximate, mineral, and antinutritional composition of the six soybean varieties. This property was used to select the best variety from the six varieties of soybeans grown in the Bako Agricultural Research Center farm, Ethiopia, to develop nutritious soymilk.
In this study, the variable-loading plot of the principal component analysis of the six soybean varieties revealed the existence of a wide range of proximate and mineral variability (Appendix 1) that could be selected by their traits desired for soymilk product development. From the results of the principal component analysis of the six soybean varieties presented in Appendices 2 and 3, the variety Gute-19 had a good nutritional profile with a high level of crude protein and crude fat, calcium, iron, and potassium. Analysis of proximate, mineral, antioxidant, and functional properties showed nutritional variability of six independent clusters in the soybean variety, which may be useful for the development of value-added soybean milk products. Hence, increasing the production and consumption of this nutrient-rich soybean variety (Gute-19) has helped in new product development and food supplementation and has alleviated malnutrition in the country. Therefore, in the current study, the Gute-19 soybean variety was selected for the development of soybean milk, depending on the nutritional variable/loading plot of the principal component analysis of the six soybean varieties. The proximate composition of soymilk products developed using different soaking times, germination times, and blanching temperatures from the Gute-19 soybean variety is presented in .
As shown in , the moisture content of soymilk was significantly different (P < 0.05) among the different treatments. The moisture content of the soymilk varied from 94.26% (T2) to 95.74% (T4). The results of the moisture content of T2 and T4 treatments of soymilk are similar to the values reported by Okpara et al. (Citation2021) (91% to 94.0%), but a little higher than the research depicted by Ugochi et al. (Citation2015); De et al. (Citation2022). The crude protein values ranged from 2.19 - 2.54 g/100 g wb and agreed with different studies on the protein contents of sprouted soybeans (Ikya, Citation2013; Jiang et al., Citation2013) and buckwheat for up to 72 h germination (Lee et al., Citation2015).
The crude fat and ash content of soybean milk from the Gute-19 variety ranged from 0.74 – 0.92 g/100 g wb and 0.32 – 0.60 g/100wb respectively. The crude fat content increased with the cooking temperature of the soybean slurry in the Illinois processing method. This result agreed with the study by Tunde-Akin & Souley (Citation2009) on crude fiber and crude ash content of soybean milk, ranging from 0.030 to 0.03692 g/100 g wb and 0.015 - 1.17 g/100 g wb, respectively. The results showed that there was a significant (P < 0.05) increase in protein and a significant (P < 0.05) decrease in fat content of germinated (sprouted) soybean soymilk samples compared to soymilk from unsprouted soybeans. This phenomenon allows for the release of oil and further increases the crude fat content of soymilk. The relationship between the high cooking temperature of soybeans and the value of crude fat content in this study is not in agreement with the value reported by Ikya (Citation2013), who stated that a high cooking temperature will reduce the value of crude fat content due to volatilization. However, this is not the case for the Illinois processing method investigated in the present study, as the cooking temperature may not be sufficient to cause volatilization.
4. Conclusions and recommendations
The present findings provide information on the proximate, mineral, and antinutritional composition of the six soybean varieties (Korme, Bilo-19, Didheesa, Ethio Yugoslavia, Keta, and Gute-19) and select the best variety from the six genotypes using their variable/loading plot of the principal component analysis of six soybean varieties for developing nutritious soymilk. The soybean variety was found to be a good source of crude protein, crude fat, calcium, iron, and potassium, which could contribute a useful amount to the human diet and are low in antinutrient content. In particular, the variety Gute-19 has a good nutritional profile with a high level of crude protein and crude fat, calcium, iron, potassium, and is a significant source of natural antioxidants that could probably be used as functional food ingredients for the development of soymilk. Hence, increasing the production and consumption of this nutrient-rich soybean variety will help in new product development, in addition to soymilk and food supplementation, and alleviate malnutrition in the country.
Authors’ contributions
KGZ involved in the conception and design, analysis and interpretation of the data; the drafting of the paper. HFG involved in the conception and design, analysis and interpretation of the data; the final write up of the paper.
Acknowledgments
I would like to thank Wollega University, Addis Ababa University, Kolfe Industrial College, Addis Ababa, and Bako Agricultural Research Center (BARC) for their help in laboratory facilities.
Disclosure statement
The authors declare there are no conflicts of interest.
Data availability statement
The data have been given in manuscript. If any other details are needed, the data that support the findings of this study are available from the corresponding author upon reasonable request.
Additional information
Funding
Notes on contributors
Habtamu Fekadu Gemede
Habtamu Fekadu Gemede is currently working as Associate Professor of Food and Nutritional Science at Department of Food Technology and Process Engineering, Wollega University. He did his BSc degree at Haramaya University (Ethiopia), his MSc and PhD degrees at Addis Ababa University. Dr. Habtamu Fekadu Gemede has published 42 articles on international reputable journals. He has more than 14 years experience of research and teaching, and has supervised 29 MSc and one PhD students. Among those, 25 MSc students under his supervision have successfully defended their theses. Furthermore, he is an editorial board member of eleven international repeatable journals. His research interest is areas of nutritional science, food science, food compositional analysis, food chemistry, Nutritional assessment, Antioxidant analysis etc.
References
- Abagoshu, N. A., Ibrahim, A. M., Teka, T. A., & Mekonnen, T. B. (2017). Effect of soybean varieties and processing methods on nutritional and sensory properties of soymilk. Journal of Food Processing and Preservation, 41(4), e13014. https://doi.org/10.1111/jfpp.13014
- Adelakun, O. E., Ade-Omowaye, B. I. O., Adeyemi, I. A., & Van de Venter, M. (2012). Mineral composition and the functional attributes of Nigerian okra seed (Abelmoschus esculentus Moench) flour. Food Research International, 47(2), 348–352. https://doi.org/10.1016/j.foodres.2011.08.003
- Agrahar-Murugkar, D., & Jha, K. (2010). Effect of drying on nutritional and functional quality and electrophoretic pattern of soyflour from sprouted soybean (Glycine max). Journal of Food Science and Technology, 47(5), 482–487. https://doi.org/10.1007/s13197-010-0082-5
- Akinhanmi, T. F., Atasie, V. N., & Akintokun, P. O. (2008). Chemical composition and physicochemical properties of cashew nut (Anacardium occidentale) oil and cashew nut shell liquid. Journal of Agricultural, Food, and Environmental Sciences, 2(1), 1–10.
- Aletor, O., Oshodi, A. A., & Ipinmoroti, K. (2002). Chemical composition of common leafy vegetables and functional properties of their leaf protein concentrates. Food Chemistry, 78(1), 63–68. https://doi.org/10.1016/S0308-8146(01)00376-4
- Alinnor, I. J., & Oze, R. (2011). Chemical evaluation of the nutritive value of Pentaclethra macrophylla Benth (African oil bean) seeds. Pakistan Journal of Nutrition, 10(4), 355–359. https://doi.org/10.3923/pjn.2011.355.359
- Amandikwa, C., & Chinyere, E. (2012). Proximate and functional properties of open air, solar, and oven-dried cocoyam flour. International Journal of Agriculture and Rural Development, 15(2), 988–994.
- Aremo, M. O., & Olaofe, O. (2007). Functional properties of some Nigerian varieties of legume seed flours and flour concentration effect on foaming and gelation properties.
- Bayero, A. S., Datti, Y., Abdulhadi, M., Yahya, A. T., Salihu, I., Lado, U. A., Nura, T., & Imrana, B. (2019). Proximate composition and the mineral contents of soya beans (Glycine max) available in Kano State, Nigeria. Chemsearch Journal, 10(2), 62–65.
- Bencini, M. C. (1986). Functional properties of drum‐dried chickpea (Cicer arietinum L.) flours. Journal of Food Science, 51(6), 1518–1521. https://doi.org/10.1111/j.1365-2621.1986.tb13849.x
- Butler, L. G., Price, M. L., & Brotherton, J. E. (1982). Vanillin assay for proanthocyanidins (condensed tannins): modification of the solvent for estimation of the degree of polymerization. Journal of Agricultural and Food Chemistry, 30(6), 1087–1089. https://doi.org/10.1021/jf00114a020
- Carnovale, E., Marletta, L., Marconi, E., & Brosio, E. (1990). Nutritional and hydration properties in cowpea. Cowpea Genetic Resources, 8, 26–37.
- Chen, K. I., Erh, M. H., Su, N. W., Liu, W. H., Chou, C. C., & Cheng, K. C. (2012). Soyfoods and soybean products: From traditional use to modern applications. Applied Microbiology and Biotechnology, 96(1), 9–22. https://doi.org/10.1007/s00253-012-4330-7
- Chen, Z., Wang, J., Liu, W., & Chen, H. (2017). Physicochemical characterization, antioxidant and anticancer activities of proteins from four legume species. Journal of Food Science and Technology, 54(4), 964–972. https://doi.org/10.1007/s13197-016-2390-x
- De, B., Shrivastav, A., Das, T., & Goswami, T. K. (2022). Physicochemical and nutritional assessment of soy milk and soymilk products and comparative evaluation of their effects on blood glycolipid profile. Applied Food Research, 2(2), 100146. https://doi.org/10.1016/j.afres.2022.100146
- Dida Bulbula, D., & Urga, K. (2018). Study on the effect of traditional processing methods on nutritional composition and antinutritional factors in chickpeas (Cicer arietinum). Cogent Food & Agriculture, 4(1), 1422370. https://doi.org/10.1080/23311932.2017.1422370
- Djanaguiraman, M., Devi, D. D., Shanker, A. K., Sheeba, J. A., & Bangarusamy, U. (2005). Selenium–an antioxidative protectant in soybean during senescence. Plant and Soil, 272(1-2), 77–86. https://doi.org/10.1007/s11104-004-4039-1
- Dobhal, N., & Raghuvanshi, R. S. (2018). Physical characteristics and effect of germination on functional properties of black soybean (Glycine max). Asian Journal of Dairy and Food Research, 37(00), 56–60. https://doi.org/10.18805/ajdfr.DR-1320
- Eden, W. T., & Rumambarsari, C. O. (2020). Proximate analysis of soybean and red bean cookies according to the Indonesian National Standard. Journal of Physics: Conference Series, 1567(2), 022033. https://doi.org/10.1088/1742-6596/1567/2/022033
- El-Shemy, E. H. A. (2012). Soybean and Nutrition. In Soybean and Nutrition. https://doi.org/10.5772/1008
- Etiosa, O., Chika, N., & Benedicta, A. (2018). Mineral and proximate composition of soya bean. Asian Journal of Physical and Chemical Sciences, 4(3), 1–6. https://doi.org/10.9734/AJOPACS/2017/38530
- FAO. (2021). Nutritional benefits of pulses. FAO publications catalogue 2021. 1.
- Gemede, H. F., Haki, G. D., Beyene, F., Woldegiorgis, A. Z., & Rakshit, S. K. (2016). Proximate, mineral, and antinutrient compositions of indigenous Okra (Abelmoschus esculentus) pod accessions: implications for mineral bioavailability. Food Science & Nutrition, 4(2), 223–233. https://doi.org/10.1002/fsn3.282
- Gemede, H. F., Ratta, N., Haki, G. D., Woldegiorgis, A. Z., & Beyene, F. (2015). Nutritional quality and health benefits of okra (Abelmoschus esculentus): A review. Journal of Food Processing & Technology, 06(06), 2. https://doi.org/10.4172/2157-7110.1000458
- Hanif, R., Iqbal, Z., Iqbal, M., Hanif, S., & Rasheed, M. (2006). Use of vegetables as nutritional food: role in human health. Journal of Agricultural and Biological Science, 1(1), 18–22.
- Heaney, R. P., Weaver, C. M., & Fitzsimmons, M. L. (1991). Soybean phytate content: effect on calcium absorption. The American Journal of Clinical Nutrition, 53(3), 745–747. https://doi.org/10.1093/ajcn/53.3.745
- I, E., N, A., Chinyere, G. C., Ugbogu, A. E., Akubugwo, & Obasi. (2007). Nutritional and chemical value of Amaranthus hybridus L. leaves from Afikpo, Nigeria. African Journal of Biotechnology, 6(24), 2833–2839. https://doi.org/10.5897/AJB2007.000-2452
- Ijarotimi, O. S., Adeoti, O. A., & Ariyo, O. (2013). Comparative study on nutrient composition, phytochemical, and functional characteristics of raw, germinated, and fermented Moringa oleifera seed flour. Food Science & Nutrition, 1(6), 452–463. https://doi.org/10.1002/fsn3.70
- Ikya, I. (2013). Proximate composition, nutritive and sensory properties of fermented maize, and full-fat soy flour blend for “agidiâ€production. African Journal of Food Science, 7(12), 446–450. https://doi.org/10.5897/AJFS09.224
- Jacob, A. G., Etong, D. I., & Tijjani, A. (2015). Proximate, mineral, and antinutritional compositions of melon (Citrullus lanatus) seeds. British Journal of Research, 2(5), 142–151.
- Jaroszewska, A., Jaroszewska, A., Biel, W., Hury, G., & Gawęda, D. (2018). The content of minerals in soybean seeds is influenced by farming system, variety, and row spacing. Journal of Elementology, 23(3), 98. https://doi.org/10.5601/jelem.2017.22.3.1483
- Jiang, S., Cai, W., & Xu, B. (2013). Food quality improvement of soy milk made from short-time germinated soybeans. Foods (Basel, Switzerland), 2(2), 198–212. https://doi.org/10.3390/foods2020198
- Josipovic, A., Sudar, R., Sudaric, A., Jurkovic, V., Matosa Kocar, M., & Markulj Kulundzic, A. (2016). Total phenolic and total flavonoid content variability of soybean genotypes in eastern Croatia. Croatian Journal of Food Science and Technology, 8(2), 60–65. https://doi.org/10.17508/CJFST.2016.8.2.04
- Karkle, E. N. L., & Beleia, A. (2010). Effect of soaking and cooking on phytate concentration, minerals, and texture of food-type soybeans. Ciência e Tecnologia de Alimentos, 30(4), 1056–1060. https://doi.org/10.1590/S0101-20612010000400034
- Kenghe, R. N., Nimkar, P. M., & Shirkole, S. S. (2013). Moisture-dependent physical properties of lathyrus. Journal of Food Science and Technology, 50(5), 856–867. https://doi.org/10.1007/s13197-011-0428-7
- Keyata, E. O., Tola, Y. B., Bultosa, G., & Forsido, S. F. (2020). Proximate, mineral, and antinutrient compositions of underutilized plants of Ethiopia: Figl (Raphanus sativus L.), Girgir (Eruca sativa L) and Karkade (Hibiscus sabdariffa): Implications for in-vitro mineral bioavailability. Food Research International (Ottawa, Ont.), 137, 109724. https://doi.org/10.1016/j.foodres.2020.109724
- Klepacka, J., Gujska, E., & Michalak, J. (2011). Phenolic compounds as cultivar and variety-distinguishing factors in some plant products. Plant Foods for Human Nutrition (Dordrecht, Netherlands), 66(1), 64–69. https://doi.org/10.1007/s11130-010-0205-1
- Kumar, V., Rani, A., Dixit, A. K., Bhatnagar, D., & Chauhan, G. S. (2009). Relative changes in tocopherols, isoflavones, total phenolic content, and antioxidative activity in soybean seeds at different reproductive stages. Journal of Agricultural and Food Chemistry, 57(7), 2705–2710. https://doi.org/10.1021/jf803122a
- Kumar, V., Rani, A., Dixit, A. K., Pratap, D., & Bhatnagar, D. (2010). A comparative assessment of total phenolic content, ferric reducing-anti-oxidative power, free radical-scavenging activity, vitamin C, and isoflavones content in soybean with varying seed coat color. Food Research International, 43(1), 323–328. https://doi.org/10.1016/j.foodres.2009.10.019
- Lee, M., Hong, G.-E., Zhang, H., Yang, C.-Y., Han, K.-H., Mandal, P. K., & Lee, C.-H. (2015). Production of the isoflavone aglycone and antioxidant activities in black soymilk using fermentation with Streptococcus thermophilus S10. Food Science and Biotechnology, 24(2), 537–544. https://doi.org/10.1007/s10068-015-0070-7
- Liu, K. (1994). Chemistry and Nutritional Value of. Chapman & Hall.
- Longo, F. A., Menten, J. F. M., Pedroso, A. A., Figueiredo, A. N., Racanicci, A. M. C., Gaiotto, J. B., & Sorbara, J. O. B. (2004). Determination of the energetic value of corn, soybean meal, and micronized full-fat soybean for newly hatched chicks. Revista Brasileira de Ciência Avícola, 6(3), 147–151. https://doi.org/10.1590/S1516-635X2004000300003
- Massey, L. K., Palmer, R. G., & Horner, H. T. (2001). Oxalate content of soybean seeds (Glycine max: Leguminosae), soyfoods, and other edible legumes. Journal of Agricultural and Food Chemistry, 49(9), 4262–4266. https://doi.org/10.1021/jf010484y
- Megat Rusydi, M. R., & Azrina, d A. (2012). Effect of germination on total phenolic, tannin, and phytic acid contents in soybean and peanut. International Food Research Journal, 19(2), 56–78.
- Messina, M. J. (1999). Legumes and soybeans: Overview of their nutritional profiles and health effects. The American Journal of Clinical Nutrition, 70(3 SUPPL), 439S–450S. https://doi.org/10.1093/ajcn/70.3.439s
- Milani, A. P., Bucklin, R. A., Teixeira, A. A., & Kebeli, H. V. (2000). Soybean compressibility and bulk density. Transactions of the ASAE, 43(6), 1789–1793. https://api.semanticscholar.org/CorpusID:94182123 https://doi.org/10.13031/2013.3082
- Mujić, I., Šertović, E., Jokić, S., Sarić, Z., Alibabić, V., Vidović, S., & Živković, J. (2011). Isoflavone content and antioxidant properties of soybean seeds. Croatian Journal of Food Science and Technology, 3(1), 16–20.
- Murugkar, D. A. (2014). Effect of sprouting of soybean on the chemical composition and quality of soymilk and tofu. Journal of Food Science and Technology, 51(5), 915–921. https://doi.org/10.1007/s13197-011-0576-9
- Nikmaram, N., Leong, S. Y., Koubaa, M., Zhu, Z., Barba, F. J., Greiner, R., Oey, I., & Roohinejad, S. (2017). Effect of extrusion on the antinutritional factors of food products: An overview. Food Control, 79, 62–73. https://doi.org/10.1016/j.foodcont.2017.03.027
- Norhaizan, M. E., & Nor Faizadatul Ain, A. W. (2009). Determination of phytate, iron, zinc, calcium contents, and their molar ratios in commonly consumed raw and prepared food in Malaysia. Malaysian Journal of Nutrition, 15(2), 213–222.
- Nwosu, D. J., Olubiyi, M. R., Aladele, S. E., Apuyor, B., Okere, A. U., Lawal, A. I., Afolayan, G., Ojo, A. O., Nwadike, C., Lee, M.-C., & Nwosu, E. C. (2019). Proximate and mineral composition of selected soybean genotypes in Nigeria. Journal of Plant Development, 26, 67–76. https://doi.org/10.33628/jpd.2019.26.1.67
- Ojiezeh, T. I., Adarabioyo, M. I., & Olagbemide, P. T. (2016). Phytochemical compositions of some extracts used in alternative medicine in Nigeria. Adv Applied Sci Res, 7, 1–6.
- Okpara, M. U., Madu, P. C., Shuaibu, B. S., Ubana, M. A., & Isah, J. (2021). Investigating the mineral composition of processed cheese, soy, and nunu kinds of milk consumed in Abuja and Keffi metropolises of Nigeria. https://api.semanticscholar.org/CorpusID:237393056
- Osman, M. A. (2004). Changes in sorghum enzyme inhibitors, phytic acid, tannins, and in vitro protein digestibility occurring during Khamir (local bread) fermentation. Food Chemistry, 88(1), 129–134. https://doi.org/10.1016/j.foodchem.2003.12.038
- Park, Y.-K., Kim, S.-H., Choi, S.-H., Han, J.-G., & Chung, H.-G. (2008). Changes in antioxidant capacity, total phenolics, and vitamin C contents during Rubus coreanus fruit ripening. Food Science and Biotechnology, 17(2), 251–256.
- Pérès, J.-M., Bureau, F., Neuville, D., Arhan, P., & Bouglé, D. (2001). Inhibition of zinc absorption by iron depends on their ratio. Journal of Trace Elements in Medicine and Biology: organ of the Society for Minerals and Trace Elements (GMS), 15(4), 237–241. https://doi.org/10.1016/S0946-672X(01)80039-0
- Perez, V., & Chang, E. T. (2014). Sodium-to-potassium ratio and blood pressure, hypertension, and related factors. Advances in Nutrition (Bethesda, Md.), 5(6), 712–741. https://doi.org/10.3945/an.114.006783
- Qin, P., Wang, T., & Luo, Y. (2022). A review on plant-based proteins from soybean: Health benefits and soy product development. Journal of Agriculture and Food Research, 7, 100265. https://doi.org/10.1016/j.jafr.2021.100265
- Sakthivelu, G., Akitha Devi, M. K., Giridhar, P., Rajasekaran, T., Ravishankar, G. A., Nikolova, M. T., Angelov, G. B., Todorova, R. M., & Kosturkova, G. P. (2008). Isoflavone composition, phenol content, and antioxidant activity of soybean seeds from India and Bulgaria. Journal of Agricultural and Food Chemistry, 56(6), 2090–2095. https://doi.org/10.1021/jf072939a
- Sharma, D., Gupta, R., & Joshi, I. (2014). Nutrient analysis of raw and processed soybean and development of value-added soybean noodles. Inventi Rapid: Life Style, 1, 1–5.
- Sileshi, Y., Yirga, M., Atero, B., & Box, P. O. (2020). Performance of released soybean varieties at Jimma, South Western Ethiopia. Journal of Biology, Agriculture and Healthcare, 10(4), 12–15. https://doi.org/10.7176/JBAH/10-4-02
- Soetan, K. O., Olaiya, C. O., & Oyewole, O. E. (2010). The importance of mineral elements for humans, domestic animals, and plants: A review. African Journal of Food Science, 4(5), 200–222.
- Sosulski, F., Humbert, E. S., Bui, K., & Jones, J. D. (1976). Functional properties of rapeseed flours, concentrates, and isolate. Journal of Food Science, 41(6), 1349–1352. https://doi.org/10.1111/j.1365-2621.1976.tb01168.x
- Swallah, M. S., Fan, H., Wang, S., Yu, H., & Piao, C. (2021). Prebiotic impacts of soybean residue (okara) on eubiosis/dysbiosis condition of the gut and the possible effects on liver and kidney functions. Molecules (Basel, Switzerland), 26(2), 326. https://doi.org/10.3390/molecules26020326
- Szostak, B., Glowacka, A., Kasiczak, A., Kieltyka-Dadasiewicz, A., & Bakowski, M. (2020). The nutritional value of soybeans and the yield of protein and fat depend on the cultivar and nitrogen application. Journal of Elementology, 25(1), 45–57.
- Teshome, A., Admassu, H., & Mohammed, F. (2022). Evaluation of selected locally grown sweet potato (Ipomoea batatas) varietal suitability on fried chips quality. Journal of Culinary Science & Technology, 22(4), 744–758. https://doi.org/10.1080/15428052.2022.2077876
- Tunde-Akin, T. Y., & Souley, A. (2009). Effect of processing methods on the quality of soymilk. Pakistan Journal of Nutrition, 8(8), 1156–1158. https://doi.org/10.3923/pjn.2009.1156.1158
- Ugochi, N. F., Chukwuma, U. M., Nwanneoma, O. J. N., Jummai, K., & Nwabugo, M. A. (2015). Nutrient and sensory quality of soymilk produced from different improved varieties of soybean. Pakistan Journal of Nutrition, 14(12), 898–906. https://doi.org/10.3923/pjn.2015.898.906
- Uwem, U. M., Uzama, D., & Perpetua, O. T. (2017). Physico-chemical characterization and comparative studies of some heavy metals using activated carbon from date palm seed. Advances in Applied Science, 2(4), 54.
- Vaintraub, I. A., & Lapteva, N. A. (1988). Colorimetric determination of phytate in unpurified extracts of seeds and the products of their processing. Analytical Biochemistry, 175(1), 227–230. https://doi.org/10.1016/0003-2697(88)90382-x
- Vera Zambrano, M., Dutta, B., Mercer, D. G., MacLean, H. L., & Touchie, M. F. (2019). Assessment of moisture content measurement methods of dried food products in small-scale operations in developing countries: A review. Trends in Food Science & Technology, 88, 484–496. https://doi.org/10.1016/j.tifs.2019.04.006
- Zhishen, J., Mengcheng, T., & Jianming, W. (1999). The determination of flavonoid contents in mulberry and their scavenging effects on superoxide radicals. Food Chemistry, 64(4), 555–559. https://doi.org/10.1016/S0308-8146(98)00102-2
- Zielinski, H., Kozlowska, H., & Lewczuk, B. (2001). Bioactive compounds in the cereal grains before and after hydrothermal processing. Innovative Food Science & Emerging Technologies, 2(3), 159–169. https://doi.org/10.1016/S1466-8564(01)00040-6
Appendixes
Appendix 1. Eigenvalue of each principal component of the six soybean seed varieties in the reverse screen plot
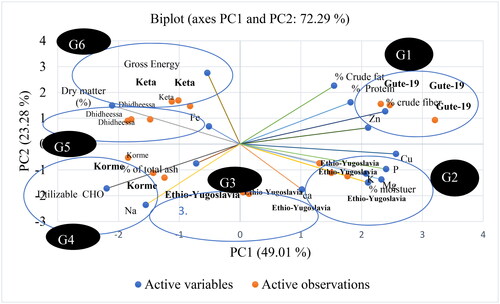
Where: G1 means Group One, G2 Group Two, G3 Group Three, G4 Group Four, G5 Group Five and G6 Group Six.
Appendix 2. Variable-loading plot of principal component analysis for proximate and mineral analyses of six soybean varieties
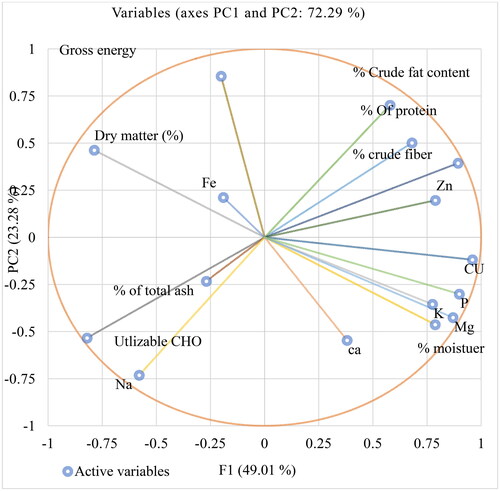
Notes: - CHO: utilizable energy; Energy: Gross energy; P: Phosphorus; K: Potassium; Na: Sodium; Zn: Zinc; Ca: Calcium; Fe: Iron.
Appendix 3. Squared cosines of the variables.