?Mathematical formulae have been encoded as MathML and are displayed in this HTML version using MathJax in order to improve their display. Uncheck the box to turn MathJax off. This feature requires Javascript. Click on a formula to zoom.
Abstract
A field experiment was carried out at Melkassa Agricultural Research Center from 2015 to 2017 to determine the seasonal fluctuation of onion thrips on onion in three consecutive growing seasons. Onion was planted on 10 x 10 m measuring plots and replicated three times. Thrips was counted on fifteen randomly selected plants from the central row of each plot. The thrips population was significantly different in different growth stages of onion. During the bulb enlargement stage, the number of thrips/plant was significantly higher than in the early growth stage, but insignificant differences between bulb enlargement stage and maturation growth stages in both years. Thrips population was significantly varied between the dry and rainy season, with much higher populations in the mid-vegetative growth stage than early growth stages in all seasons. The highest thrips populations were recorded in the dry hot and dry cool seasons, while lower numbers were counted in the rainy season where the highest rainfall recorded season in both years. The population of onion thrips was significantly positively correlated with maximum temperature, while a significantly negatively correlated with rainfall and relative humidity. The population of thrips was not correlated with minimum temperature and wind speed. Future research on the management onion of thrips should consider the growth stage and production season of onions for sustainable integrated thrips management program
IMPACT STATEMENT
Onion is an important vegetable crop produced for home consumption and as income sources for many small-scale farmers and commercial growers in Ethiopia. Onion is cultivated in a wide range of climatic conditions and forms an important component of diets in Ethiopia. However, the yield of the crop is not as high as the crop potential due to high infestation of thrips in the dry season.
1. Introduction
Onion Allium cepa L. is the most widely grown vegetable crop by small and large-scale farmers in Ethiopia covering an area of 36,373.48 ha with the total production of 273,858.98 ton (Central Statistical Agency (CSA), Citation2020) and it is the first ranks among vegetables (Tebkew & Getachew, Citation2015). The area under onion is increasing from time to time, because it is highly profitable, easily propagated by seed, and the increase in small-scale irrigation areas (Food and Agriculture Organization (FAO), Citation2010). However, productivity is affected by several biotic and abiotic factors. Among the biotic factors, onion thrips, Thrips tabaci L. is a key insect pest of onion in Ethiopia (Tebkew & Getachew, Citation2015). According to Diaz-Montano et al. (Citation2011), onion thrips is a global pest of onion and the principal vector of Iris yellow spot virus (IYSV) that can cause 100% crop loss. This pest is responsible for a significant yield loss with the range of 23–85% in Ethiopia (Tadele & Mulugeta, Citation2014).
It is a well-established fact that the incidence of insect pests depends upon climatic conditions, crop growth stages, and natural enemies of a pest at a particular time (Kumawat et al., Citation2018). Weather variables such as temperature, rainfall, and relative humidity strongly affect the survival, development, fecundity, and behavior of individual insects (Wilstermann & Vidal, Citation2013). Therefore, information regarding population dynamics in relation to weather parameters is vital to planning the pest management schedule (Kumawat et al., Citation2018). Besides, understanding the relationship between weather variables and thrips population is important to develop integrated thrips control in a specific weather conditions (Waiganjo et al., Citation2008). Added to this, a predictive seasonal pest dynamics model is important to apply insecticides at the proper time and critical stage of plant growth (Haider et al., Citation2014). Ethiopian onion growers are heavily rely on the use of old and broad-spectrum synthetic insecticides that are available in the local market (Belay et al., Citation2017) and onion growers apply insecticides without considering growing seasons and monitoring thrips population (Yeshitla, Citation2015).
Appropriate information regarding population dynamics in relation to weather variables is fundamental to develop a weather-based pest forecasting system. Moreover, knowledge on seasonal pest dynamics allows farmers to deploy pesticide sprays and other control tactics effectively, thus increasing their value and decreasing negative impacts on the environment (Nault & Shelton, Citation2010). In Ethiopia, studies on seasonal variations of thrips population in relationship to weather variables are rare and limited to develop integrated thrips management. Hence, the objectives of the study were to investigate the seasonal fluctuations of thrips populations on onion in different seasons in the Central Rift Valley of Ethiopia.
2. Materials and methods
2.1. Description of the study area
Field experiments were conducted in three consecutive onion growing seasons, rainy season (June – September), cool dry season (October–January), and hot dry season (February – May) at Melkassa Agricultural Research Center (MARC) from 2015 to 2017. Melkassa is located at (8°24’ N and 30°21’ E). The elevation of the center is 1550 m.a.s.l. and it is characterized by low and erratic rainfall with an average of 771 mm rainfall per year over 80% of which falls between April and October, with the peak in July and August. The soils are mainly sandy with a pH of 6.9 -7.9 and mean temperature of 21°c (Desalegne & Shimeles, Citation2003).
2.2. Experimental procedures and field management
Seeds of the onion variety ‘Bombay Red’ were obtained from the Melkassa Agricultural Research Center (MARC). Seeds were raised on the nursery bed and transplanted at 2–3 leaf stage in all season. The plot size was 10 m x 10 m (100 m2) accommodating sixteen double rows with 0.2 m spaced apart in rows and replicated three times in an open field. The spaces between plots and plants were maintained at 1 m and 0.1 m, respectively. Di-ammonium phosphate (DAP) and urea were applied at the rate of 200 kg and 150 kg per hectare, respectively. The DAP was applied at time of transplanting and urea was applied into two times; the first half was applied at time of transplanting and the remaining half 30 days after transplanting. All other agronomic practices were followed as per the recommendation of the vegetable improvement program at Melkassa.
2.3. Data collection
Thrips population was counted at a weekly interval starting from 15 days after transplanting (DAT) and continued until the crop matured. Fifteen plants were sampled from the inner rows of each plot by visually examining the whole plant, including the center, leaves, and the base of the plant. Daily meteorological data on maximum temperature (T max°C) and minimum temperature (T min °C), relative humidity (RH %), rainfall (RF mm), and wind speed (WS m/s) were taken from Melkassa Agricultural Research Center Meteorological station.
2.4. Data analysis
Thrips count data were square root (√x + 0.5) transformed before analysis to stabilize the variance and normalize the data. Analysis was performed using the SAS statistical package (SAS Institute 2003). Pairwise comparisons were made at the 5% level of significance to determine the mean difference between seasons and growth stage with linear estimates and contrasts. Pearson correlation analysis was used to estimate the correlation between thrips population with weather variables. The influence of the predicting variables on the thrips population was estimated using stepwise regression analysis (SAS, Citation2003). Thrips population was expected to be influenced by growth stage (D1= early growth stage, D2 = bulb enlargement stage, D3= maturation growth stage) and seasons (S1= cool dry planting, S2 = hot dry planting and S3 = rainy planting). Season and growth stage effects were captured by creating dummy variables for each of the seasons and growth stage.
(1)
(1)
Where Pt is the thrips population, x1 is the season (S1 = 1 if cool dry, 0 otherwise, S2 = 1 if hot dry, 0 otherwise, and S3 = 1 if rainy, 0 otherwise), x2 is growth (D1 = 1 if early growth stage, 0 otherwise, D2 = 1 if bulb enlargement stages, 0 otherwise and D3 = 1 if maturation growth stages, 0 otherwise), x3 is weekly average rainfall (mm), x4 is weekly average daily minimum temperature, x5 is weekly average daily maximum temperature, and x6 is weekly average wind speed. Relative humidity (RH %) was excluded in the regression analysis due to the multicollinearity effect.
3. Results
3.1. Thrips population related to the growth stage of onion
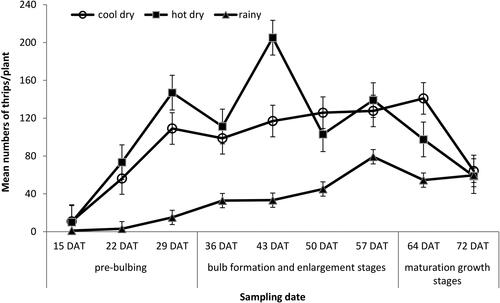
The thrips population was low until 29 days after transplanting (DAT) and increased rapidly starting from 36 DATS and peaked to 137 thrips/plant at 57 DAT in the dry cool season, 167 thrips/plant at 50 DAT in the dry hot season, and 52 thrips/plant in the rainy season during the 2015/2016 (). In 2016/2017, the highest thrips number, 145 thrips/plants at 64 DAT, 205 thrips/plant at 43 DAT, and 79 thrips/plant at 57 DAT in dry cool, dry hot and rainy season were recorded, respectively (). The thrips population was significantly affected by growth stages of onion (F = 16.8, df = 2, p < 0.0001). The pairwise comparison analyses indicated that there were significant differences between early growth stage and bulb enlargement stage (t = –5.45, df = 1, p < 0.001) and early growth stage and maturation growth stage (t = –4.65, df = 1, p = 0.001), but there was no significant difference between bulb enlargement stages and maturation growth stages (t = -0.01, df = 1, p = 0.92) in 2015/2016 cropping season. Similar to the 2016/17 cropping season, differences were significant between early growth stage and bulb enlargement stage (t = -3.02, df = 1, p = 0.006) and early growth stage and maturation growth stage (t = -1.88, df = 1, p = 0.072); and insignificant between bulb enlargement stages and maturation growth stages (t = 0.68, df = 1, p = 0.5).
Figure 1. Mean number of thrips per plant in cool dry, hot dry and rainy season on unprotected plot in 2015/2016. Error bars show SEs.
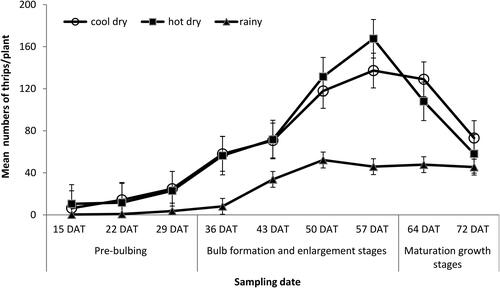
Figure 2. Mean number of thrips per plant in cool dry, hot dry and rainy seasons on unprotected plot in 2016/2017. Error bars show SEs.
3.2. Thrips population in different growing seasons
Thrips population was significantly affected by seasons (F = 8.9, df = 2, p = 0.0005). The pairwise comparison analyses indicated that there were significant differences between cool dry and rainy (t = 2.19, df = 1, p = 0.038) and hot dry and rainy (t = 2.18, df = 1, p = 0.038) seasons, but there was no significant difference between cool dry and hot dry (t = 0.01, df = 1, p = 0.99) season in 2015/2016 cropping season. Similar trends were observed in the 2016/17 cropping season, differences were significant between cool dry and rainy season (t = 2.91, df = 1, p = 0.0076) and hot dry and rainy season (t = –3.23, df = 1, p = 0.0037); and insignificant between cool dry and hot dry seasons (t = –0.32, df = 1, p = 0.75).
3.3. Thrips population in relation to weather variables
In the correlation analysis, thrips populations were significant negatively correlated with rainfall (r = -0.34, p = 0.012) and relative humidity (r = -0.36, p = 0.007), while significant positively correlated with maximum temperature(r = 0.33, p = 0.0132). Although, the minimum temperature (r = -0.19, p = 0.15) and wind speed (r = 0.17, p = 0.20) have shown to none significant correlation with thrips population (). The stepwise multiple regression analysis results showed that thrips abundance was significantly affected by growth stage, seasons, and rainfall in the selected model (P = 0.15) (). Sixty-eighth percent of the total variation of thrips number was explained by growth stage, season, and rainfall as independent variables (). Minimum and maximum temperature and wind speed were dropped in the selected model.
Table 1. Correlation coefficients (r) and significant levels for mean thrips population and weather variables (Mean of two years).
Table 2. The regression statistics for populations of thrips related to season, growth stage, and rainfall.
4. Discussion
The population of onion thrips in the different onion stages and growing seasons was significantly different. In all seasons, thrips population was lower during the early growth stage, gradually increased, and peak during the vegetative stage of the crop, followed by an abrupt decline in number with physiological maturity of onion in all seasons. In the multiple regression analysis, a negative slope of growth stage indicated that significantly lower thrips number counted in the early growth stage. The increased of thrips population during the vegetative stage of onion could be due to the availability of vigorous flesh green, high sap content, and maximum hiding places for thrips suitable for continuous breeding as reported by Haider et al. (Citation2014). Higher nutrient concentrations in young leaves compared to older leave were due to the nutrient translocation from older to younger leaves. A decline in the population of thrips occurs at the crop senescence stage due to depletion of plant resources and emigrates to surrounding crops and weed plants (Nyasani et al., Citation2013; Ullah et al., Citation2010). Onion thrips numbers decrease rapidly after onion plants mature, maybe the declining of nutrients and water flow in the onion plants (Mo et al., Citation2009). This is supported by Hossain et al. (Citation2015) who observed that the thrips population suddenly declined due to maturation of the crop, leaf hardening, and migration of thrips to other crops.
The weather pattern during the three onion growing seasons was quite variable. Rainfall and relative humidity was higher during the rainy season (August -September) in both years (Appendices 1 and 2). In the multiple regression analysis, a negative slope of the season indicated that significantly lower thrips numbers were counted in the rainy season. Significantly lower thrips infestation was observed during the rainy season, this could be explained by higher rainfall and relative humidity in the rainy season. Correlation analysis results also showed that the population of thrips was significant negatively correlated with rainfall and relative humidity. Liu (Citation2004) reported that rainfall tends to negatively affect thrips populations because it can temporarily wash off thrips from the plant. Rueda & Shelton (Citation2003) and Rueda et al. (Citation2007), observed that when rainfall was high, thrips populations declined sharply, while populations increased with increasing average daily maximum temperatures.
Thrips populations are usually higher during the dry season than the rainy season. The higher maximum daily mean temperature was observed during dry hot (February – May) planting period and the lowest minimum temperature was observed in the dry cool (November- January) planting period in both years (Appendices 1 and 2). During the dry season, more generations of thrips occur and thrips do not suffer mortality due to being washed off the plant or drowning in pockets of water on the plant (Rueda et al., Citation2007). Additionally, water stress can also additionally affect the dietary quality of onion plants and increases the splendor of the plants to thrips (Leach et al., Citation2017). Thrips population increases in hot and dry weather conditions, because of shorter generation time and higher number of generations (Rueda et al., Citation2007). Thrips infestation is magnified with increased temperature, which enhances the multiplication rate of thrips (Bergant et al., Citation2005; Waiganjo et al., Citation2008). Similarly, the correlation analysis results indicated that the thrips population was significantly positively correlated with maximum temperature. However, wind speed and minimum temperature had a weak relationship with thrips population.
5. Conclusion
Based on this study, it is concluded that the onion thrips population varied significantly between growth stages and different onion growing seasons. Significantly higher thrips populations were counted in hot dry and cool dry production seasons than the rainy production season with much higher of thrips population in the mid-vegetative growth stage than early growth stages in all seasons. The stepwise regression analyses showed that growth stage, season, and rainfall are responsible factors for regulating thrips abundance on onion. Maximum temperature is the main factor, which is significantly positively affecting the thrips population dynamics in the dry cropping season. On the other hand, relative humidity and rainfall are responsible factors for regulating thrips abundance on onion plants in the rainy growing season. However, further research about the combined effects of abiotic and biotic factors on thrips population and their effects onion yield is suggested to develop a predicted thrips population model and develop integrated thrips management in in the CRV of Ethiopia.
Authors’ contributions
All authors of this manuscript contributed to design the experiment, edited the manuscript, and approved the final manuscript before submission. Corresponding author, Belete Negash, performed data collection, wrote the original manuscript, revised and corrected the reviewers comment.
Acknowledgments
We acknowledge Melkassa Agricultural Research Center, Ethiopia, for providing experimental land and the research and technical staff of Melkassa Agricultural Research Center, Department of Entomology for their unreserved technical support during the study.
Disclosure statement
The study does not have any conflict of interests.
Data availability statement
The datasets used during and/or analyzed during the current study are available from the corresponding author on reasonable request.
Additional information
Funding
Notes on contributors

Belete Negash
Belete Negash (PhD) is a lecturer and researcher at Debre Markos University, Ethiopia. He did his PhD in Agricultural Entomology at Hawassa University, Ethiopia. He has been teaching different courses in the areas related to crop protection at Debre Markos University.
Ferdu Azerefegne
Ferdu Azerefegne, an Associate Professor of Entomology at Hawassa University, has been teaching and conducting research in areas related to crop protection for 40 years.
Gashawbeza Ayalew
Gashawbeza Ayalew (PhD) is a lead researcher in Agricultural Entomology at the Melkassa center of the Ethiopian Institute of Agricultural Research (EIAR). He has authored and coauthored over 80 publications in the area of agricultural entomology.
References
- Belay, M., Arthur, T., Mol, P. J., & Oosterveer, P. (2017). Pesticide use practices among smallholder vegetable farmers in Ethiopian Central Rift Valley. Environment, Development and Sustainability, 19(1), 301–324. https://doi.org/10.1007/s10668-015-9728-9
- Bergant, K., Stanislav, T., Dragan, Z., Nidarc, I. C., Zalika, C., Repins, E. K., Luc, K. A., & Kajfez, B. (2005). Impact of climate change on developmental dynamics of Thrips tabaci (Thysanoptera : Thripidae): Can it be quantified ? Environmental Entomology, 34(4), 755–766. https://doi.org/10.1603/0046-225X-34.4.755
- Central Statistical Agency (CSA). (2020). Agricultural sample survey report on area and production of crops private peasant holdings, meher season.pp 2-4. September– December 2014/2015 Volume I, Statistical Bulletin No. 388, Addis Ababa Ethiopia.
- Desalegne, L., & Shimeles, A. (2003). Research experiences in onion production. Research report number, 55. EARO, Addis Ababa Ethiopia.
- Diaz-Montano, J., Fuchs, M., Nault, A. M., Fail, J., & Shelton, A. M. (2011). Onion thrips (Thysanoptera:Thripidae): A global pest of increasing concern in onion. Journal of Economic Entomology, 104(1), 1–13. https://doi.org/10.1603/EC10269
- Food and Agriculture Organization (FAO). (2010). Onion seed production techniques. A manual for extension agents and seed producers. Asella.
- Haider, K., Abbas, G., Hameed, A., Ahmad, G., & Ali, A. (2014). Losses in onion (Allium Cepa) due to onion thrips, Thrips tabaci (Thysanoptera: Thripidae) and effect of weather factors on population dynamics of thrips. World Applied Sciences Journal, 32(11), 2250–2258. https://doi.org/10.5829/idosi.wasj.2014.32.11.2751
- Hossain, M. M., Hajee, M., & Danesh, S. (2015). Population dynamics and management of thrips in bulb onion Green Global Foundation. International Journal of Sustainabel Crop Production, 10(3), 8–15.
- Kumawat, K., Jat, B. L., & Kumawat, R. (2018). Seasonal incidence of thrips tabaci (Lind) (Thysonoptera: Thripidae) on onion. Journal of Entomology and Zoology Studies, 6(3), 1047–1049.
- Leach, A., Reiners, S., Fuchs, M., & Nault, B. (2017). Evaluating integrated pest management tactics for onion thrips and pathogens they transmit to onion. Agriculture, Ecosystems & Environment, 250, 89–101. https://doi.org/10.1016/j.agee.2017.08.031
- Liu, T. X. (2004). Seasonal population dynamics, life stage composition of Thrips tabaci (Thysanoptera: Thripidae), and predaceous natural enemies on onions in South Texas. Southwestern Entomologist, 29(2), 127–135.
- Mo, J., Stevens, M., Liu, D. L., & Herron, G. (2009). Investigating the effect of invasion characteristics on onion thrips (Thysanoptera: Thripidae) populations in onions with a temperature-driven process model. Environmental Entomology, 38(6), 1575–1584. https://doi.org/10.1603/022.038.0608
- Nault, B. A., & Shelton, A. M. (2010). Impact of insecticide efficacy on developing action thresholds for pest management: acase study of onion thrips (Thysanoptera: Thripidae) on onion. Journal of Economic Entomology, 103(4), 1315–1326. https://doi.org/10.1603/EC10096
- Nyasani, J. O., Meyhöfer, R., Subramanian, S., & Poehling, H.-M. (2013). Seasonal abundance of western flower thrips and its natural enemies in different French bean agroecosystems in Kenya. Journal of Pest Science, 86(3), 515–523. https://doi.org/10.1007/s10340-013-0491-0
- Rueda, A., & Shelton, A. M. (2003). Development of a bioassay system for monitoring susceptibility in Thrips tabaci. Pest Management Science, 59(5), 553–558. https://doi.org/10.1002/ps.680
- Rueda, A., Badenes-Perez, F. R., & Shelton, A. M. (2007). Developing economic thresholds for onion thrips in Honduras. Crop Protection, 26(8), 1099–1107. https://doi.org/10.1016/j.cropro.2006.10.002
- SAS. (2003). In SAS user’s guide: Statistical analysis systems, version 9.1.3. SAS Institute, Inc.
- Tadele, S., & Mulugeta, N. (2014). Evaluation of insecticides and botanicals against onion thrips, Thrips tabaci (L.) (Thysanoptera: Thripidae). Entomology and Applied Science, 1(2), 26–30.
- Tebkew, D., & Getachew, T. (2015). Small-Scale vegetable producers’ perception of pests and pesticide uses in east Shewa Zone, Ethiopia. International Journal of Pest Management, 61(3), 212–219. https://doi.org/10.1080/09670874.2015.1036822
- Ullah, F., Farid, A., Saeed, M. Q., & Satta, S. (2010). Population dynamics and chemical control of onion thrips (Thrips tabaci, Lindemann). Pakistan Journal of Zoology, 42(4), 402–406.
- Waiganjo, M. M., Gitonga, L. M., & Mueke, J. M. (2008). Effects of weather on thrips population dynamics. African Journal of Horticultural Science, 1, 82–90.
- Wilstermann, A., & Vidal, S. (2013). Western corn rootworm egg hatch and larval development under constant and varying temperatures. Journal of Pest Science, 86(3), 419–428. https://doi.org/10.1007/s10340-013-0496-8
- Yeshitla, M. (2015). Population dynamics and damages of onion thrips, Thrips tabaci (Thysanoptera: Thripidae) on onion in northeastern Ethiopia. Journal of Entomology and Nematology, 7(1), 1–4. https://doi.org/10.5897/JEN2014.0112
Appendix 1
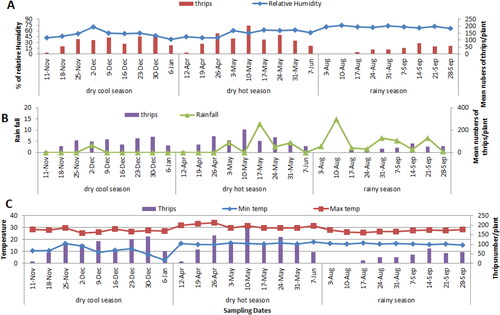
Figure A1. Weekly average relative humidity (%) (A), weekly average rainfall (mm), and weekly average minimum and maximum temperature (oC) and thrips number/plant in dry cool, dry hot and rainy season in the consecutive sampling dates in 2015/2016.
Appendix 2
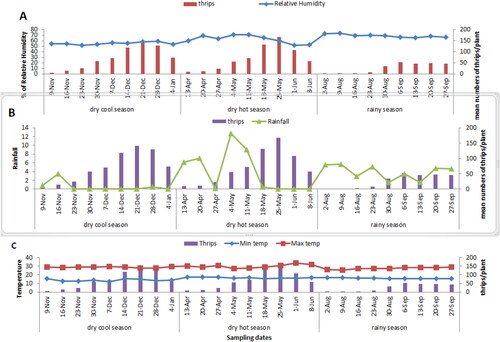
Figure A2. Weekly average relative humidity (%) (A), weekly average rainfall (mm), and weekly average minimum and maximum temperature (oC) and thrips number/plant in dry cool, dry hot and rainy season in the consecutive sampling dates in 2016/2017.