
 ?Mathematical formulae have been encoded as MathML and are displayed in this HTML version using MathJax in order to improve their display. Uncheck the box to turn MathJax off. This feature requires Javascript. Click on a formula to zoom.
Abstract
The structural, morphology, optical, electrical, and magnetic properties of Zn0.7MnxNi0.3−xO (x = 0.05, 0.1, 0.15, 0.2) nanoparticles synthesized by sol–gel technique have been systematically investigated by using X-ray diffractometer (XRD), scanning electron microscope (SEM), UV–vis-NIR spectrophotometer, impedance analyzer, and vibration sample magnetometer (VSM). XRD patterns reveal that all samples have hexagonal wurtzite structure along with secondary phases such as NiO and ZnMnO3. The average crystalline size increases with the increase in the Mn concentration in the host matrix. Diffuse reflectance studies (DRS) show an increment in optical band gap with increasing Mn content. AC conductivity of present samples has been studied as a function of frequency (100 Hz–10 MHz) of the applied AC signal in the temperature range of 323–463 K. The results showed that AC conductivity increases with an increase in frequency and temperature. The frequency exponent shows that small polaron conduction mechanism is the most favorable for all samples. The value of AC conductivity is observed to decrease with an increase in the Mn dopant concentration in the Zn0.7MnxNi0.3−xO system. At room temperature, magnetic characterization of the samples indicates the presence of both paramagnetic and ferromagnetic behavior. Magnetic saturation decreases with the increase in the Mn concentration in the host lattice.
Public Interest Statement
Mn-modified Ni–ZnO nanoparticles are dilute magnetic semiconductors (DMSs), which exhibit magnetic, magneto-electronic, and magneto-optical properties, and hence suitable for spintronics devices. So, keeping in view these technological applications, the influence of different Mn concentrations on structural, optical, electrical, and magnetic studies has been investigated in the present work.
1. Introduction
Semiconducting nanomaterials have attracted great scientific attention due to their unique properties for different nanotechnological potential applications (Jagadish & Pearton, Citation2006). ZnO (II–VI semiconductor)-based nanomaterials have recently attracted attention due to their wide direct band gap (3.37 eV) and large exciton binding energy (60 meV) for various applications in areas such as gas sensors, solar cells, laser diodes, ultraviolet (UV) luminescence devices, transparent thin transistors, biosensors, spintronics, and antibiotic materials (Al-Hardan, Abdullah, & Aziz, Citation2009; Nanto et al., Citation1986; Navale, Ravi, Mulla, Gosavi, & Kulkarni, Citation2007). Transition metals (TMs) such as Ni, Fe, Mn, Co, Cr, V, etc. are doped into ZnO to form dilute magnetic semiconductors (DMSs), which exhibit magnetic, magneto-electronic, and magneto-optical properties suitable for spintronics devices (Ohno, Citation1998). The addition of TM dopant in ZnO induces dramatic changes in structural, thermal, optical, electrical, and magnetic properties. The conductivity and optical properties depend on the amount of doping in ZnO. The electrical conductivity is influenced by the impurity atoms, defects, and grain boundaries which change the electric potential of the lattice (Karthik, Pandian, & Jaya, Citation2010). The band gap engineering using various dopants like Mn, Ni, Co, Cr has been reported (Bhat & Deepak, Citation2005; Fukumura, Jin, Ohtomo, Koinuma, & Kawasaki, Citation1999). DMS (TM–Mn-doped ZnO) exhibits room temperature ferromagnetism as has been observed by several researchers (Bhat & Deepak, Citation2005; Viswanatha et al., Citation2004). The formation of secondary phases in TM-doped ZnO significantly influences the structural, optical, transport, and magnetic properties of ZnO (Bhargava, Sharma, Kumar, Pandey, & Kumar, Citation2010). For Mn-doped ZnO nanoparticles many researchers have reported different magnetic behavior such as ferromagnetism (Jung et al., Citation2002), spin glass behavior (Fukumura et al., Citation2001), and paramagnetism (Tiwari et al., Citation2002). Nirmala, Smitha, and Anukaliani (Citation2011) have studied the optical and electrical properties of (Mn, Co) co-doped ZnO nanoparticles synthesized by DC thermal plasma method. The significant enhancement of optical and magnetic properties of (Cu, Cr) co-doped ZnO nanoparticles has been reported (Reddy, Murali, Poornaprakash, Vijayalakshami, & Reddy, Citation2012). TM-doped ZnO nanoparticles were synthesized by spin coating (Schwartz, Norberg, Nguyen, Parker, & Gamelin, Citation2003), sol–gel (El Ghoul, Barthou, Saadoun, & El Mir, Citation2010), hydrothermal reactions (Al-Harbi, Citation2011), and spray pyrolysis (Lee, Jeong, Cho, & Park, Citation2002). There are no reports on (Mn, Ni) co-doped ZnO nanoparticles. The substitution of Mn2+ ions in Ni-modified ZnO nanoparticles leads to the modification of structural, optical, electrical, and magnetic properties. In the present study, Zn0.7MnxNi0.3−xO (x = 0.05, 0.1, 0.15, 0.2) nanoparticles have been synthesized by sol–gel technique. The influence of different Mn concentrations on structural, optical, electrical, and magnetic studies has been investigated in the present work.
2. Experimental details
2.1. Synthesis
The various compositions of the system, Zn0.7MnxNi0.3−xO (x = 0.05, 0.1, 0.15, 0.2), were prepared in the form of polycrystalline nanoparticles powders by sol–gel technique. The zinc acetate (Zn (CH3COO)2.2H2O), nickel acetate (Ni(CH3COO)2.4H2O), and manganese acetate (Mn(CH3COO)2.4H2O) of analar grade were dissolved in distilled water in proper stoichiometric ratio separately and the resulting solutions were mixed and stirred to ensure homogenous mixing. Then monoethanolamine was added slowly. The final solution was heated at 60–70°C for one hour with continuous stirring using magnetic stirrer to convert sol into gel form. The gel was cooled at room temperature for 2–3 h and the precipitates were filtered and washed with distilled water and subsequently with ethanol and acetone to remove impurities. The precipitates were dried at 200°C in an electric muffle furnace for one hour and subsequently grinded in mortar and pestle to make fine powder. The calcination of all samples was performed by heating them at 700°C in electric muffle furnace for 1 h each.
2.2. Characterization techniques
Structural analysis of the samples was performed by using Rigaku Table-Top X-ray diffractometer with CuKα radiation (λ = 1.54 Å) at 40 KV and 100 mA with scanning rate of 2°/min. The microstructure of samples was characterized by using scanning electron microscope (Carl Zeiss Supra 55). Diffuse reflectance of annealed nanoparticles has recorded using double beam UV–vis-NIR spectrophotometer (Shimadzu Model MPC-3100) in the range of 200–800 nm. Conductivity measurements were carried out using Novo control Technologies GmbH & Co. KG in frequency range of 100 Hz–10 MHz and temperature ranging from 323 to 463 K. The magnetic measurements were carried out at room temperature using vibration sample magnetometer (VSM – Microsense).
3. Results and discussion
3.1. Structural and morphological studies
Typical X-ray diffractometer (XRD) patterns of Zn0.7MnxNi0.3−xO (x = 0.05, 0.1, 0.15, 0.2) samples calcined at 700°C is presented in Figure . The diffraction pattern shows the segregation of secondary phases namely cubic NiO (JCPDS No. 04-0835) and face-centered ZnMnO3 structure (JCPDS No. 19-1461) besides the major hexagonal wurtzite structure corresponding to ZnO (standard data JCPDS No. 36-1451) (Toloman et al., Citation2013; Tong et al., Citation2010). The average crystallite size (grain size) has been calculated from the full width at half maxima (FWHM) of the diffraction peaks using the Debye–Scherrer equation (Elilarassi & Chandrasekaran, Citation2012)(1)
(1)
Figure 1. X-ray diffraction spectra of Zn0.7MnxNi0.3−xO (x = 0.05, 0.1, 0.15, 0.2) nanoparticles calcined at 700°C.
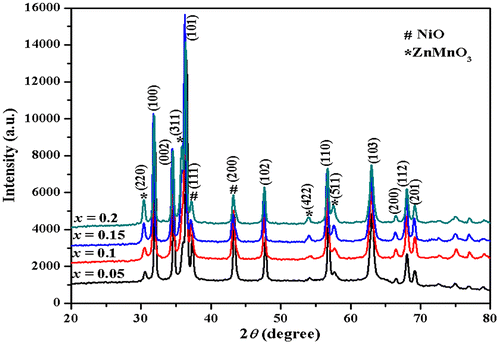
where D is the average crystalline size, k is the shape factor, λ is the wavelength of X-ray radiation, β is the FWHM, and θ is the Bragg’s angle. The most intense peak (101) in the XRD pattern has been used to calculate the average crystalline size and it is listed in Table . The average crystallite size is observed to increase with an increase in the Mn content in the host matrix. The peak (101) shifts towards lower 2θ angle with an increase in x. The increase in Mn content causes lattice disorder and strain induced by incorporation of Mn2+ ions in the host matrix. So there is slight variation in lattice parameters (Jayakumar et al., Citation2007; Omri et al., Citation2013).
Table 1. Compositional dependence of average crystalline size (D), SEM (D), optical band gap (Eopt), activation energy of grain boundaries (Egb), grains (Eg), coercive field (Hc), remanent magnetization (Mr), and saturation magnetization (Ms)
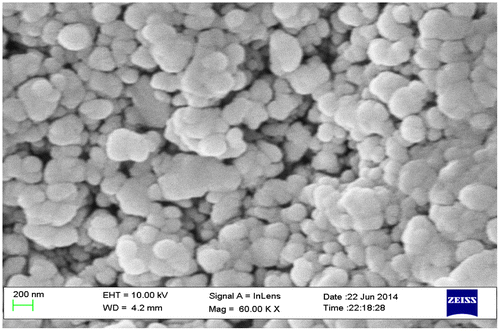
The scanning electron microscope (SEM) micrograph of Zn0.7MnxNi0.3−xO (x = 0.05, 0.1, 0.15, 0.2) samples is more or less similar. Figure shows the typical SEM micrograph for Zn0.7MnxNi0.3−xO (x = 0.1) sample. The micrograph reveals that there is heterogeneity at the surface and particles agglomeration. The particles are almost spherical and uniform in size. The average particle sizes estimated from SEM micrograph are found out to be in the range 40–50 nm and the values are listed in Table . The SEM micrographs, therefore, indicate the formation of nanoparticles.
Figure 2. Scanning electron micrograph (SEM) of Zn0.7MnxNi0.3−xO (x = 0.1) sample.
3.2. Diffuse reflectance studies (DRS)
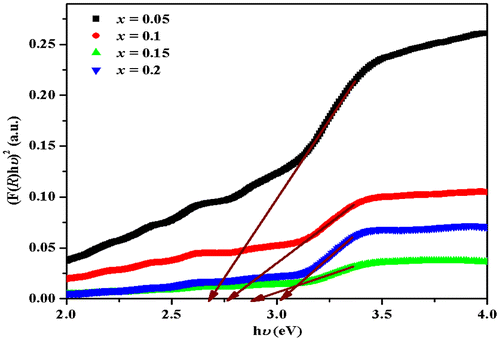
Diffuse reflectance spectra of nanoparticles Zn0.7MnxNi0.3−xO (x = 0.05, 0.1, 0.15, 0.2) were recorded in the spectral range 200–800 nm. The acquired diffuse reflectance spectra has been converted to Kubelka–Munk function (F(R)), which is proportional to the absorption coefficient (α) (Torrent & Barron, Citation2002).(2)
(2)
(3)
(3)
(4)
(4)
where Rsample and Rstandard represent reflectance of sample and standard reference (BaSO4).
The absorption coefficient (α) near band edge as a function of photon energy (hυ) is expressed by Tauc relation (Suwanboon, Amornpitoksuk, Haidoux, & Tedenac, Citation2008):(5)
(5)
where Eopt is the optical band gap and B is a constant. The parameter α in the Tauc’s equation, when substituted with F(R), becomes:(6)
(6)
Exponent p depends on the type of transition and it may have values 1/2, 2, 3/2, and 3 corresponding to the allowed direct, allowed indirect, forbidden direct, and forbidden indirect transitions, respectively (Punia et al., Citation2011). Tauc’s plot has been plotted for p = 1/2, 2, 3/2, and 3, but plot with p = 1/2 gives best fit. The value of direct band gap is determined by extrapolating the straight line portion of (F(R)hυ)2 vs. hυ plot at (F(R)hυ)2 = 0 axis (Kortüm, Citation1969) as shown in Figure and the values are listed in Table . Optical band gap increases with the increase in the Mn concentration and decrease in NiO in the host matrix. Similar trend is observed by other researchers (Cheng & Chien, Citation2003; Fukumura et al., Citation1999). The observed blue shift behavior or increase in band gap cannot be assigned to quantum size effects (Cheng & Chien, Citation2003; Fukumura et al., Citation1999). This behavior may be due to band continuum and orbital hybridization between Mn atom and host band (Cheng & Chien, Citation2003; Fukumura et al., Citation1999).
Figure 3. (F(R)hυ)2 vs. hυ plot for direct band gap determination of Zn0.7MnxNi0.3−xO (x = 0.05, 0.1, 0.15, 0.2) nanoparticles.
3.3. AC conductivity
The AC conductivity σ′ derived from the complex impedance data using the relation(7)
(7)
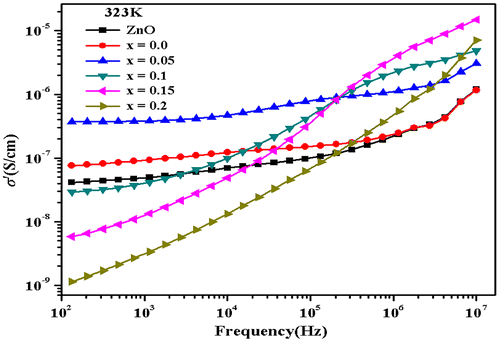
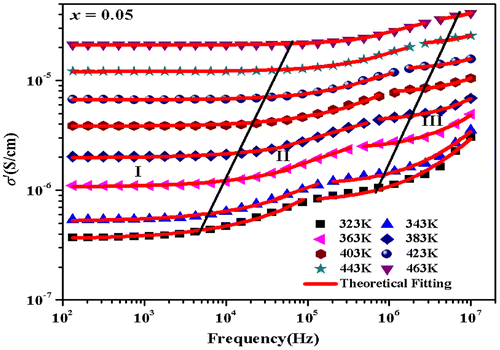
where ω is the angular frequency of the applied field, ε0 is the permittivity of free space, and ε″ is the imaginary part of dielectric constant. The frequency-dependent conductivity spectra for all samples were studied in temperature range of 323 ≤ T ≤ 463 K. The conductivity vs. frequency spectra for all samples at temperature 323 K are illustrated in Figure . The spectra may be divided into three regions. According to the jump relaxation model (Funke, Citation1986, Citation1992), in region I, (low frequency), the electric field cannot perturb the hopping conduction mechanism of charged particles. The conductance is approximately equal to the DC value (σdc) and the conduction mechanism is the same as that for DC conduction, i.e. hopping of charged particles from one localized site to another. The conductivity begins to increase nonlinearly after the frequency exceeds the critical frequency fc, in dispersive region II. It may be due to the fact that with the increase in frequency, capacitor admittance becomes numerically larger than the resistor admittance. With further increase in frequency (region III), conductivity becomes proportional to frequency resulting in nearly constant loss (NCL) (León et al., Citation2001). In most materials, the NCL regime dominates AC conductivity at high frequency. The curves are thus flat in low frequency region as the conductivity values approximately correspond to σdc. With the increase in frequency, the conductivity spectra become more dispersive. The frequency conductivity spectra exhibit multiple step-like increments which is a characteristic of a potential profile with multiple activation energies (Barsoukov & Macdonald, Citation2005).
Figure 4. Variation of AC conductivity for Zn0.7MnxNi0.3−xO (Pure ZnO, x = 0.0, 0.05, 0.1, 0.15, 0.2) samples at 323 K.
Generally AC conductivity behavior is analyzed using the Jonsher’s power law (Punia, Kundu, Murugavel, & Kishore, Citation2012),(8)
(8)
where σdc is the DC conductivity, ωH is the crossover frequency separating DC regime (plateau region) from the dispersive conduction, and n is the frequency exponent that lies between 0 and 1. Equation 8 describes the conduction mechanism, with the first term in RHS is the DC conductivity due to band conduction and the second term shows the transport properties of polarons, ions, and electrons (Punia, Kundu, Dult, Murugavel, & Kishore, Citation2012). The AC conductivity in the entire frequency region cannot be accounted by Equation 8, rather two such formulae have been used in different frequency regions to explain the presence of two relaxation mechanisms (Zhang, Citation2005). The conductivity at low frequencies has almost a constant value assigned to DC conductivity for grain boundaries (σgb) and the frequency independent plateau in region II is due to the DC conductivity for grains (σg). The values of σdc, ωH, and n are obtained by the fitting of the frequency-dependent conductivity (σ′(ω)) data measured experimentally at different temperatures with Equation 8 for different frequency regions. Figure shows the experimental data fitted with Jonscher’s universal power law (Equation 8) in different frequency regions for Zn0.7Mn0.05Ni0.25O sample.
Figure 5. Measured total AC conductivity (σ′) for Zn0.7Mn0.05Ni0.25O composition, shown as function of frequency at eight different temperatures.
The value of n for different frequency regions increases with the increase in temperature. Figure illustrates the variation of exponent n with temperature at different compositions for low-frequency dispersion region. As n increases with increasing temperature in all studied samples, then the conduction process can be explained with the small polaron quantum mechanical tunneling theory (Punia, Kundu, Dult et al., Citation2012). If small polarons are formed, then according to tunneling model (Punia, Kundu, Dult et al., Citation2012) frequency exponent (n) becomes(9)
(9)
Figure 6. Plot of frequency exponent n with temperature for Zn0.7MnxNi0.3−xO (x = 0.05, 0.1, 0.15, 0.2) samples at low frequency dispersion region.
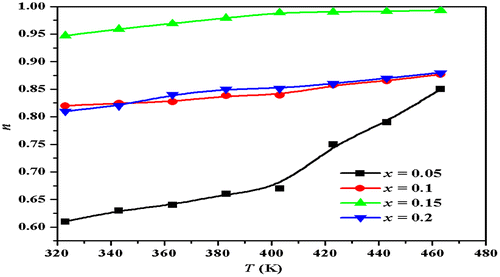
Equation 9 suggests that n increases with an increase in temperature. In the present samples, small polaron conduction mechanism is predominant. Equation 8 shows that conductivity increases with the increase in frequency which is in good agreement with our results. The increase in conductivity with the frequency can be explained on the basis that charge carriers are transferred between different localized states and trapped charges are liberated with the help of pumping force of the applied frequency (Ahmed, Ateia, & El-Dek, Citation2003). The electron-hopping model explains the electrical conduction mechanism in which electron hopping between the lattice sites takes place. Consequently, the hopping frequency of charge carriers increases with the increase in frequency resulting in an increase in conductivity. Electrical conductivity increases with the increase in temperature due to the increase in drift mobility of the thermally activated charge carriers (Uitert, Citation1995).
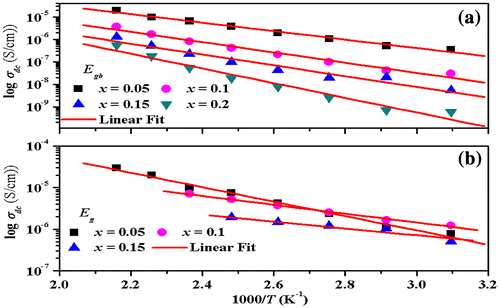
The inverse temperature variation of DC conductivity for grain boundaries and grains follows the Arrhenius relation:(10)
(10)
where σ0 is the pre-exponential parameter that depends on the nature of semiconductor, EA denotes the thermal activation energy of electrical conduction, and k is Boltzmann’s constant. The activation energies for grain boundaries (Egb) and grains (Eg) are calculated from the slope of linear fit of logσdc vs. 1,000/T plot shown in Figure ((a) and (b)) and the obtained values are presented in Table for all studied samples. Persual of the data presented in Table indicates that activation energy of grain boundaries and grains increases with an increase in the Mn concentration in Zn0.7MnxNi0.3−xO nanoparticles, suggesting thereby decrease in conductivity (Wang, Thomas, & O’Brien, Citation2006). These grain boundaries act as an insulating layer between grains thus creating the interfacial/space polarization. Perusal of the data shown in Figure indicates that conductivity decreases with the increase in the Mn concentration. This may be attributed due to the fact that dopant (Mn) introduces the defect ions in Zn0.7MnxNi0.3−xO system. During sintering and cooling processes, the diffusion process occurs due to which these defects tend to segregate at grain boundaries. The increase in dopant concentration enhances the concentration of defect ions which ease to the formation of grain boundary defect barrier leading to the blockage of flow of charge carriers. So, the conductivity decreases with the increase in Mn concentration and the decrease in Ni concentration in Zn0.7MnxNi0.3−xO system.
Figure 7. Arrhenius plots of DC conductivity (σdc) for Zn0.7MnxNi0.3−xO (x = 0.05, 0.1, 0.15, 0.2) samples.
3.4. Magnetic studies
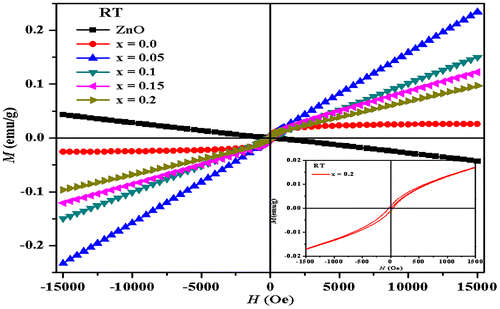
Room temperature magnetization of Zn0.7MnxNi0.3−xO (x = 0.05, 0.1, 0.15, 0.2) samples was measured as a function of applied magnetic field in the range of −15,000 to + 15,000G using VSM. The magnetization curves are shown in Figure and the values of coercive field (Hc), remanent magnetization (Mr), and saturation magnetization (Ms) for all samples are listed in Table . The magnetization curves presented a small kink at around an origin indicating that the samples have small ferromagnetic component along with significant paramagnetic component. Similar results of co-existence of ferromagnetism and paramagnetism have been observed by other researchers (Ahn, Park, Shim, & Kim, Citation2004; Ohno, Munekata, Penney, Molnar, & Chang, Citation1992; Sharma et al., Citation2003). The paramagnetic behavior may be due to the spins of isolated Mn2+ ions (Jayakumar et al., Citation2007). There are several factors that can induce ferromagnetism in Zn0.7MnxNi0.3−xO (x = 0.05, 0.1, 0.15, 0.2) system such as oxygen vacancies, lattice defects, and presence of secondary phases (Sharma et al., Citation2003). In the present samples, ferromagnetic behavior (Figure , inset for x = 0.2) may be due oxygen vacancies which increases with the increase in the Mn ion concentration. Oxygen vacancies are responsible for ferromagnetism in Mn-doped ZnNiO samples at room temperature (Gao et al., Citation2013). The saturation magnetization of the samples tends to decrease as the concentration of Mn increases and the Ni concentration decreases, which suggests the partial and reduced incorporation of Mn2+ ions in Zn0.7MnxNi0.3−xO lattice and values are listed in Table . This decrease in magnetization may be due to the interaction among Mn magnetic moments and anti-ferromagnetic exchange increases with the increase in the Mn concentration (Wang et al., Citation2004).
Figure 8. Field-dependent magnetization at room temperature Zn0.7MnxNi0.3−xO (Pure ZnO, x = 0.0, 0.05, 0.1, 0.15, 0.2) samples.
4. Conclusions
Zn0.7MnxNi0.3−xO (x = 0.05, 0.1, 0.15, 0.2) nanoparticles have been synthesized by the sol–gel technique. The XRD patterns indicate that the samples have secondary phases NiO and ZnMnO3 besides the major hexagonal wurtzite structure corresponding to ZnO. The average crystalline size was observed to increase with an increase in the Mn content. The average particle size estimated form SEM was found in the range 40–50 nm. Optical studies show that the optical band gap increases with the increase in the Mn concentration in the host matrix. AC conductivity increases with the increase in frequency of applied AC field and temperature. The hopping frequency of charge carriers increases with the increase in frequency and small polaron hopping conduction mechanism predominates in the studied samples. The value of AC conductivity decreases with the increase in the Mn concentration in Zn0.7MnxNi0.3−xO lattice. It may be due to the enhancement of defect ions concentration. The magnetic measurements show that both paramagnetic and ferromagnetic behavior is present in studied samples. In the present samples, ferromagnetic behavior may be due to the formation of secondary phases such as ZnMnO3. The saturation magnetization of the samples tends to decrease as the concentration of Mn increases.
Additional information
Funding
Notes on contributors
Rajesh Punia
Rajesh Punia is an associate professor at Department of Physics, Indira Gandhi University, Meerpur, Rewari. He received his PhD (Physics) from GJ University of Science and Technology, Hisar, and MSc (Physics) from University of Delhi, Delhi. He has 10 years of post-graduate teaching experience. He has published more than 30 research papers in international journals and delivered more than 20 invited talks in seminars/conferences/orientation programs/refresher courses. His area of interests includes structural, physical, optical, electronic transport, and magnetic properties of oxide glasses, glass ceramics, nanoparticles, multiferroics, etc.
In present research paper, the structural, optical, electrical, and magnetic properties of Ni and Mn (Transition metals)-modified ZnO nanoparticles (synthesized by sol–gel technique) have been discussed in detail, being dilute magnetic semiconductors, these materials may be suitable for spintronics devices.
References
- Ahmed, M. A., Ateia, E., & El-Dek, S. I. (2003). Rare earth doping effect on the structural and electrical properties of Mg–Ti ferrite. Materials Letters, 57, 4256–4266.10.1016/S0167-577X(03)00300-8
- Ahn, G. Y., Park, S. I., Shim, I. B., & Kim, C. S. (2004). Mössbauer studies of ferromagnetism in Fe-doped ZnO magnetic semiconductor. Journal of Magnetism and Magnetic Materials, 282, 166–169.10.1016/j.jmmm.2004.04.039
- Al-Harbi, T. (2011). Hydrothermal synthesis and optical properties of Ni doped ZnO hexagonal nanodiscs. Journal of Alloys and Compounds, 509, 387–390.10.1016/j.jallcom.2010.09.034
- Al-Hardan, N., Abdullah, M. J., & Aziz, A. A. (2009). The gas response enhancement from ZnO film for H2 gas detection. Applied Surface Science, 255, 7794–7797.10.1016/j.apsusc.2009.04.180
- Barsoukov, F., & Macdonald, J. R. (2005). Impedance spectroscopy. New York, NY: Wiley-Interscience Press.10.1002/0471716243
- Bhargava, R., Sharma, P. K., Kumar, S., Pandey, A. C., & Kumar, N. (2010). Consequence of doping mediated strain and the activation energy on the structural and optical properties of ZnO: Cr nanoparticles. Journal of Solid State Chemistry, 183, 1400–1408.10.1016/j.jssc.2010.04.014
- Bhat, S. V., & Deepak, F. L. (2005). Tuning the bandgap of ZnO by substitution with Mn2+, Co2+ and Ni2+. Solid State Communications, 135, 345–347.10.1016/j.ssc.2005.05.051
- Cheng, X. M., & Chien, C. L. (2003). Magnetic properties of epitaxial Mn-doped ZnO thin films. Journal of Applied Physics, 93, 7876–7878.10.1063/1.1556125
- El Ghoul, J., Barthou, C., Saadoun, M., & El Mir, L. (2010). Synthesis and optical characterization of SiO2/Zn2SiO4: Mn nanocomposite. Physica B: Condensed Matter, 405, 597–601.10.1016/j.physb.2009.09.072
- Elilarassi, R., & Chandrasekaran, G. (2012). Synthesis, structural and magnetic characterization of Ni-doped ZnO diluted magnetic semiconductor. American Journal of Materials Science, 2, 46–50.10.5923/j.materials.20120201.09
- Fukumura, T., Jin, Z., Kawasaki, M., Shono, T., Hasegawa, T., Koshihara, S., & Koinuma, H. (2001). Magnetic properties of Mn-doped ZnO. Applied Physics Letters, 78, 958–960.10.1063/1.1348323
- Fukumura, T., Jin, Z., Ohtomo, A., Koinuma, H., & Kawasaki, M. (1999). An oxide-diluted magnetic semiconductor: Mn-doped ZnO. Applied Physics Letters, 75, 3366–3368.10.1063/1.125353
- Funke, K. (1986). Debye–Hückel-type relaxation processes in solid ionic conductors: The model. Solid State Ionics, 18–19, 183–190.10.1016/0167-2738(86)90109-8
- Funke, K. (1992). Jump relaxation in solid electrolytes. Progress in Solid State Chemistry, 22, 111–195.
- Gao, Q. Q., Yu, Q. X., Yuan, K., Fu, X. N., Chen, B., Zhu, C. X., & Zhu, H. (2013). Influence of annealing atmosphere on room temperature ferromagnetism of Mn-doped ZnO nanoparticles. Applied Surface Science, 264, 7–10.10.1016/j.apsusc.2012.08.108
- Jagadish, C., & Pearton, S. (2006). Zinc oxide bulk, thin films and nanostructures (1st ed.). Chennupati: Elsevier.
- Jayakumar, O. D., Gopalakrishnan, I. K., Kadam, R. M., Vinu, A., Asthana, A., & Tyagi, A. K. (2007). Magnetization and structural studies of Mn doped ZnO nanoparticles: Prepared by reverse micelle method. Journal of Crystal Growth, 300, 358–363.10.1016/j.jcrysgro.2006.12.030
- Jung, S. W., An, S. J., Yi, G., Jung, C. U., Lee, S., & Cho, S. (2002). Ferromagnetic properties of Zn1−xMnxO epitaxial thin films. Applied Physics Letters, 80, 4561–4563.10.1063/1.1487927
- Karthik, K., Pandian, S. K., & Jaya, N. V. (2010). Effect of nickel doping on structural, optical and electrical properties of TiO2 nanoparticles by sol–gel method. Applied Surface Science, 256, 6829–6833.10.1016/j.apsusc.2010.04.096
- Kortüm, G. (1969). Reflectance spectroscopy. New York, NY: Springer.10.1007/978-3-642-88071-1
- Lee, H. J., Jeong, S. Y., Cho, C. R., & Park, C. H. (2002). Study of diluted magnetic semiconductor: Co-doped ZnO. Applied Physics Letters, 81, 4020–4022.10.1063/1.1517405
- León, C., Rivera, A., Várez, A., Sanz, J., Santamaria, J., & Ngai, K. L. (2001). Origin of constant loss in ionic conductors. Physical Review Letters, 86, 1279–1282.10.1103/PhysRevLett.86.1279
- Nanto, H., Minami, T., & Takata, S. (1986). Zinc-oxide thin-film ammonia gas sensors with high sensitivity and excellent selectivity. Journal of Applied Physics, 60, 482–483.10.1063/1.337435
- Navale, S. C., Ravi, V., Mulla, I. S., Gosavi, S. W., & Kulkarni, S. K. (2007). Low temperature synthesis and NOx sensing properties of nanostructured Al-doped ZnO. Sensors and Actuators B: Chemical, 126, 382–386.10.1016/j.snb.2007.03.019
- Nirmala, M., Smitha, P., & Anukaliani, A. (2011). Optical and electrical properties of undoped and (Mn, Co) co-doped ZnO nanoparticles synthesized by DC thermal plasma method. Superlattices and Microstructures, 50, 563–571.10.1016/j.spmi.2011.09.002
- Ohno, H. (1998). Making nonmagnetic semiconductors ferromagnetic. Science, 281, 951–956.10.1126/science.281.5379.951
- Ohno, H., Munekata, H., Penney, T., Molnar, S. V., & Chang, L. L. (1992). Magnetotransport properties of p-Type (In,Mn) as diluted magnetic III-V semiconductors. Physical Review Letters, 68, 2664–2667. Retrieved from http://dx.doi.org/10.1103/PhysRevLett.68.2664
- Omri, K., El Ghoul, J., Lemine, O. M., Bououdina, M., Zhang, B., & El Mir, L. (2013). Magnetic and optical properties of manganese doped ZnO nanoparticles synthesized by sol–gel technique. Superlattices and Microstructures, 60, 139–147.10.1016/j.spmi.2013.04.029
- Punia, R., Kundu, R. S., Dult, M., Murugavel, S., & Kishore, N. (2012). Temperature and frequency dependent conductivity of bismuth zinc vanadate semiconducting glassy system. Journal of Applied Physics, 112, 083701.10.1063/1.4759356
- Punia, R., Kundu, R. S., Hooda, J., Dhankhar, S., Dahiya, S., & Kishore, N. (2011). Effect of Bi2O3 on structural, optical, and other physical properties of semiconducting zinc vanadate glasses. Journal of Applied Physics, 110, 033527.10.1063/1.3621188
- Punia, R., Kundu, R. S., Murugavel, S., & Kishore, N. (2012). Hopping conduction in bismuth modified zinc vanadate glasses: An applicability of Mott’s model. Journal of Applied Physics, 112, 113716.10.1063/1.4768898
- Reddy, D. A., Murali, G., Poornaprakash, B., Vijayalakshmi, R. P., & Reddy, B. K. (2012). Structural, optical and magnetic properties of Zn0.97−xCuxCr0.03S nanoparticles. Applied Surface Science, 258, 5206–5211.10.1016/j.apsusc.2012.01.123
- Schwartz, D. A., Norberg, N. S., Nguyen, Q. P., Parker, J. M., & Gamelin, D. R. (2003). Magnetic quantum dots: Synthesis, spectroscopy, and magnetism of Co2+ - and Ni2+ -Doped ZnO nanocrystals. Journal of the American Chemical Society, 125, 13205–13218.10.1021/ja036811v
- Sharma, P., Gupta, A., Rao, K. V., Owens, F. J., Sharma, R., Ahuja, R., … Gehring, G. A. (2003). Ferromagnetism above room temperature in bulk and transparent thin films of Mn-doped ZnO. Nature Materials, 2, 673–677.10.1038/nmat984
- Suwanboon, S., Amornpitoksuk, P., Haidoux, A., & Tedenac, J. C. (2008). Structural and optical properties of undoped and aluminium doped zinc oxide nanoparticles via precipitation method at low temperature. Journal of Alloys and Compounds, 462, 335–339.10.1016/j.jallcom.2007.08.048
- Tiwari, A., Jin, C., Kvit, A., Kumar, D., Muth, J. F., & Narayan, J. (2002). Structural, optical and magnetic properties of diluted magnetic semiconducting Zn1−xMnxO films. Solid State Communications, 121, 371–374.10.1016/S0038-1098(01)00464-1
- Toloman, D., Mesaros, A., Popa, A., Raita, O., Silipas, T. D., Vasile, B. S., … Giurgiu, L. M. (2013). Evidence by EPR of ferromagnetic phase in Mn-doped ZnO nanoparticles annealed at different temperatures. Journal of Alloys and Compounds, 551, 502–507.10.1016/j.jallcom.2012.10.183
- Tong, L. N., He, X. M., Han, H. B., Hu, J. L., Xia, A. L., & Tong, Y. (2010). Effects of annealing on ferromagnetism of Ni-doped ZnO powders. Solid State Communications, 150, 1112–1116.10.1016/j.ssc.2010.03.029
- Torrent, J., & Barron, V. (2002). Encyclopedia of surface and colloid science. New York, NY: Marcel Dekker.
- Uitert, L. G. V. (1995). DC resistivity in the nickel and nickel zinc ferrite system. The Journal of Chemical Physics, 23, 1883–1887. Retrieved from http://dx.doi.org/10.1063/1.1740598
- Viswanatha, R., Sapra, S., Sen Gupta, S., Satpati, B., Satyam, P. V., Dev, B. N., & Sarma, D. D. (2004). Synthesis and characterization of Mn-doped ZnO nanocrystals. The Journal of Physical Chemistry B, 108, 6303–6310.10.1021/jp049960o
- Wang, Y. S., Thomas, P. J., & O’Brien, P. (2006). Optical properties of ZnO nanocrystals doped with Cd, Mg, Mn, and Fe ions. The Journal of Physical Chemistry B, 110, 21412–21415.10.1021/jp0654415
- Wang, Z., Tang, J., Chen, Y., Spinu, L., Zhou, W., & Tung, L. D. (2004). Room-temperature ferromagnetism in manganese doped reduced rutile titanium dioxide thin films. Journal of Applied Physics, 95, 7384–7386.10.1063/1.1667858
- Zhang, L. (2005). Electrode and grain-boundary effects on the conductivity of CaCu3Ti4O12. Applied Physics Letters, 87, 022907.10.1063/1.1993748