
 ?Mathematical formulae have been encoded as MathML and are displayed in this HTML version using MathJax in order to improve their display. Uncheck the box to turn MathJax off. This feature requires Javascript. Click on a formula to zoom.
Abstract
This study empirically analyzes the persistence of the performance for the Taiwanese logistic company. It is the first study to address the hot hand effect on the performance of logistic stations. Generally, the well-performed stations (Winner) will still have a better performance in the following period; the poor-performed stations (Loser) will stay in the worst group. Moreover, we find there is a strong evidence of location advantage for the business stations which supports the discussion of Hernández and Pedersen. It reveals that a non-metropolitan station is well performed rather than the metropolitan station. Either to increase the number of cargo or to decrease the number of workers will promote the performance of the company. Our empirical results can also be extended to the logistic companies in the emerging markets and transition economies. Policy-makers can provide some incentives to make the logistics industry more vigorous development and create economic prosperity.
JEL classification:
Public Interest Statement
We account the logistic company’s operating performance as revenue per number, revenue per item. This research empirically analyzes the persistence of the performance for the Taiwanese logistic company.
We find that the well-performed stations (Winner) will still have a better performance in the following period; the poor-performed stations (Loser) will stay in the worst group. It is called the hot hand effect. And this is the first study to dress it on the performance of logistic business stations.
Here, we also find that the more rural the station locates, the better performances the station gains. And the non-metropolitan stations are better than the metropolitan stations.
I. Introduction
The goal of supply chain management is a linkage of the marketplace, the distribution network, the manufacturing process, and the procurement activity. In such a way, the customers are serviced at higher levels and yet at a lower total cost. As discussed in Stock (Citation1987), the decision-making unit (DMU) should concern in the acquisition of a professional service (logistics consulting services) and the acquiring processes. As the discussion of Mentzer et al. (Citation2002), the managers and researchers pay more and more attention on the return management in the field of supply chain management. Min and Zhou (Citation2002) said that the supply chain management helps firms to integrate and coordinate the inter-functional and inter-organizational synergies. Antràs and Chor (Citation2013) also showed that the incentive to integrate suppliers varies systematically with the relative position. Derwik, Hellström, and Karlsson (Citation2016) pointed out that logistics and supply chain managers may more rely on the aging competences in practice rather than supply chain management expertise. For providing a start point to professional services, Chen, Anselmi, Falasca, and Tian (Citation2017) develops a conceptual return management in logistics by revisiting the managers of the supply chain companies. Grushevska and Notteboom (Citation2014) said that logistics is a key area to improve Ukraine’s competitiveness and to improve the ease of doing business in the country.
However, Liu et al. (Citation2012) discussed the green supply chain management (GSCM) based on the Chinese company, Yangtze River Delta. They found that environmental management capacities of a company will be strongly enhanced by frequently internal training of employees to increase its involvement in GSCM practices. And Al-Najjar and Anfimiadou (Citation2012) investigated the effect of environmental policies on the UK transport company’s performance. Oberhofer and Dieplinger (Citation2014) showed that some environmental factors will affect the performance of Austrian transport and logistics companies. And they suggested that the Austrian Government sector can further support the transport and logistics companies in improving environmental management to promote their sustainable performances. In Maas, Schuster, and Hartmann (Citation2014), they posited that the moderating role of environmental communication on the pollution-prevention-differentiation and the service-stewardship-differentiation linkages based on natural resource thinking. Dobler, Lajili, and Zéghal (Citation2014), furthermore paid attention on the nexus between environment performance and environment risk. Their study based on the UK non-financial industries and found that environmental performance, risk and the likelihood of risk management all differ across firms and industries. Choi, Chiu, and Chan (Citation2016) then discussed the risk management of logistics.
Moreover, Yuen and Thai (Citation2017) discussed the difference the performance of product and service supply chain. And, Zaid, Syaefuddin, and Halim (Citation2017) developed the value chain model to increase the sustainable value added in cocoa oil industry in North Kolaka Regency of Southeast Sulawesi Province, Indonesia. In their model, the need of the marketing chain is an important part. It also needs a well-functional logistic channel to distribute the cocoa oil products. As the openness of international trade, logistic industry is threatened by many types of uncertainties, such as terrorist attacks, major infectious diseases, oil crisis, and financial turmoil. As shown in Ko and Liu (Citation2017), all the kinds of those threats will affect the sustainability of logistic industry and have some effects on the company’s performances.
On the other hand, as shown in Hsiao (Citation2015), global economic growth and cross-border investment in production can also promote the development of the global supply chain for the logistics industry to generate better interests. Furthermore, the e-shopping also grows rapidly in the recent years. In 2008, the revenues of Chinese logistic industry were about 5.545 trillion yuan (779 billion USD), increased by 16% of 2007. And the total value reached to 89.9 trillion yuan (12.84 trillion USD), increased by 19.5% of last year. The total cargo volumes passed 24 billion tons and the total cargo turnovers to 10.3 trillion ton-kilometers. As reported by the CNN Money news, from 2013 to 2016, the sales online in the Singles Day (11 November) summed up 8, 84, 135, and 278 billion USD on the China e-shopping platforms, respectively. On the other hand, it combined only 3 billion USD sold in the US for Black Friday and Cyber Monday, according to the Boston Consulting Group.
As discussed in Cogent Analytics (Citation2017),Footnote1 there are three important issues should be considered in the transportation and logistics industry: economic outlook, the need for labor, and technology innovation and data analyzing.Footnote2 Here, we are concern on the allocation of labor and station and try to give some microeconomic meanings for it by analyzing the operating data of the logistics company. There are many studies to investigate the factors that affect logistics performance, however, it is lack of micro-economic analysis in station or hub level of logistics. Therefore, our study also tries to fill the gap for discussing the logistics operating performance in economic perspective with location advantage. Moreover, this paper is the first study to address the performance persistent property of logistic business stations.
The structure of this paper is as follows. Following the introduction, Section 2 is the literature review. Methodology is in Section 3. Section 4 deals with the empirical data and descriptive statistics. The empirical analysis is also in the Section 4. And then concluding remarks are given in the Section 5.
2. Literature review
2.1. Location advantage and decision of hubs
The decision of business stations or hubs is an important strategy for supply chain companies. Since it will affect not only the cost of land, inventory, and labor, but also the difficulty of transport and time of delivery. In Taniguchi, Noritake, Yamada, and Izumitani (Citation1999), they adopt queuing theory and nonlinear programming techniques to find the optimal solution in determining the size and location of public logistics terminals. Shang and Marlow (Citation2007) pointed out that logistics and supply chain management has been elevated to a strategic level whereby firms can simultaneously achieve differentiation and low cost for sustained competitive advantages. They have revealed that logistics performance was positively associated with financial performance. Their findings also implied that logistics competency has an indirect effect on financial performance through logistics performance. Giannakis (Citation2007) tried to establish an analytical and innovative model for assessing the performance of supplier relationships (SRs). His model can be utilized with qualitative as well as quantitative data. Blankley (Citation2008) discussed the nexus between supply chain management technologies (SCMT) and financial performances. He found that the financial performance benefits can be promoted by the investment in supply chain management technology. To this end, he suggested a model to evaluate it.
Moreover, Lee and Lee (Citation2011) examined the comparative corporate performance of logistics companies in Korea, China, and Japan using Data Envelop Analysis (DEA). Their prary results regarding corporate efficiency among Korean, Chinese, and Japanese logistic companies are as follows: in the multimodal industries, Japanese firms have revealed the highest level of efficiency, with Korean firms coming in second and Chinese firms ranking third with distinctly inferior performance. On the other hand, Park, Min, and Park (Citation2011) further indicate that relationship with partners has more effect on logistics security accomplishment than sharing of logistic information. Just as relationship between corporations in chain of supply and sharing of information among them are important elements in management of supply chain, the relationship with partners and sharing of logistic information will have positive effect on supply chain security accomplishment and raise its effectiveness.
Secondly, some studies have discussed the location advantages of business station.Footnote3 Murray (Citation2009) said that location theory is the basis for examining how and why the arrangement of cities and markets has come to be and provides the rationale for siting decision-making and service allocation. Moreover, according to Li, Liu, and Chen (Citation2011) proposed that the purpose of adequate location of a logistics hub is to make products available to different markets through the best possible connections, allowing for a better use of the logistics and transportation infrastructure available.
Meanwhile, as discussed in Christopher (Citation2016), the literature about logistics are always associated with the supply chain management, logistics performance, and locations of city logistics facilities. For instance, logistics and supply chain management have been elevated to a strategic level whereby firms can simultaneously achieve differentiation and low cost for sustained competitive advantage.Footnote4 And May, Shepherd, and Sumalee (Citation2004) used the genetic algorithms (GA) to solve the choice of optimal charge location of a business station. El-Baz (Citation2011) developed an effective decision tool based on fuzzy set theory for the performance measurement of a supply chain in manufacturing companies. Besides, Bae (Citation2012) had empirically analyzed gaps in performance among development stages of integration in supply chain management (SCM).
And, Kuo (Citation2011) indicated that the decision problem of location selection should be complex with multi-criteria and multi-stage problem. Such that, as stated in Tan, Lyman, and Wisner (Citation2002), a firm with a better location management strategy will have the location advantage. Also, from the empirical results of Zhang, Kwon, and Kim (Citation2011), the strategic location of city logistics facilities may help to establish more efficient urban logistics systems, to reduce social and environmental costs of urban freight transport, and to improve urban traffic conditions. In our study, we concern the problem of selecting a location for a city logistics facility while considering linguistic factors. So, alike to Zhang et al. (Citation2011), our results are expected to help municipal government on the selection of locations for city logistics facilities and quantify the advantages and disadvantages of alternative locations.
Furthermore, there are many approaches to find the optimal location of the supply chain company. According to Zhang and Kwon (Citation2010) and Zhang et al. (Citation2011), they used a fuzzy synthetic evaluation approach to find the best location selection. And in Tolga, Tuysuz, and Kahraman (Citation2013), it was the first study that applied a fuzzy real option valuation approach for the retail location selection. Simić, Ilin, Tanackov, Svirčević, and Simić (Citation2015) implemented Analytical Hierarchy Process (AHP) and k-means method to decide the best location for logistics distribution center. Chang, Liao, Tseng, and Liao (Citation2015) also adopt an ANP-based TOPSIS approach to investigate the location selection of Taiwanese service firms. Vieira and Luna (Citation2016) used the both multi-criteria and single-criterion model to find the best hub location regarding a variety of transportation network designs. Zúñig and Martínez (Citation2016) presented the development of third-party logistics (3PL) operators in El Salvador. They concluded that Salvadoran Logistics Provider (SLP) deployed the framework of highly reliable organizations, to manage the risk and complexity of its customers’ supply chains.
Moreover, Liu et al. (Citation2016) applied an efficient location-aware analytics system (ELAN) to find optimal location services using big data analysis. Ashenbaum and Maltz (Citation2017) also develop a conceptual framework of purchasing-logistic integration (PLI) which will be useful and help to promote the performance of suppliers. Jazairy, Lenhardt, and Haartman (Citation2017), Li and Bathelt (Citation2017) investigated the location strategies of Canadian and Chinese MNCs in international and domestic investment decisions at the metropolitan level. And, Dobler et al. (Citation2014), Maas et al. (Citation2014), Ko and Liu (Citation2017) investigated the environmental strategy for SMEs to keep sustainable competitive advantages.
However, as to now, there is no academically economic analysis of logistics researches for this issue. It is very important to the managers and decision-makers of logistic firms to allocate the labor and cargos in a suitable position to reduce its operating cost or to generate more profit. As a result, our study will try to fill the gap for discussing the logistics performance in economic perspective with location advantage by testing the following hypothesis:
H0: The business stations located near metropolitan area have advantages
2.2. Persistence of performance
Gunasekaran, Patel, and McGaughey (Citation2004) indicated that supply chain management has been a major component of competitive strategy to enhance organizational productivity and profitability. They adopt a series of performance metrics to measure the British supply chain company’s performances. And, Angerhofer and Angelides (Citation2006) showed that a decision-supporting environment may improve the performances of a collaborative supply chain. In Bhagwat and Sharma (Citation2007) first developed a balance scorecard approach for the supply chain performance management. It helps managers to evaluate SCM performance in a much-balanced way from all aspects of business. Carter and Rogers (Citation2008) surveyed the literature for the sustainability management of supply chain and then developed a new theoretical framework to investigate sustainable performance management. On the other hand, Cho, Lee, Ahn, and Hwang (Citation2012) investigated the factors having impact on the operating performance of the service supply chain companies. According to their work, we focus on the operating performances using the reception per worker and per cargo, respectively. Under this assumption, we find an interesting phenomenon: a well-performed station will be good in the following period. It is called the “Hot-Hand Effect,” which refers to the tendency for people to expect streaks in sports performance to continue. Gilovich, Vallone, and Tversky (Citation1985) said that many sports fans, commentators, players, and even coaches share a belief that a particular player might have the hot hand in some period of time. Moreover, Johnson, Tellis, and Macinnis (Citation2005) discussed the effect of hot/cold hand and the gambler’s fallacy on the stock markets. And Stöckl, Huber, Kirchler, and Lindner (Citation2015) use experimental approach to discuss the hot hand effect. In the laboratory experiments, they showed that communication and group decision-making do not impact subjects’ overall proneness to the hot hand fallacy and to the gambler’s fallacy.
In finance, Jegadeesh and Titman (Citation1993) first documented that strategies which buy stocks that have performed well in the past and sell stocks that have performed poorly in the past generate significant positive returns over 3- to 12-month holding periods. And, Hendricks, Patel, and Zeckhauser (Citation1993) studied the hot hand effect on mutual funds. They found that the performance of mutual funds persists for short term, which is different to the findings of Grinblatt and Titman (Citation1989), persistence in mutual fund returns over five-year period. Hereafter, Carhart (Citation1997) used the “Winners” and “Losers” to stand for well-performed and poor-performed group, respectively. His great work found that hot hand effect is driven by the momentum effect. Moreover, Islam (Citation2014) presented the financial performance persistence of banks in Bangladesh. Fu and Liu (Citation2017) investigated the persistence timing of mutual funds and the ability of timing.
In the field of accounting, the earnings persistence is also an unsolvable anomaly. Sloan (Citation1996) found that firm’s earnings in the annual report will persist in the following year. There are many studiesFootnote5 extended the results of Sloan (Citation1996) and then indicate that the relation between past earnings volatility and earnings persistence is robust to the additional controls and to a correction for sampling bias, but that earnings volatility does not predict stock returns.
In the management viewpoint, Bocken, Rana, and Short (Citation2015) indicated that different managers of the business station may have different management goals, such as operating model, marketing strategies, and so on. The performance of the business station will be depended on the abilities of its manager. Hence, the CEO in the headquarter wants to know why a poor-performed station is always performing worse and how to improve it. Therefore, this paper is the first study to address the performance persistent property of logistic business stations by testing the following hypothesis:
H0: The performance will persist, that is, there is a momentum effect of performances
3. Methodologies
3.1. Comparative tests
Here, we will compare the average performance of each comparative group to distinguish their difference. We may use the comparative tests suggested by Lee and Lee (Citation2011) to compare the difference of between two or more groups, such as, north versus south, metropolitan versus urban, and Winners vs. Losers, etc. Lee and Lee (Citation2011) compared the financial performance of the logistic companies in Korea, Japan, and China. They found that the logistic companies in China are the highest growth than that of Korea and Japan, but the worst efficiency. Kumari and Priya (Citation2017) investigated the factors that affect the managerial employees’ commitment to the bank performance using comparative analysis of the 633 managers of banking sector located in Uttar Pradesh, the most populous state in the Republic of India. Using the statistical testing hypothesis, we may find the performances between groups whether significantly different, or not.
3.2. Multivariate regression models
Beside the comparative tests, we also adopt the multivariate regression analysis to study these issues. Differently, the comparative tests can only find the difference between two groups, but the multivariate regression analysis will reveal the reasons of the existence of the difference. To investigate the difference, we will imbed some explanatory variables to the multivariate regression model. We can classify the data into some groups using some categorical variables (dummy), Location.
Moreover, the size of the station is also an important factor for generating revenues. As the discussion in Ho, Wang, and Shieh (Citation2016), they classified the Taiwanese electronics firms into three categories by the firm’s size. Here, we use the number of workers and cargos, respectively, to proxy the station’s size. The more the workers or cargos, the larger the station’s size. And as discussion in Yogi (Citation2015), the operating performance of logistic firm is also affected by their business model: delivery business or receiving business. Such that, the revenue generated by their business should also be considered.
The relationship of the company’s performance and explanatory variables can be given as follows:(1)
(1)
where yt is the operational performance of the company in the tth month, i.e. the revenue per item and revenue per package, respectively. And Xt is the control variable.
Our results of the multivariate regression analysis are reasonable and fruitful. In the results of multivariate regression analysis, we may find the factors that affect the performance of the firm; we also can evaluate the magnitude of each factor to the firm’s performance. And by the dummy variables, we can compare the difference between the groups, difference of performance or the composition of performance.
4. Empirical analysis
4.1. Data and its descriptive statistics
Our empirical data are collected from CF Express Co., Ltd., an affiliated company of Taiwan well-known and branded logistics company. It was established at 1954/12/21 and was a pure domestic logistic company in Taiwan before 2008/11/21. After that, it becomes a member of the international group in Malaysia. Its IPO on Taiwan Security Exchange was at 1990/12/20.
The CF Express was established at 1984/12/20 and its service packages include international express services encompassing Taiwan, China, and Hong Kong, domestic same-day delivery, air express to and from Penghu and Kinmen, payment acceptance, and intra-urban express service. We collect the CF Express’s monthly performance data from April 2010 to April 2014. There are 49 months data and 2672 station-months data. All the summary statistics are listed in the Table .
Table 1. The summary statistics of monthly data
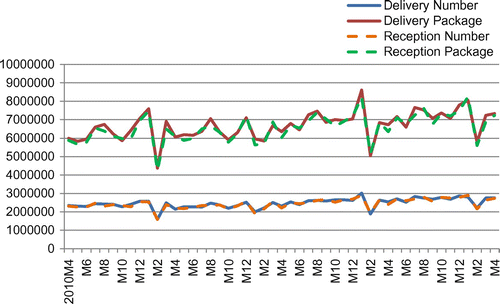
As shown in Table , we may find that the patterns of delivery services are similar to that of the reception services. The value of each delivery service is almost equal to that of corresponding reception service. Moreover, in the Figure (A) and (B), the delivery service and reception service have a growth in January and September, but a rainfall in February.
Figure 1(A). Monthly total weight and total revenue generated by delivery and reception services.
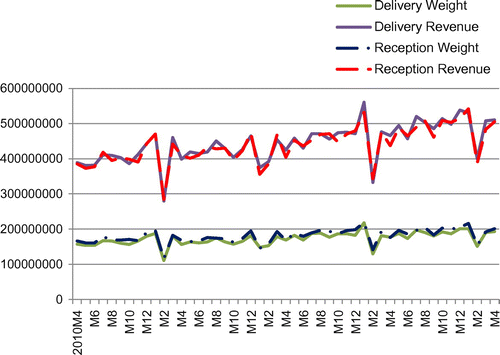
Figure 1(B). Monthly total number and total package of delivery and reception services.
Traditionally, the Chinese New Year holiday is usually at the end of January to early of February. Traditionally, the Chinese will purchase new products or buy gifts for their friends before the Chinese New Year Eve. Moreover, every company will hold a year-end feast and a lucky-draw to all stuffs. Such that, it can be observed the growth of delivery and reception services and then increase its operating performance. After the New Year holiday, consumer spending fell sharply, and the volume of delivery and reception inclined, therefore, resulting in the company’s operating performance decreased.
In addition, the pattern of the delivery service and reception service is similar in Figure (A) and (B). It coincides with the results of Table .
4.2. Comparative tests
Here, we want to investigate the station’s performances will vary depending on the business location. As the discussion in Shukla, Sharma, and Thumar (Citation2016), a partnership will be a helpful relationship to promote the development quality agriculture and infrastructure. Such that, the higher the quality of infrastructure, the more the agribusiness development. It should be the same in the logistic industry.
4.2.1. Performances persistence
According to Gorane and Kant (Citation2017), they used operational performance, customer satisfaction, and financial performance to be the proxies of supply chain organization performance. To investigate the performance persistency, we sort the values per cargo and per worker, respectively. Next, we find the top-10 stations to form the “Winners” and the bottom-10 stations to form the “Losers.” Observing the three-year data (six half-year data), we can find the change of the composition of each group. Figure (A) and (B) show the average values of “Winners” and “Losers.” The average workers and cargos in the winners group (solid lines) are flatter than that in the losers group (dashed lines). There is a rainfall of “Losers” in the 2012. It might be a lay-off of employees in 2012 result from the China’s economic growth slow. The revenues from delivery services and reception services also decline in the same period. However, the company recruited number of employees and purchased cargos in the next year. So the value created by the cargo increased in 2013.
Figure 2(A). Average workers and cargos in “Winners” and “Losers,” respectively.
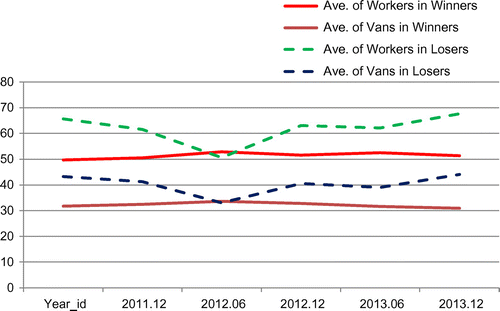
Figure 2(B). Average value per worker and per cargo in “Winners” and “Losers,” respectively.
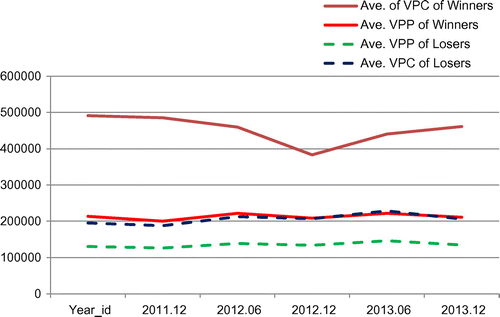
On the other hand, as shown in Figure (B), the pattern of average values created by the cargo (VPC) and values created by the worker (VPP) are different in the two groups (solid lines for the “Winners” and dash lines for the “Losers”). It is obvious that the average values created by the cargo and values created by the worker of the “Winners” are higher than that of the “Losers,” respectively. Hence, we can test the following hypothesis to investigate the property of performance persistence:
Hypothesis I (A): The winners are still well-performed
Hypothesis I (B): The losers are still poor-performed
According to the Table , we may find the hypothesis I(A) is significant at 5% level. That is, a station which is good performance will be still well performed in the following half-year. In our sample, we may observe that the higher the efficiency of the working environment, the higher the station’s performance, such as the Airport Office Station and Linkou Station. They are located nearby the Taiwan Taoyuan International Airport and the highway. Also, the company incurs more robots in these two stations to promote efficiency.
Table 2. The “Winners” of station’s semi-annual performance
On the other hand, as shown in the Table , we may also find the hypothesis I(B) is significant at 10% level using the two-sample Kolmogorov–Smirnov tests. That is, a station which is worse performance will be still unperformed in the following half-year. This result is coincide with Wang, Gunasekaran, Ngai, and Papadopoulos (Citation2016), Rahman, Esmailpour, and Zhao (Citation2016). In our sample, there are two types of “Loser.” One is located in the area with lower development of infrastructure, such as the Puli, Kingman, and Penghu three stations. The lower the development of infrastructure, the lower the station’s performance. Although these business stations are either located in the outlying islands or remote mountainous areas, where may have lower cost of land or labor, but it does not have sufficient population concentration, so that cannot generate more revenue.
Table 3. The “Losers” of station’s semi-annual performance
Second, the stations are located in the metropolitan areas, for instant, Songshan, Zhonghe, Xindian, Sanchong, and Taichung 5 stations. Geometrically, these five stations are located in the Taipei City, New Taipei City, and Taichung City, respectively, where are the metropolitan areas in Taiwan. It is an interesting result: they are located in the convenient, population concentrated, and infrastructure high-developed areas, while they are poor performed. This result is different to the prior studies. There are several reasons should be considered: costly land, heavy traffic problem, and lined alleys. Although the higher the density of the population can generate more receptions, however, the city’s business station premises of the high rent, high housing tax, high land value-added tax, etc., which will erode its income. Therefore, it cannot be out of the performance of backwardness. And the narrow lanes and heavy traffic in the metropolitan areas will increase the inconvenience of transporting goods, and the possibility of accident in the delivering process. Such that it should result in increasing the delivery time and cost. All that will erode its revenue and make the station performed worse.
Consequently, the policy-makers can provide incentives to improve the working environment and then promote station’s performance. They can provide the logistics industry to set up the stations in the vicinity of the metropolitan areas by improving the infrastructure, modifying the land use policies, setting the supply chain areas, tax incentives. As the results in Rivera, Gligor, and Sheffi (Citation2016), the logistics clustering will generating several aspects of benefit, such as, collaboration-related benefits, offering of value-added services, career mobility for the logistics workforce within the cluster, and promotes job growth at multiple levels within the cluster. Furthermore, as the implications of Ajamieh, Benitez, Braojos, and Gelhard (Citation2016), they can introduce green energy vehicles and IT industry and the robots to replace the manpower for reducing company’s personnel costs, can make the logistics industry more vigorous development and create economic prosperity.
4.2.2. Tests for location advantages
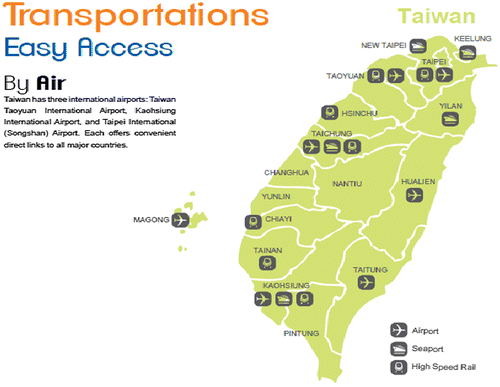
In general, the metropolitan areas, such as Taipei, New Taipei, Taoyuan, Taichung, and Kaohsiung, most of them are located in the north area of Taiwan and are closed to the capital of Taiwan, except Kaohsiung City. They all have a higher quality of transportation infrastructure than the other cities in Taiwan, such as Expressway Network, High Speed Railway, and MRT system, etc. Besides that, there are higher house prices and living standard in metropolitan, thereby the costs of living are more expensive and has a higher land tax in metropolitan. So the business stations in the area will incur a higher operating cost. In addition, traffic in the metropolitan area is also higher, it will affect the traffic when the drivers either load or unload the bulk of goods, which may also cause cargo damage or traffic accidences. According to Ghoseiri, Szidarovszky, and Asgharpour (Citation2004), they defined three major problem levels of the station decision: (1) long-run strategic for 5–20 years; (2) a midterm tactical for 1–5 years, and (3) short-term operational up to only one year. And in Repolho, Church, and Antunes (Citation2016), they applied a mixed-integer linear programming approach to solve the station location problem under the three different levels. Since the station location decision is not only a compete strategy, but also affects to the operation performance of each business station and so to the whole enterprise (Figure ).
Figure 3. Transportation convenience map of Taiwan.
According to the above discussion, we found that the performance of each station has different patterns. There may be some difference of performance in north, central, and south area of Taiwan. Hence, we will test the following sub-hypothesis:
Hypothesis II (A): The performances of south station are higher than that of north station
Hypothesis II (B): The performances of metropolitan station are higher than that of non-metropolitan station
4.3. Empirical regression results
Next, we adopt the multivariate regression models to find the factors that affect the station’s performance. Consider the following regression model:(2)
(2)
where, y is the operational performance of i station in t month, here, revenue per number and revenue per package, respectively. X is the explanatory variables vector, i.e.(3)
(3)
Here, VPP and VPC are the value created by worker and by cargo, respectively; SIZE is the size of each station, the number of employees and cargos. And the Area_id is a dummy variable that the station locates in which area. We categorize the data into two categories, one is 3-zone dummy (0 for north, 1 for central, and 2 for south and east of Taiwan), and the others are 8-distinct, ranging from 1 (north) to 8 (south and east of Taiwan). Fee is the delivery revenue (Feed) or reception revenue (Feer). In this study, we take logarithmic value of the revenues to avoid the scale effect and eliminate the multicollinearity.
The fruitful regression results are shown in Tables and . In the Table , we may find that the revenue per number is increasing as cargo increases, but decreasing as the employee increases.
Table 4. Regression results of the monthly revenue per number regressing on the explanatory variables
Table 5. Regression results of the monthly revenue per package regressing on the explanatory variables
Table , although the revenue per package is increasing as cargo and employee increase, but employee is partially insignificant. Such that, increasing of the station size is not necessary to increase the revenue. Moreover, the revenue per number and revenue per package are positively correlated to the location of the station.
Moreover, we find that the more southern the stations, the more revenues they generate. These results are consistent to the results using the comparative tests. In the southern of Taiwan, there are more agricultural areas rather than industrial areas. And, it is very inconvenient in public transportation system in the urban of southern of Taiwan. Such that, the farmers can only transport their own crops to the nearest township agricultural marketing cooperatives by themselves. As the long-distance delivery, they have to rely on the logistic firms. Thus, the drivers will have advantages that they knew where the farmers are and how the quality of crops by chatting with the farmers. Such that, the station’s manager may ask their drivers to contact with the farmers and to do the delivery business for generating more profit. It coincides with the suggestions in Kantanen, Julkunen, Hiltunen, and Nickell (Citation2017). Moreover, these results are also strong evidence of location advantage for the business stations which supports the discussion of Hernández and Pedersen (Citation2017)
5. Concluding remarks
With globalization, international trade transactions increasingly warm. And the goal of supply chain management is to link the marketplace, the distribution network, the manufacturing process, and the procurement activity in such a way that customers are serviced at higher levels and at a lower total cost. The logistics plays an important role to the multinational enterprises. Our study handy collected the monthly performances from the CF Express Co., Ltd. It is a well-known and branded logistic company in Taiwan.
Our findings are fruitful. Generally, the purchasing power in the metropolitan area should be higher than the non-metropolitan areas. Infrastructure and transport facilities in the metropolitan area are more hi-tech than that of the non-metropolitan areas. Hence, the performances of the urban stations are thought to be higher than the performances of the non-metropolitan stations. However, as shown in Table , the results are precisely the opposite of this idea. We find that, in Taiwan, the higher the urbanization, the more the convenient traffic, the lower the performance of its business stations. It was consistent to the results in Cepolina and Farina (Citation2015).
On the other hand, we find an interesting result that the persistence of the station’s performance. As the discussion in finance and accounting, applying the Kolmogorov–Smirnov tests, our result (Tables and ) shows that the well-performed stations (Winner) will still have a better performance in the following period; the poor-performed stations (Loser) will stay in the worst group. Analyzing the size of each station, we find that the more compact operating station, its contribution to the company’s performance higher. Although the larger size stations will generate higher reception, yet, its huge labor costs and maintenance cost of vehicles will erode the revenue. This result coincides to the conclusion of Lam and Bai (Citation2016). Such that, the executives responds to various business station for proper planning to strike a more effective operation and performance.
Our empirical results can also be extended to the logistic companies in the emerging markets and transition economies. In addition to providing logistics professionals in the effective management of performance, and can give the government policy-makers in the industry promotion a substantive planning direction. Policy-makers can provide the logistics industry to set up the stations in the vicinity of the metropolitan areas by improving the infrastructure, modifying the land use policies, setting the supply chain areas, tax incentives. Furthermore, they can introduce the IT industry and the robots to replace the manpower for reducing company’s personnel costs. And in the future, as stated in Rahman et al. (Citation2016), the logistics companies may incur machine learning with big data to find more effective stations location and to improve their services performance, can make the logistics industry more vigorous development and create economic prosperity.
Funding
The authors received no direct funding for this research.
Additional information
Notes on contributors
Chiu-Ming Hsiao
Hsiao Chiu-Ming, is a lecturer of Department of Finance in College of Management, Taiwan National Yunlin University of Science and Technology. Hsiao is also a PhD candidate at the Graduate Institute of Finance in Taiwan National Chung Cheng University.
Lai Pin-Reuy
Lai Pin-Reuy, is a PhD student at the Department of Economics of Taiwan National Chung Cheng University. Lai is the Vice General Manager of the CF Express Co., Ltd.
Sun Li-Yun
Sun, Li-Yun and Tsai, Yun-Jean are master graduated from the Department of Economics of Taiwan National Chung Cheng University and employed by CF Express Co., Ltd. They collect the data, handy.
Our team is a combination of academic research and professional practice, and has been studied together for four years. In the research topics, we are more interested in the logistics and distribution-related topics. Hope both theory and practice, complement each other.
Notes
1. See the website is https://www.cogentanalytics.com/3-hot-topics-transportation-logistics-industry/ on 2017/07/25.
2. See Gunasekaran, Subramanian, and Papadopoulos (Citation2017). They investigated the competitive advantages of logistics by implementing the information technology (IT).
3. See the discussion in Church and Murray (Citation2009), Homer (Citation2009), Murray (Citation2009) and Chapman (Citation2009).
4. See Shang and Marlow (Citation2007), Ahn, Ishii, and Ahn (Citation2013), and Seo, Dinwoodie, and Roe (Citation2016).
5. As discussed in Richardson, Sloan, Soliman, and Tuna (Citation2005), Dichev and Tang (Citation2009), Frankel and Litov (Citation2009), and Chen, Folsom, Paek, and Sami (Citation2014).
6. More discussion and applications can be found in Daniel (Citation1990).
References
- Ahn, W. C., Ishii, S., & Ahn, S. B. (2013). A comparative study of Korean and Japanese logistics industries’ market structures: Focusing on subsidiary and third-party logistics companies. The Asian Journal of Shipping and Logistics, 29(3), 361–376. doi:10.1016/j.ajsl.2013.12.004
- Ajamieh, A., Benitez, J., Braojos, J., & Gelhard, C. (2016). IT infrastructure and competitive aggressiveness in explaining and predicting performance. Journal of Business Research, 69(10), 4667–4674. doi:10.1016/j.jbusres.2016.03.056
- Al-Najjar, B., & Anfimiadou, A. (2012). Environmental policies and firm value. Business Strategy and the Environment, 21(1), 49–59. doi:10.1002/bse.713
- Angerhofer, B. J., & Angelides, M. C. (2006). A model and a performance measurement system for collaborative supply chains. Decision Support Systems, 42(1), 283–301. doi:10.1016/j.dss.2004.12.005
- Antràs, P., & Chor, D. (2013). Organizing the global value chain. Econometrica, 81(6), 2127–2204. doi:10.3982/ECTA10813
- Ashenbaum, B., & Maltz, A. (2017). Purchasing-logistics integration and supplier performance: An information-processing view. The International Journal of Logistics Management, 28(2), 379–397. doi:10.1108/IJLM-07-2014-0113
- Bae, H. S. (2012). An analysis of gaps in performance among development stages of integration in SCM. Journal of International Logistics and Trade, 10(3), 85–104.
- Bhagwat, R., & Sharma, M. K. (2007). Performance measurement of supply chain management: A balanced scorecard approach. Computers & Industrial Engineering, 53(1), 43–62. doi:10.1016/j.cie.2007.04.001
- Blankley, A. (2008). A conceptual model for evaluating the financial impact of supply chain management technology investments. The International Journal of Logistics Management, 19(2), 155–182. doi:10.1108/09574090810895942
- Bocken, N. M. P., Rana, P., & Short, S. W. (2015). Value mapping for sustainable business thinking. Journal of Industrial and Production Engineering, 32(1), 67–81. doi:10.1080/21681015.2014.1000399
- Carhart, M. M. (1997). On persistence in mutual fund performance. The Journal of Finance, 52(1), 57–82. doi:10.1111/j.1540-6261.1997.tb03808.x
- Carter, C. R., & Rogers, D. S. (2008). A framework of sustainable supply chain management: Moving toward new theory. International Journal of Physical Distribution & Logistics Management, 38(5), 360–387. doi:10.1108/09600030810882816
- Cepolina, E. M., & Farina, A. (2015). A new urban freight distribution scheme and an optimization methodology for reducing its overall cost. European Transport Research Review, 7(1), 20–30. doi:10.1007/s12544-014-0149-x
- Chang, K. L., Liao, S. K., Tseng, T. W., & Liao, C. Y. (2015). An ANP based TOPSIS approach for Taiwanese service apartment location selection. Asia Pacific Management Review, 20(2), 49–55. doi:10.1016/j.apmrv.2014.12.007
- Chapman, K. (2009). Industrial location. International Encyclopedia of Human Geography, 396–401, doi:10.1016/B978-008044910-4.00174-7
- Chen, H. Z., Anselmi, K., Falasca, M., & Tian, Y. (2017). Measuring returns management orientation. The International Journal of Logistics Management, 28(2), 251–265. doi:10.1108/IJLM-06-2015-0095
- Chen, L. H., Folsom, D. M., Paek, W. D., & Sami, H. (2014). Accounting conservatism, earnings persistence, and pricing multiples on earnings. Accounting Horizons, 28(2), 233–260. doi:10.2308/acch-50664
- Cho, D. W., Lee, Y. H., Ahn, S. H., & Hwang, M. K. (2012). A framework for measuring the performance of service supply chain management. Computers & Industrial Engineering, 62(3), 801–818. doi:10.1016/j.cie.2011.11.014
- Choi, T. M., Chiu, C. H., & Chan, H. K. (2016). Risk management of logistics systems. Transportation Research Part E: Logistics and Transportation Review, 90, 1–6. doi:10.1016/j.tre.2016.03.007
- Christopher, M. (2016). Logistics and supply chain management. Financial Times/Pearson Education (Chapter 5, 5th ed.). ISBN-10: 978-1-08379-7.
- Church, R. L., & Murray, A. T. (2009). Business site selection, location analysis and GIS (pp. 259–280). John Wiley & Sons, Inc., ISBN-13: 978-0470191064.
- Cogent Analytics. (2017). 3 Hot topics in the transportation and logistics industry. Retrieved July 25, 2017, from https://www.cogentanalytics.com/3-hot-topics-transportation-logistics-industry/
- Daniel, W. W. (1990). Applied nonparametric statistics. Section 8.2 Kolmogorov–Smirnov one-sample test (2nd ed., pp. 319–330). Boston, MA: PWS-Kent. ISBN 0-534-91976-6.
- Derwik, P., Hellström, D., & Karlsson, S. (2016). Manager competences in logistics and supply chain practice. Journal of Business Research, 69(11), 4820–4825. doi:10.1016/j.jbusres.2016.04.037
- Dichev, I. D., & Tang, V. W. (2009). Earnings volatility and earnings predictability. Journal of Accounting and Economics, 47(2), 160–181. doi:10.1016/j.jacceco.2008.09.005
- Dobler, M., Lajili, K., & Zéghal, D. (2014). Environmental performance, environmental risk and risk management. Business Strategy and the Environment, 23(1), 1–17. doi:10.1002/bse.1754
- El-Baz, M. A. (2011). Fuzzy performance measurement of a supply chain in manufacturing companies. Expert Systems with Applications, 38(6), 6681–6688. doi:10.1016/j.eswa.2010.11.067
- Frankel, R., & Litov, L. (2009). Earnings persistence. Journal of Accounting and Economics, 47(2), 182–190. doi:10.1016/j.jacceco.2008.11.008
- Fu, Y. F., & Liu, H. C. (2017). The performance persistence of winner fund managers – evidence from the timing and stock picking ability. Asian Economic and Financial Review, 7(6), 611–622. doi:10.18488/journal.aefr.2017.76.611.622
- Ghoseiri, K., Szidarovszky, F., & Asgharpour, M. J. (2004). A multi-objective train scheduling model and solution. Transportation Research Part B: Methodological, 38(10), 927–952. doi:10.1016/j.trb.2004.02.004
- Giannakis, M. (2007). Performance measurement of supplier relationships. Supply Chain Management: An International Journal, 12(6), 400–411. doi:10.1108/13598540710826335
- Gilovich, T., Vallone, R., & Tversky, A. (1985). The hot hand in basketball: On the misperception of random sequences. Cognitive Psychology, 17(3), 295–314. doi:10.1016/0010-0285(85)90010-6
- Gorane, S., & Kant, R. (2017). Supply chain practices and organizational performance: An empirical investigation of Indian manufacturing organizations. The International Journal of Logistics Management, 28(1), 75–101. doi:10.1108/IJLM-06-2015-0090
- Grinblatt, M., & Titman, S. (1989). Mutual fund performance: An analysis of quarterly portfolio holdings. The Journal of Business, 62(3), 393–416. doi:10.1086/296468
- Gunasekaran, A., Patel, C., & McGaughey, R. E. (2004). A framework for supply chain performance measurement. International Journal of Production Economics, 87(3), 333–347. doi:10.1016/j.ijpe.2003.08.003
- Gunasekaran, A., Subramanian, N., & Papadopoulos, T. (2017). Information technology for competitive advantage within logistics and supply chains: A review. Transportation Research Part E: Logistics and Transportation Review, 99, 14–33. doi:10.1016/j.tre.2016.12.008
- Hendricks, D., Patel, J., & Zeckhauser, R. (1993). Hot hands in mutual funds: Short-run persistence of relative performance, 1974–1988. The Journal of Finance, 48(1), 93–130. doi:10.1111/j.1540-6261.1993.tb04703.x
- Hernández, V., & Pedersen, T. (2017). Global value chain configuration: A review and research agenda. Business Research Quarterly (BRQ), 20(2), 137–150. doi:10.1016/j.brq.2016.11.001
- Ho, Y. C., Wang, W. B., & Shieh, W. L. (2016). An empirical study of green management and performance in Taiwanese electronics firms. Cogent Business & Management, 3(1), 1266787. doi:10.1080/23311975.2016.1266787
- Homer, M. W. (2009). Location analysis. International encyclopedia of human geography, 263–269. doi:10.1016/B978-008044910-4.00467-3
- Hsiao, C. M. (2015). The asymmetry effect of different conditions of economic growth and logistic expansion on the financial performance of the taiwanese logistic industry. International Conference on Business and Social Sciences (ICBASS), Osaka, Japan, Paper No. 7374.
- Islam, M. A. (2014). An analysis of the financial performance of national bank limited using financial ratio. Journal of Behavioural Economics, Finance, Entrepreneurship, Accounting and Transport, 2(5), 121–129. doi:10.12691/jbe-2-5-3
- Jazairy, A., Lenhardt, J., & Haartman, R. V. (2017). Improving logistics performance in cross-border 3PL relationships. International Journal of Logistics Research and Applications, 20, 1–23. doi:10.1080/13675567.2017.1306036
- Jegadeesh, N., & Titman, S. (1993). Returns to buying winners and selling losers: Implications for stock market efficiency. The Journal of Finance, 48(1), 65–91. doi:10.1111/j.1540-6261.1993.tb04702.x
- Johnson, J., Tellis, G. J., & Macinnis, D. J. (2005). Losers, winners, and biased trades. Journal of Consumer Research, 32(2), 324–329. doi:10.1086/432241
- Grushevska, K., & Notteboom, T. (2014). An economic and institutional analysis of multi-port gateway regions in the Black Sea Basin. Journal of International Logistics and Trade, 12, 3–35.10.24006/jilt
- Kantanen, T., Julkunen, S., Hiltunen, E., & Nickell, D. (2017). Creating employees’ motivational paths in the retail trade. Cogent Business & Management, 4(1), 1389332. doi:10.1080/23311975.2017.1389332
- Ko, W. W., & Liu, G. (2017). Environmental strategy and competitive advantage: The role of small- and medium-sized enterprises’ dynamic capabilities. Business Strategy and the Environment, 26(5), 584–596. doi:10.1002/bse.1938
- Kumari, P., & Priya, B. (2017). Organizational commitment: A comparative study of public and private sector bank managers. International Journal of Business and Management Invention, 6(1), 38–47.
- Kuo, M. S. (2011). Optimal location selection for an international distribution center by using a new hybrid method. Expert Systems with Applications, 38(6), 7208–7221. doi:10.1016/j.eswa.2010.12.002
- Lam, J. S. L., & Bai, X. W. (2016). A quality function deployment approach to improve maritime supply chain resilience. Transportation Research Part E: Logistics and Transportation Review, 92, 16–27. doi:10.1016/j.tre.2016.01.012
- Lee, J. Y., & Lee, M. H. (2011). Comparative analysis of competitiveness of logistics companies in Korea, Japan and China. Journal of International Logistics and Trade, 9(1), 27–42.
- Li, P. F., & Bathelt, H. (2017). Location strategy in cluster networks. Journal of International Business Studies, Forthcoming, 1–23, doi:10.1057/s41267-017-0088-6
- Li, Y., Liu, X., & Chen, Y. (2011). Selection of logistics center location using Axiomatic Fuzzy Set and TOPSIS methodology in logistics management. Expert Systems with Applications, 38(6), 7901–7908. doi:10.1016/j.eswa.2010.12.161
- Liu, X. B., Yang, J., Qu, S. X., Wang, L. N., Shishime, T., & Bao, C. K. (2012). Sustainable production: Practices and determinant factors of green supply chain management of Chinese companies. Business Strategy and the Environment, 21(1), 1–16. doi:10.1002/bse.705
- Liu, Y. X., Wang, H. N., Li, G. L., Gao, J. Y., Hu, H. Q., & Li, W. S. (2016). ELAN: An efficient location-aware analytics system. Big Data Research, 5, 16–21. doi:10.1016/j.bdr.2016.08.001
- Maas, S., Schuster, T., & Hartmann, E. (2014). Pollution prevention and service stewardship strategies in the third-party logistics industry: Effects on firm differentiation and the moderating role of environmental communication. Business Strategy and the Environment, 23(1), 38–55. doi:10.1002/bse.1759
- May, A., Shepherd, S., & Sumalee, A. (2004). Optimal locations and charges for cordon schemes. Research in Transportation Economics, 9, 87–105. doi:10.1016/S0739-8859(04)09004-3
- Mentzer, J. T., DeWitt, W., Keebler, J. S., Min, S., Nix, N. W., Smith, C. D., & Zacharia, Z. G. (2002). Defining supply chain management. Journal of Business Logistics, 22(2), 1–25. doi:10.1002/j.2158-1592.2001.tb00001.x
- Min, H., & Zhou, G. G. (2002). Supply chain modeling: Past, present and future. Computers & Industrial Engineering, 43(1–2), 231–249. doi:10.1016/S0360-8352(02)00066-9
- Murray, A. T. (2009). Location theory. International Encyclopedia of Human Geography, 270–276. doi:10.1016/B978-008044910-4.00202-9
- Oberhofer, P., & Dieplinger, M. (2014). Sustainability in the transport and logistics sector: Lacking environmental measures. Business Strategy and the Environment, 23(4), 236–253. doi:10.1002/bse.1769
- Park, J. Y., Min, J. U., & Park, J. S. (2011). Analysis of causal relationship between supply chain security and its performance using balanced scorecard model. Journal of International Logistics and Trade, 9(2), 99–118.
- Rahman, M. N., Esmailpour, A., & Zhao, J. H. (2016). Machine learning with big data an efficient electricity generation forecasting system. Big Data Research, 5, 9–15. doi:10.1016/j.bdr.2016.02.002
- Repolho, H. M., Church, R. L., & Antunes, A. P. (2016). Optimizing station location and fleet composition for a high-speed rail line. Transportation Research Part E: Logistics and Transportation Review, 93, 437–452. doi:10.1016/j.tre.2016.06.006
- Richardson, S. A., Sloan, R. G., Soliman, M. T., & Tuna, I. (2005). Accrual reliability, earnings persistence and stock p rices. Journal of Accounting and Economics, 39(3), 437–485. doi:10.1016/j.jacceco.2005.04.005
- Rivera, L., Gligor, D., & Sheffi, Y. (2016). The benefits of logistics clustering. International Journal of Physical Distribution & Logistics Management, 46(3), 242–268. doi:10.1108/IJPDLM-10-2014-0243
- Shang, K. C., & Marlow, P. B. (2007). The effects of logistics competency on performance. Journal of International Logistics and Trade, 5(2), 45–66.10.24006/jilt
- Seo, Y. J., Dinwoodie, J., & Roe, M. (2016). The influence of supply chain collaboration on collaborative advantage and port performance in maritime logistics. International Journal of Logistics Research and Applications, 19(6), 562–582. doi:10.1080/13675567.2015.1135237
- Shukla, R., Sharma, S., & Thumar, V. M. (2016). Role and importance of public private partnerships in agricultural value chain and infrastructure. International Journal of Commerce and Business Management, 9(1), 113–118. doi:10.15740/HAS/IJCBM/9.1/113-118
- Simić, D., Ilin, V., Tanackov, I., Svirčević, V., & Simić, S. (2015). A hybrid analytic hierarchy process for clustering and ranking best location for logistics distribution center. Hybrid Artificial Intelligent Systems. HAIS 2015. Lecture Notes in Computer Science, 9121, 477–488. doi:10.1007/978-3-319-19644-2_40
- Sloan, R. G. (1996). Do stock prices fully reflect information in accruals and cash flinf about future earnings? The Accounting Review, 71, 289–315. doi:10.1023/A:1011662825164
- Stock, J. R. (1987). The industrial purchase decision for professional services. Journal of Business Research, 15(1), 1–16. doi:10.1016/0148-2963(87)90014-2
- Stöckl, T., Huber, J., Kirchler, M., & Lindner, F. (2015). Hot hand and gambler’s fallacy in teams: Evidence from investment experiments. Journal of Economic Behavior & Organization, 117, 327–339. doi:10.1016/j.jebo.2015.07.004
- Tan, K. C., Lyman, S. B., & Wisner, J. D. (2002). Supply chain management: A strategic perspective. International Journal of Operations & Production Management, 22(6), 614–631. doi:10.1108/01443570210427659
- Taniguchi, E., Noritake, M., Yamada, T., & Izumitani, T. (1999). Optimal size and location planning of public logistics terminals. Transportation Research Part E: Logistics and Transportation Review, 35(3), 207–222. doi:10.1016/S1366-5545(99)00009-5
- Tolga, A. C., Tuysuz, F., & Kahraman, C. (2013). A fuzzy multi-criteria decision analysis approach for retail location selection. International Journal of Information Technology & Decision Making, 12(4), 729–755. doi:10.1142/S0219622013500272
- Vieira, C. L. S., & Luna, M. M. M. (2016). Models and methods for logistics hub location: A review toward transportation networks design. Pesquisa Operacional, 36(2), 375–397. doi:10.1590/0101-7438.2016.036.02.0375
- Wang, G., Gunasekaran, A., Ngai, E. W. T., & Papadopoulos, T. (2016). Big data analytics in logistics and supply chain management: Certain investigations for research and applications. International Journal of Production Economics, 176, 98–110. doi:10.1016/j.ijpe.2016.03.014
- Yogi, K. S. (2015). Performance evaluation of reverse logistics: A case of LPG agency. Cogent Business & Management, 2(1), Article: 1063229. doi:10.1080/23311975.2015.1063229
- Yuen, K. F., & Thai, V. V. (2017). The influence of supply chain integration on operational performance: A comparison between product and service supply chains. The International Journal of Logistics Management, 28(2), 444–463. doi:10.1108/IJLM-12-2015-0241
- Zaid, S., Syaefuddin, D. T., & Lim, H. (2017). The value chain development model of the cocoa oil industry to increase sustainable value added. IOSR Journal of Business and Management, 19(7), 1–12. doi:10.9790/487X-1907020112
- Zhang, Y., & Kwon, O. K. (2010). Location decision of city logistics facility based on fuzzy synthetic evaluation. Applied Mechanics and Materials, 33, 351–355. doi:10.4028/www.scientific.net/AMM.33.351
- Zhang, Y., Kwon, O. K., & Kim, H. J. (2011). Selecting a location for a city logistics facility: A fuzzy synthetic evaluation method. Journal of International Logistics and Trade, 9(1), 115–132. Retrieved from http://worldcat.org/issn/1738212210.24006/jilt
- Zúñig, R., & Martínez, C. (2016). A third-party logistics provider: To be or not to be a highly reliable organization. Journal of Business Research, 69(10), 4435–4453. doi:10.1016/j.jbusres.2016.03.009