
Abstract
Modified Kano models, proposed by Prof. Matzler and Hinterhuber, are mostly applied to the qualitative analysis of performance indicators, but have not been used to validate the theoretical hypothesis of customer’s quantitative studies. In this study, regression analysis has been used to analyse the correlation between service quality (by SERVQUAL) and customer loyalty in car service centres, and then quality ingredients of modified Kano model have been encoded to determine whether the statistical values accorded with F-distribution and Scheffe’s post hoc analysis were used to confirm the Kano model’s possibilities in quantitative research. The results of regression analysis show that different aged customers have different views on loyalty, each factor of the SERVQUAL scale has a significant relevance on customer loyalty in the >30-year-old group. However, in the <30 group, there is no significant correlation between responsiveness and customer loyalty. The F-test results show that there are significant differences in SERVQUAL’s tangibles, reliability and empathy factors. Scheffe’s post hoc analysis shows the significance in these three factors. Therefore, this study confirms that the Kano model also can verify the hypothesis of quantitative research and test research models after summarising and encoding the quality elements of the question items contained in effective questionnaires.
Public Interest Statement
Qualitative research and quantitative analysis are common scientific research management methods. The modified Kano model is one of the most important models for qualitative research on management research and analysis of customer satisfaction in recent years. In this study, the five indicators of the modified Kano model were trying to be like Likert 1–5 points on the questionnaire, and the numerical analysis is done by the common quantification method. This study found that the modified Kano model can explain the qualitative research related to customer loyalty in automobile service factories and can get the result after using quantitative method analysis. Therefore, the modified Kano model will enable scholars to carry out relevant quantitative research and hypothesis verification in the future.
1. Introduction
For the automotive industry, a high degree of customer loyalty is particularly important because the profits from the vehicle’s long-term maintenance and repairs may be much higher than new car sales profit. Therefore, the automotive industry continues to provide innovative products and maintenance services to maintain a high level of customer satisfaction and customer loyalty (Leventhal & Zineldin, Citation2006). The Kano model is a qualitative research methodology that is often used to evaluate the automotive industry and customer satisfaction, for example, when Wolfindale, Dunne, and Walsh (Citation2012) studied the influence of the attributes of automobile noise on customer satisfaction, they found the Kano quality model could be used for improving the car’s noise sources, either from the engine or wind, and thus bring joy to the customers. However, there has been no previous research or statistical method, indicating that the Kano model could be applied to empirical research or hypothesis verification, or using AMOS mapping to calculate the fitness of structural equation modelling (SEM).
For more accurate results, this study has used the SERVQUAL service quality scales proposed by Parasuraman, Zeithaml, and Berry (Citation1985) and the customer loyalty framework proposed by Martensen, Gronholdt, and Kristensen (Citation2000), using regression to analyse the relevance of service quality to customer loyalty. This study has used the revised Kano model proposed by Matzler and Hinterhuber (Citation1998) to summarise the quality elements of customer satisfaction in different ages and how car service centres can improve customer satisfaction and customer loyalty. It has also further encoded the quality elements from the valid questionnaires, such as Likert five-point scale, and conducted Anova and Scheffe’s analysis to verify whether the Kano model can be used as a quantitative study.
2. Literature review
2.1. First-time new car buyers’ age
In addition to public transport vehicles such as buses or trains, cars are the main means of transport for commuting or transporting goods. According to the 1996–2015 data provided by JD Power & Associates (Table ), Kurz, Li, and Vine (Citation2016) found that in the United States in 2000, if customers who had purchased new cars were divided into four groups aged 16–34, 35–49, 50–54, and over 55, that of these four groups, the 16–34 and 35–49 groups were most able to purchase a new car. However, by 2015, those aged 35–49 and over 55, were the two groups in which purchasing power for new cars was relatively high. Tseng (Citation2013) argued that people aged 16–34 are often unemployed or indebted, making it impossible for those new cars to be sold, regardless of which new car attracts young people. However, there is no research report on the Asian car sales age distribution and the ability to discuss the purchasing of new cars. As a result, the authors of this study visited Nissan and Mazda car sales executives in Asia. According to their accumulated years of sales experience, 30 years old is considered the major age for first-time buyers because in the Asian region, most 20-year olds are normally driving the family’s used car. At the same time, these sales executives also confirmed that the quality of car maintenance requirements for first-time buyers is also usually higher than the requirements of old or second-hand car owners.
Table 1. Share of new cars purchased by age group
2.2. Modified Kano model with its research in the automotive industry
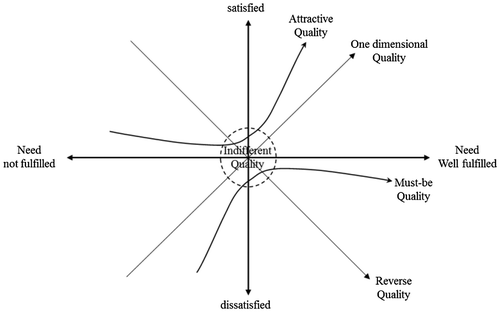
Matzler and Hinterhuber (Citation1998) modified the original Kano measuring model (Kano, Seraku, Takahashi, & Tsjui, Citation1984) and improved the evaluation scales to “I like it that way”, “It must be that way”, “I am neutral”, “I can live with it that way”, “I dislike it that way” as shown in Table . The classification of ingredients of quality would be established in terms of the statistics of answers to the sample questions to obtain different accumulated quality ingredients in which the classification utilises the ingredients with a relatively higher frequency. If there are different quality ingredients with the same frequency, the criteria for determining quality ingredients is ordered as “must-be quality” > “one-dimensional quality” > “attractive quality” > “indifferent quality” (Figure ) (Lin, Yeh, & Wang, Citation2015).
Table 2. The classification of factors by Matzler and Hinterhuber
Figure 1. Modified Kano quality model.
The purposes of automotive industry research using the Matzler and Hinterhuber’s Kano model version (Citation1998) were mainly to improve the performance of the car and then to enhance customer satisfaction. Rashid, Tamaki, Ullah, and Kubo (Citation2010) used computer systems to develop and innovate new products for cars with the Kano model, they found that the more attractive the quality of innovative items were, correlated to increased customer satisfaction with the product. Wolfindale et al. (Citation2012) studied the impact of car noise sources on customer satisfaction and found that customers had different feelings for noise with different quality attributes. They improved the noise source for each vehicle, and with that, also customer satisfaction. Dominici, Roblek, Abbate, and Tani (Citation2016) utilised this model to explore the value potential of Internet of Things (IoT) technologies in the automotive industry, and they found the “driver-friendly” technologies is attractive to drivers. Yadav, Jain, Singh, and Mishra (Citation2017) argued that the car’s exterior design attractive qualities must include family-orientated, modern, youthful and elegant.
2.3. The relationship between service quality, customer satisfaction and customer loyalty
Before 1995, the casual relationship between the quality of service, customer satisfaction and customer loyalty, scholars gave a preliminary conclusion that service quality was more important than customer satisfaction (Cronin & Taylor, Citation1992; Taylor & Baker, Citation1994) and customer satisfaction always follows the service suppliers possessing customer loyalty (Rust & Zahorik, Citation1993). Subsequent research argues that service quality is considered to be an important factor in determining customer satisfaction when it wants to improve customer satisfaction (Cronin, Brady, & Hult, Citation2000). Culiberg and Rojšek (Citation2010) considered that the service quality is the judgement of the difference between expectation and realisation of service, a customer is usually satisfied when the received service is better than expected. Thus, Zeithaml, Bitner, and Gremler (Citation2012) concluded that the perception of service quality can predict the satisfaction of a customer.
A customer’s perception of service quality influences the view of the corporate picture and brand loyalty (Aydin & Özer, Citation2005; Moisescu, Citation2018). Therefore, Prentice (Citation2013) pointed out that improving the suppliers’ service quality could help consumers to develop a positive attitude towards service providers, thus developing a higher degree of loyalty; so the degree of service quality has an important impact on customer loyalty. Customer satisfaction is a key factor affecting customer loyalty (Kim, Wong, Chang, & Park, Citation2016; Tahir & Guru, Citation2017). Oliver (Citation1999) pointed out that satisfaction is the key factor of customer loyalty and the degree of satisfaction decides the loyalty to a supplying service agent. Deng, Lu, Wei, and Zhang (Citation2010) also showed that the age of a customer can moderate both satisfaction and loyalty. Therefore, this study combined with the above literature, proposes that customer demands in different ages are different, that the car service centre must consider whether the quality of service it provides should be adjusted according to different ages, and further access to all customers’ satisfaction and loyalty.
2.4. Measuring dimensions of customer satisfaction and customer loyalty
In research into customer satisfaction related to transportation vehicles, there exist two patterns, an overall measuring dimension and a multiple measuring dimension. An overall measuring dimension is a pattern formed by accumulated emotion with time, and the evaluation is weighed, added up, and combined into a single item for overall satisfaction. Conversely, a multiple measuring type is a combination of evaluations of multiple service items. In studying overall satisfaction, Andaleeb and Basu (Citation1998) analysed the evaluation of automobile service technique and knowledge and obtained the result that the realisation of service items and their quality both affect customer satisfaction. Nyadzayo and Khajehzadeh (Citation2016) discussed the customer relation management of an automobile dealer and the result showed that customer satisfaction can moderate the relationship between the customer’s relations and their loyalty. In the research of multiple measuring dimensions, Alpu (Citation2015) investigated the service of Turkey’s high-speed rail including service conditions, information and actions; Chen and Wang (Citation2016) also analysed the satisfaction of passengers with the airport service on the basis of the service environment, staff service and facilities. Farooq, Salam, Fayolle, Jaafar, and Ayupp (Citation2018) also took the overall view to survey Malaysia Airlines’ customer satisfaction, and they found that airlines should focus on all dimensions of service quality such as airline tangibles, terminal tangibles, personnel services for enhancing their customer satisfaction. The conclusions of the above literature have found that if the satisfaction of a customer is measured in an overall view, the measure is usually influenced by customer perception and expectations of service. Moreover, it was found that the measure of satisfaction depends mainly on an overall sense, customer satisfaction positively relates to the service quality and customer satisfaction is regarded as a mediator to link a customer’s loyalty with service quality. According to the above literature the present study has used an overall measurement of satisfaction to investigate customer satisfaction for regular automobile service centres.
Many researchers and businesses consider that customer loyalty gives a significant promotion to a company’s performance. Therefore, all service suppliers should act to make customers pleased and satisfied with their services, so that they can retain and promote the customers’ loyalty (Balabanis, Reynolds, & Simintiras, Citation2006). Oliver (Citation1999) emphasised that a customer’s loyalty is a firm promise for repurchase and that the loyalty causes the customers to choose the company’s future products and services even if a change in the business environment occurs. Thuan, Ngoc, and Trang (Citation2018) and colleague pointed out that if 5% of the customers are maintained, then profit increases by 25–85%. Hence, loyal customers create substantial profits for a company. Fornell (Citation1992) proposed that the cost of developing a new customer is four to five times more than maintaining an original customer. Therefore, the loyalty of a customer is very important to a company because it creates profit as well as saving costs. With respect to the measurements of a customer’s loyalty, several researchers cannot reach a common conclusion due to the combination of factors applied to different businesses. This research, after discussions with senior managers of Taiwanese Nissan and Honda branches, has adopted a combination of dimensions by Martensen et al. (Citation2000) and Nyadzayo and Khajehzadeh (Citation2016) to measure customer loyalty to the service agents.
In addition, this study has aggregated the interrelationships of service quality, customer satisfaction and customer loyalty. Calisir, Basak, and Calisir (Citation2016) and Hussain, Al Nasser, and Hussain (Citation2015) both addressed the fact that service quality, satisfaction and loyalty in the aviation industry were analysed by the regression method. They confirmed that there exist positive relationships between the three dimensions of service quality, satisfaction and loyalty. Taking supermarkets as an example, Orel and Kara (Citation2014) discussed how the self-checkout system for supermarkets related to service quality, satisfaction and loyalty. Using regression analysis, the results also supported that the three dimensions of service quality, satisfaction and loyalty were positively interrelated. Therefore, this study has followed the former research, using regression analysis to explore the three dimensions, rather than using the Structural Equation Model (SEM) to discuss the causal relationship.
3. Design questionnaire and analysis methodology
This study has primarily combined the modified Kano model questionnaire measurement method from Matzler and Hinterhuber (Citation1998) with the five dimensions (tangibles, reliability, responsiveness, assurance, empathy) of the SERVQUAL scale (Parasuraman, Zeithaml, & Berry, Citation1988) to form questions on service quality for car service centres. Secondly, the questions measured customer loyalty coming from the four dimensions (intention to repurchase, willingness to recommend, price tolerance and cross-buying intention) proposed by Martensen et al. (Citation2000) and the research of Nyadzayo and Khajehzadeh (Citation2016) has also been referred. The data analysis method of this study includes reliability and validity analyses and regression, so subsequently the quality classification method has also been used.
Next, in order to verify whether the modified Kano model theory can be used as a possibility of quantitative research, this study has encoded the quality classification of each question, similar to Likert’s five points 5 to 1 satisfaction score. The classification of attractive quality is 4 points, one-dimensional quality 3 points, must-be quality 2 points, indifferent quality is 1 point (if the results show a reverse quality, the attractive quality is 5 points, reverse quality is 1 point). Respondents were divided into three age groups (<30, 30, >40), to explore whether the statistical values were subject to F-distribution, and Scheffe’s post hoc analysis was performed for multiple comparisons. Ten technical or sales supervisors working in regular Nissan, Toyota, Lexus, Honda, Hyundai and Volkswagen automobile service centres were separately invited to answer the questionnaire in April to May 2016, to be able to construct the reliability and effectiveness of experts.
4. Results and discussion
After analysing the filled-out questionnaires, it was found that each of Cronbach’s α coefficients for all the question items were between 0.881 and 0.900, which verified professional reliability and effectiveness. Subsequently, car owners were invited to join the survey whilst servicing their cars in the six selected regular automobile service centres (Nissan, Toyota, Lexus, Honda, Hyundai and Volkswagen). In the questionnaire survey procedure, the grand total provided 250 questionnaires, recycling 199 effective questionnaires, the effective questionnaire recycling is at a rate of 80%. It was also found that each of Cronbach’s α coefficients for all the question items were between 0.891 and 0.891 (Table ), which verified the reliability is satisfactory. Demographic data from respondents also show the age distribution; 51.8% were under 30 years old, 30.7% between 30 and 40, 11.6% between 40 and 50 and 6.0% over 50.
Table 3. Cronbach’s α of service quality factors for automobile service centres
4.1. Correlation analysis between service quality (by five factors of SERVQUAL) and customer loyalty
In order to analyse the relationship between service quality and customer loyalty, this study has used information provided by Nissan and Mazda Asian managers, who estimate that 30 years of age is the threshold for first-time buyers and vehicle maintenance. The respondents were divided into three parts: <30-year olds, ≧30-year olds and the whole samples. Regression was used to analyse the correlation between service items and customer loyalty. For the whole sample, the statistical results show that all the factors of the SERVQUAL scale have significant correlations to customer loyalty. The overall significance of the tangible is (R: 0.400, ΔR2: 0.134, F = 6.089, p < 0.001), the overall significance of the reliability is (R: 0.358, ΔR2: 0.101, F = 4.707, p < 0.001), the overall significance of the responsiveness is R: 0.318, ΔR2: 0.073, F = 3.587, p < 0.01), the overall significance of the assurance is (R: 0.391, ΔR2: 0.126, F = 5.761, p < 0.001) and the overall significance of the empathy is (R: 0.419, ΔR2: 0.150, F = 6.831, p < 0.001).
The results showed that among the groups < 30-years-old, the remaining factors within SERVQUAL were of relevance to customer loyalty, except that responsiveness did not have a significant performance. Among them, the vehicle’s moving line with clear signs (R: 0.242, ΔR2: 0.040, F = 3.121, p < 0.1) and feeling comfortable and warm in the waiting area (R: 0.213, ΔR2: 0.026, F = 2.374, p < 0.1) within tangibles are significant, the overall significance of the reliability is (R: 0.397, ΔR2: 0.105, F = 2.998, p < 0.1), the overall significance of the assurance is (R: 0.405, ΔR2: 0.111, F = 3.130, p < 0.01) and the overall significance of the empathy is (R: 0.365, ΔR2: 0.079, F = 2.454, p < 0.1). The statistical results showed that each factor of the SERVQUAL scale, respectively, has a significant relevance to customer loyalty for ≧30-year-old group. The overall significance of the tangibles is (R: 0.532, ΔR2: 0.235, F = 5.860, p < 0.001), the overall significance of the reliability is (R: 0.377, ΔR2: 0.084, F = 2.460, p < 0.1), the overall significance of the responsiveness is (R: 0.521, ΔR2: 0.223, F = 5.536, p < 0.001), the overall significance of the assurance is (R: 0.437, ΔR2: 0.136, F = 3.498, p < 0.01), the overall significance of the empathy is (R: 0.517, ΔR2: 0.218, F = 5.415, p < 0.001).
In this study, for the overall group, the “staff take the initiative to care after maintenance” (R: 0.362, ΔR2: 0.122, F = 14.800, p < 0.001) has the closest relation with loyalty, and the next most important are “good technical ability as well as works perfectly” (R: 0.353, ΔR2: 0.116, F = 13.961, p < 0.001), “moving smoothly, and clear signs” (R: 0.338, ΔR2: 0.105, F = 12.626, p < 0.001), “comfortable in waiting area” (R: 0.319, ΔR2: 0.092, F = 11.087, p < 0.001) in turn. For the group of <30-year olds, the items of “good technical ability as well as working perfectly” (or: 0.341, ΔR2: 0.099, F = 6.576, p < 0.01), “staff take the initiative to care after maintenance” (R: 0.324, ΔR2: 0.087, F = 5.864, p < 0.01), “completed within an appointed time” (R: 0.309, ΔR2: 0.077, F = 5.272, p < 0.01) are the first three rankings which highly relate to customer loyalty. Aiming at the respondents with the ≧30-year-old group, the first three service items most closely related to loyalty are “flexibly meeting customer’s time constraints” (R: 0.430, ΔR2: 0.167, F = 10.520, p < 0.001), “staff take the initiative to care after maintenance” (R: 0.427, ΔR2: 0.165, F = 10.393, p < 0.001), “warranty and related free inspecting” (R: 0.421, ΔR2: 0.160, F = 10.043, p < 0.001) in that order.
It is concluded that no age group has a consistent view. The group of <30-year olds pays more attention to maintenance and repairing abilities, mainly focusing on technical feeling; the group of ≧30-year olds thinks highly of the maintenance and repairing environment, mainly focusing on sensory influence. Even the first influential items all belong to the assurance or reliability dimensions which are attributed to the category of maintenance and repair, and the second is the dimension of empathy for the overall group. This finding is similar to Deng et al.’s (Citation2010) exploration, the age of a customer would influence the relationship between customer satisfaction and customer loyalty.
4.2. Analysing results of the modified Kano model
The modified Kano model depends on the quality model in Figure to distinguish quality ingredients which service items of each car service centre belong to, and gathering statistics according to different levels of ages such as the under 30 (n = 103), =30 (n = 35), above 30 (n = 61). After calculating the distribution of quality ingredients, this study has found that 14 question items in each group are one-dimensional, and attractive quality was only covered in 1 question item. It was noted, the attractive quality is the same coming from the responsiveness factor. The under 30 emphasised the question item “ can flexibly meet customer’s time constraints”, and both 30 and above 30 groups thought the question item “ the service technician can treat it in time, and providing courtesy car” were the main sources to raise the service quality for car service centres.
Luoh and Tsaur (Citation2011) argued that the satisfaction of service quality would change with a customer’s age in the restaurant service industry. Cheng (Citation2011) also analysed the service quality of Taiwan’s high-speed rail, and found that two sampling groups divided by a line of 28-year olds displayed varying views for internet service quality. Research concerning customer satisfaction and loyalty in China’s mobile communication by Deng et al. (Citation2010) suggested that the satisfaction perception varied in response to different age levels. In addition, both Bober (Citation2017) and Layson (Citation2017) admitted that there are different perceived service attributes between regular automobile service centres and non-dealer car service facilities which customers take their cars to for maintenance or repair. In general, customers take it for granted that the regular automobile service centres operated directly by brand dealers would provide better service, and that the effect of quality on customer satisfaction is a kind of obligation. In the case of going to a private car service facility for repair or maintenance, a customer will have a higher satisfaction with the same service provided by regular automobile service centres. This study has also obtained a similar result that most of the quality attributes of service items are a one-dimensional quality, not being a must-be or attractive quality.
4.3. F-test and Scheffe’s post hoc analysis of the modified Kano model
This study has further encoded the quality ingredients of the effective questionnaires and used SPSS software to compute a one-way Anova, and has found that three SERVQUAL test results, tangibles (F = 4.63, p < 0.05), reliability (F = 3.35, p < 0.05), empathy (F = 6.01, p < 0.01) were significant (Table ). In order to accurately compare the individual differences between the three groups, Scheffe’s post hoc analysis was used in this study. The results show that the significance of the under 30 group was greater than 30-year olds in the tangibles, the significance of the above 30 group was greater than under 30s in the reliability, and the significance of the under 30 group was greater than the above 30s, and for the empathy factor above 30 was greater than 30-year olds. Therefore, this study confirms that the Kano Model is applicable to performance indicator analysis and can also assist in the linear regression analysis of the hypothesis.
Table 4. Quantitative research results of Kano model by car owners of different ages
5. Conclusion
After Matzler and Hinterhuber (Citation1998) modified the Kano model from original theory, it has been widely used in the service industry to assess customer satisfaction related to qualitative research. Among these researches, in the field of automotive industry research, attractive quality is the main indicator used to assess customer satisfaction. In this study, the traditional regression method has been used to analyse the correlation between service quality (by SERVQUAL) and customer loyalty for Asian car service centres, as well as adopting the Kano model to summarise the quality ingredients of customer satisfaction into different age groups, then next, encoding the quality elements and operation, and finally, a successfully verified Kano model can be used as a quantitative study of the possibilities. In the future, this study will expand the number of service quality samples to make the number of different age group samples equitable, to facilitate the research hypotheses that the Kano model compares with the SEM.
Funding
The authors received no direct funding for this research.
Additional information
Notes on contributors
Han Chao Chang
Han Chao Chang and his team of members from business, university and state-level research units, comprised of experts in management and engineering, will discuss management and statistics-related topics in different directions and approaches to research. Previously, they questioned the hypothesis of using the B method, and considered that when the hypothesis is not established, the researchers cannot easily give up, they further proposed possible solutions. In 2016, they, from hundreds of articles, the use of logical operator, found two factors that are not of concern to previous studies and have a positive impact on the mobile game flow experience. Therefore, it is also the result of their joint efforts to verify whether the modified Kano model can be quantitatively analysed in the future, and hope to make new contributions to management research in the future through their cross-functional cooperation.
References
- Alpu, O. (2015). A methodology for evaluating satisfaction with high-speed train services: A case study in Turkey. Transport Policy, 44, 151–157.10.1016/j.tranpol.2015.08.004
- Andaleeb, S., & Basu, A. K. (1998). Do warranties influence perceptions of service quality? A study of the automobile repair and service industry. Journal of Retailing and Consumer Services, 5(2), 87–91.10.1016/S0969-6989(97)00072-6
- Aydin, S., & Özer, G. (2005). The analysis of antecedents of customer loyalty in the Turkish mobile telecommunication market. European Journal of Marketing, 39(7/8), 910–925.10.1108/03090560510601833
- Balabanis, G., Reynolds, N., & Simintiras, A. (2006). Bases of e-store loyalty: Perceived switching barriers and satisfaction. Journal of Business Research, 59(2), 214–224.10.1016/j.jbusres.2005.06.001
- Bober, I. (2017). Dealer vs non-dealer car servicing. Practical Motoring. Retrieved from https://practicalmotoring.com.au/car-advice/dealer-vs-non-dealer-servicing/
- Calisir, N., Basak, E., & Calisir, F. (2016). Key drivers of passenger loyalty: A case of Frankfurt-Istanbul flights. Journal of Air Transport Management, 53, 211–217.10.1016/j.jairtraman.2016.03.002
- Chen, C. F., & Wang, J. P. (2016). Customer participation, value co-creation and customer loyalty-A case of airline online check-in system. Computers in Human Behavior, 62, 346–352.10.1016/j.chb.2016.04.010
- Cheng, Y. H. (2011). Evaluating web site service quality in public transport: Evidence from Taiwan High Speed Rail. Transportation Research Part C: Emerging Technologies, 19(6), 957–974.10.1016/j.trc.2011.04.003
- Cronin, J. J., Brady, M. K., & Hult, G. T. M. (2000). Assessing the effects of quality, value, and customer satisfaction on consumer behavioral intentions in service environments. Journal of Retailing, 76(2), 193–218.10.1016/S0022-4359(00)00028-2
- Cronin, J. J., & Taylor, S. A. (1992). Measuring service quality: A reexamination and extension. Journal of Marketing, 56(3), 55–68.10.2307/1252296
- Culiberg, B., & Rojšek, I. (2010). Identifying service quality dimensions as antecedents to customer satisfaction in retail banking. Economic and Business Review, 12(3), 151–166.
- Deng, Z., Lu, Y., Wei, K. K., & Zhang, J. (2010). Understanding customer satisfaction and loyalty: An empirical study of mobile instant messages in China. International Journal of Information Management, 30(4), 289–300.
- Dominici, G., Roblek, V., Abbate, T., & Tani, M. (2016). Click and drive: Consumer attitude to product development: Towards future transformations of the driving experience. Business Process Management Journal, 22(2), 420–434.10.1108/BPMJ-05-2015-0076
- Farooq, M. S., Salam, M., Fayolle, A., Jaafar, N., & Ayupp, K. (2018). Impact of service quality on customer satisfaction in Malaysia airlines: A PLS-SEM approach. Journal of Air Transport Management, 67, 169–180.10.1016/j.jairtraman.2017.12.008
- Fornell, C. (1992). A national customer satisfaction barometer: The Swedish experience. Journal of Marketing, 56(1), 6–21.10.2307/1252129
- Hussain, R., Al Nasser, A., & Hussain, Y. K. (2015). Service quality and customer satisfaction of a UAE-based airline: An empirical investigation. Journal of Air Transport Management, 42, 167–175.10.1016/j.jairtraman.2014.10.001
- Kano, N., Seraku, N., Takahashi, F., & Tsjui, S. (1984). Attractive quality and must-be quality. Hinshitsu. The Journal of the Japanese Society for Quality Control, 14(2), 147–156.
- Kim, M. K., Wong, S. F., Chang, Y. C., & Park, J. H. (2016). Determinants of customer loyalty in the Korean smartphone market: Moderating effects of usage characteristics. Telematics and Informatics, 33(4), 936–949.10.1016/j.tele.2016.02.006
- Kurz, C., Li, G., Vine, D. (Producer). (2016). The Young and the Carless? The Demographics of New Vehicle Purchases. FEDS Notes. Retrieved from https://www.federalreserve.gov/econresdata/notes/feds-notes/2016/the-young-and-the-carless-the-demographics-of-new-vehicle-purchases-20160624.html
- Layson, G. (2017). Dealers narrow service satisfaction gap with non-dealers. Automotive News Canada. Retrieved from http://canada.autonews.com/article/20170831/CANADA/170839963/dealers-narrow-service-satisfaction-gap-with-non-dealers
- Leventhal, R. C., & Zineldin, M. (2006). The royalty of loyalty: CRM, quality and retention. Journal of Consumer Marketing, 23(7), 430–437.
- Lin, L.-Z., Yeh, H.-R., & Wang, M.-C. (2015). Integration of Kano’s model into FQFD for Taiwanese Ban-Doh banquet culture. Tourism Management, 46, 245–262.10.1016/j.tourman.2014.05.007
- Luoh, H. F., & Tsaur, S. H. (2011). Customers’ perceptions of service quality: Do servers’ age stereotypes matter? International Journal of Hospitality Management, 30(2), 283–289.10.1016/j.ijhm.2010.09.002
- Martensen, A., Gronholdt, L., & Kristensen, K. (2000). The drivers of customer satisfaction and loyalty: Cross-industry findings from Denmark. Total Quality Management, 11(4–6), 544–553.10.1080/09544120050007878
- Matzler, K., & Hinterhuber, H. H. (1998). How to make product development projects more successful by integrating Kano’s model of customer satisfaction into quality function deployment. Technovation, 18(1), 25–38.10.1016/S0166-4972(97)00072-2
- Moisescu, O. L. (2018). From perceptual corporate sustainability to customer loyalty: A multi-sectorial investigation in a developing country. Economic Research-Ekonomska Istraživanja, 31(1), 55–72.10.1080/1331677X.2017.1421998
- Nyadzayo, M. W., & Khajehzadeh, S. (2016). The antecedents of customer loyalty: A moderated mediation model of customer relationship management quality and brand image. Journal of Retailing and Consumer Services, 30, 262–270.10.1016/j.jretconser.2016.02.002
- Oliver, R. L. (1999). Whence consumer loyalty? Journal of Marketing, 63, 33–44.10.2307/1252099
- Orel, F. D., & Kara, A. (2014). Supermarket self-checkout service quality, customer satisfaction, and loyalty: Empirical evidence from an emerging market. Journal of Retailing and Consumer Services, 21(2), 118–129.10.1016/j.jretconser.2013.07.002
- Parasuraman, A., Zeithaml, V. A., & Berry, L. L. (1985). A conceptual model of service quality and its implications for future research. Journal of Marketing, 49(4), 41–50.10.2307/1251430
- Parasuraman, A., Zeithaml, V. A., & Berry, L. L. (1988). SERVQUAL: A multiple-item scale for measuring consumer perceptions of service quality. Journal of Retailing, 64(1), 12–40.
- Prentice, C. (2013). Service quality perceptions and customer loyalty in casinos. International Journal of Contemporary Hospitality Management, 25(1), 49–64.10.1108/09596111311290219
- Rashid, M. M., Tamaki, J. I., Ullah, A. S., & Kubo, A. (2010). A proposed computer system on Kano Model for new product development and innovation aspect: A case study is conducted by an attractive attribute of automobile. International Journal of Engineering, Science and Technology, 2(9), 1–12.
- Rust, R. T., & Zahorik, A. J. (1993). Customer satisfaction, customer retention, and market share. Journal of Retailing, 69(2), 193–215.10.1016/0022-4359(93)90003-2
- Tahir, M. N., & Guru, P. (2017). What factors determine e-satisfaction and consumer spending in e-commerce retailing? Journal of Retailing and Consumer Services, 39, 135–144.
- Taylor, S. A., & Baker, T. L. (1994). An assessment of the relationship between service quality and customer satisfaction in the formation of consumers’ purchase intentions. Journal of Retailing, 70(2), 163–178.10.1016/0022-4359(94)90013-2
- Thuan, L. T., Ngoc, N. H., & Trang, N. T. (2018). Does customer experience management impact customer loyalty shopping at supermarket? The case in the Mekong Delta, Vietnam. Economics World, 6(1), 13–21.
- Tseng, N. H. (Producer). (2013). Why car companies can’t win young adults. Fortune. Retrieved from http://fortune.com/2013/08/16/why-car-companies-cant-win-young-adults/
- Wolfindale, A., Dunne, G., & Walsh, S. J. (2012). Vehicle noise primary attribute balance. Applied Acoustics, 73(4), 386–394.10.1016/j.apacoust.2011.11.002
- Yadav, H. C., Jain, R., Singh, A. R., & Mishra, P. K. (2017). Kano integrated robust design approach for aesthetical product design: A case study of a car profile. Journal of Intelligent Manufacturing, 28(7), 1709–1727.10.1007/s10845-016-1202-5
- Zeithaml, V. A., Bitner, M. J., & Gremler, D. D. (2012). Service marketing: Integrating customer focus across the firm (6th ed.). Columbus, OH: McGraw-Hill Education.