
 ?Mathematical formulae have been encoded as MathML and are displayed in this HTML version using MathJax in order to improve their display. Uncheck the box to turn MathJax off. This feature requires Javascript. Click on a formula to zoom.
Abstract
The link between tourism and aviation is at the top of the agenda of many academic institutes, professional associations and regulatory authorities, mainly, because of the both industries high competitive business environment resulting demand volatility and business unpredictability. Airports serving tourist destinations are essential counterpart of the tourist demand supply chain and their productivity impact essential the mobility cost, the connectivity and the region’s attractiveness. This paper deals with the airport productivity assessment towards regional development (RD) for regions heavily dependent on tourism. The methodological approach promotes two essential steps: (a) the introduction of a set of key performance indicators (KPI) providing essential messages towards airport’s contribution in tourist regions and (b) a performance benchmarking for a group of airports with similar characteristics serving high demanded tourist destinations. The assessment methodology is based on a multi-objective unweighted analysis, introducing six KPIs to provide messages towards airport productivity contribution in RD, in the scale of strategic planning. The assessment framework uses a sample of seven islands constitute very attractive European tourist destinations for summer holidays and the assessment outputs provide key messages to planners, managers and decision-makers towards aviation and tourism interaction.
Public Interest Statement
In modern economy, tourism is an essential business sector towards regional economic development. Forecasts suggest that air transports will accommodate the majority of holiday’s leisure traffic, resulting essential growth for aviation in forthcoming years. Therefore, the tourism development strategies in remote leisure destinations is heavily depended on airports effective use of capacity, efficiency in operation and mitigation of environment disturbance. The proposed multi-objective methodological framework provides an essential tool to review airports productivity towards tourism development. The numerical application reviews the airport productivity for a sample of attractive summer holiday destinations in Mediterranean, where air transports deliver the majority of leisure demand. The results highlight the essential role of airports location and management, as well as policies affected air transport productivity such us the catchment area land use planning. The analysis framework and results are promoting key message to planners, managers and decision-makers towards resilient business development of tourism and air transport industry and sustainable regional development strategic planning.
1. Introduction
Tourism plays an important role in the regional economic development, and in some cases, it significantly contributes to regional economic development, representing the main source of income. Despite the high competition and the economic unstable economic environment, the destination in Mediterranean Region has undergone enormous growth in the tourist demand during the last decade, which in turn has significantly increased the demand for air travel and placed under discussion the adequacy of the available infrastructures. UNWTO (Citation2017) indicates that tourism growth has shown virtually uninterrupted growth over time, despite occasional shocks, demonstrating the sector’s strength and resilience. International tourist arrivals have increased from 25 million globally in 1950 to 278 million in 1980, 674 million in 2000 and 1,235 million in 2016. Especially in Europe in 2016 in absolute terms was led by Northern European countries (which reported a growth of 6%), then Central and Eastern Europe (growth of 4%) and then Mediterranean countries (which reported a growth of 1%). Spain, the sub-region’s top destination and Europe’s second largest, posted 10% growth, while other top Mediterranean destinations posted respectively: Portugal (+13%), Croatia (+9%), Cyprus (20%), Greece (+5%) and Malta (+10%), highlighting that islands and coastal zones demonstrate the highest tourism demand.
The high contribution of tourism and air transport to regional development (RD) stimulates the research interest (Benedetti, Gobbato, Perboli, & Perfetti, Citation2012; Forsyth, Citation2006; Graham, Citation2006; Khadaroo & Seetanah, Citation2007; Lee & Brahmasrene, Citation2013), providing evidence that the selection of the final tourist destination is related to air transport performance, transport infrastructures and supply chain management. For high demanded tourism destinations, the business sectors of air transport and tourism are interlinked. Bieger and Wittmer (Citation2006) and Dimitriou (Citation2018) highlight the relationship between tourism and air transport and conclude that any changes in aviation efficiency are closely linked to tourism development. On the one hand, new forms of tourism and new destinations influence air transport demand while, on the other, airports provide essential infrastructure to support regional, social and economic growth and become commercial entities, generating returns on investment to the benefit of their shareholders, and to overall society as a whole. The interlinkage between the two industries has been investigated in order to define the different tourism demand patterns and support decisions towards local market growth (Dimitriou, Mourmouris, & Sartzetaki, Citation2017). The complex aviation business environment, the behavioural aspects of demand and the business regulatory framework influence strategic planning decisions and the effective fund allocation of the local airport infrastructures.
In literature, airports are recognized as having a considerable economic and social impact on their surrounding regions (Dimitriou, Citation2018). These impacts go beyond employment created directly on-site and indirectly in the supplier chain. The wider economic impact of airports defined as the catalytic impact arises from the air connectivity effects and its role in the development of inbound tourism according to ATAG (Citation2014). Fares are also considered to be one of the key drivers influence international tourism growth (UNWTO, Citation2017). The air connectivity improvement can enhance the potential economic development of a region, which in turn will increase the demand for air travel, creating a “virtuous circle” of growth.
While the benefits of airports to RD and economic growth are well recognized, the investigation into how the airport productivity performance contributes to tourism development is quite limited. This paper aims to explore the productivity performance evaluation by introducing a group of key performance indicators (KPIs) that provide support to key strategic decisions, such as infrastructure capacity, financial performance, business yield and resources utilization, in order to identify the level of support of tourist airports towards RD. The paper is structured in the following manner: after this introduction, key literature review is presented in Section 2, while Section 3 provides the methodological approach and the application with the sample of seven European airports. The application results are discussed in Section 4, providing key messages towards airports productivity innovation. Finally, key concluding remarks are presented in Section 5 and the references are situated at the end.
2. Literature review
The analysis objective is to evaluate the impact of airports productivity performance on tourism and RD for those regions that are heavily depended on tourism. Measuring and comparing the performance of airports and their contribution on RD provides key findings for both aviation and tourism industries. The crucial issues of the analysis are: the choice of variables for the development of KPIs and the methodological approach to evaluate the productivity performance towards RD for a sample of competing airports.
A review of the literature reveals different conceptions of the interdependence of the two industries. Bieger and Wittmer (Citation2006) investigated the relationship between air transport and tourist development by focusing on their business models. A systematic model was used to highlight the connections and interactions between air transport and tourism while the strong link between the business models of the airlines and their impact on tourism flows has been revealed. Forsyth (Citation2006), determined the tourism’s economic benefits in aviation decision-making and suggested different ways of evaluating them such as input–output (IO) and computable general equilibrium (CGE) models. Dimitriou (Citation2018) estimated the benefits of tourist airports on the regional economy and depicted an instructive defensible picture of the economic and employment impacts that can arise from the development of a new airport on a Mediterranean island highly depended on tourism industry. Graham (Citation2006) examined the major forces that drive leisure airline traffic in order to assess whether these have changed in recent year, indicating that traditional key drivers of demand such as income, cost and time will continue to play an important role in influencing demand, although their relative importance may change. Benedetti et al. (Citation2012) used a logit-based analysis to predict passenger flow in an airport when management introduces a change in the flight schedule and to estimate the impact of this change on the airport’s catchment area in terms of tourism and economic growth.
Airport benchmarking analysis is based on various methodologies over time by focusing on certain aspects of airport operation or a certain group of airports with a similar operating environment. Ulku (Citation2015) utilized a data envelopment analysis to compare the relative efficiency of Spanish and Turkish airports between 2009 and 2011, identifying the sources of inefficiencies resulting from various management strategies and other external factors. Tovar and Martin-Cejas (Citation2010) used a stochastic distance function to measure airports’ productivity changes while considering multiple outputs. The empirical results of this analysis revealed different efficiency levels between mainland airports and island airports and an above-average level of efficiency for hub airports. Adler, Liebert, and Yazhemsky (Citation2013) analysed airport productivity processes from a managerial perspective in order to provide a set of models that support the benchmarking process. Tsui, Balli, Gilbey, and Gow (Citation2014) evaluated the operational efficiency of Asia-Pacific airports and suggested that factors such as the percentage of international passengers handled by an airport, population of catchment area and an increase in GDP per capita are significant factors for variations in airport efficiency between different airports. Finally, concerning the environmental impact of airports on RD, although airports contribute to a region’s economic development (Dimitriou, Citation2016) many researches highlight the negative impact on the environment and on the communities around them (Dimitriou, Citation2018). Environmental impacts such as noise, air and water pollution and natural resources consumption are some of the implications resulting from the airports operation that constrain airports’ further development (Graham, Citation2006). As a result, many airports can no longer make full use of their capacity, especially when the mitigating cost is quite high. Dimitriou, Voskaki, and Sartzetaki (Citation2014) investigated the differences and common practices in applied environmental strategies and systems in eight European airports showing that airports that serve more than 5 million passengers per year seem to have a better environmental strategy; airports located in the countries that do not have applied specific sustainable development strategies focus on facilitating growth, rather than taking measures to control their environmental disturbance.
3. Evaluation framework
Key objective of this paper is to evaluate airport productivity performance towards RD in tourist destinations. The evaluation framework involves cross assessment of the traffic accommodate from an airport serving a tourist destination (airport catchment area), by introducing two main categories (groups) of criteria: (a) airport development (AD) features and (b) the impact of international tourist arrivals traffic in the RD. The evaluation methodology is based on a multi-criteria analysis framework, including unweighted cumulative results and cross assessment for the two categories of criteria (Fransis, Humphreys, & Fry, Citation2002; Lupo, Citation2015; Postorino & Praticò, Citation2012; Tsui et al., Citation2014; Wei Lam, Low, Ching Tang, Citation2009).
The AD that constitutes the first criterion category is divided in two sub-categories: (A1) airport operation efficiency and (A2) airport business resilience. The second category is related to RD and is referred to the impact caused by the air transport traffic maintained at the airport, with two sub-categories: (Β1) tourism socioeconomic impact and (B2) environmental impact. It is mentioned that all above categories and the accomplished criteria introduced in this analysis are unweighted with equal contribution, mainly, for two reasons: (a) all criteria are too important in regional strategic planning and (b) the cross-evaluation between the two categories provides coherent results promoting best practices and illustrating strategies and actions to improve productivity.
For the evaluation of AD, three KPIs towards productivity of each sub-category were developed. Airport operation efficiency indicators provide the airport output (aircraft movements, passengers) to inputs (employees, gates and airport facilities) while airport business resilience indicators measure the airport operator financial outputs (revenues and cost) of input required to produce an output (e.g., aircraft movements, passengers and cargo handled).
The KPIs adopted are summarized in Table . The data used for the evaluation are based on the available data published by airport operators (Hellenic Civil Aviation Authority (HCAA), Citation2015; AENA, Citation2015; MIA, Citation2015; SAC S.p.A, Citation2015). Excellence represents best productivity performance within the perspectives of an airport’s economic efficiency and business resilience towards regional tourism development and environmental impact.
Table 1. Criteria and sub-criteria of evaluation
For the purpose of this analysis, the external factors that influence the performance productivity (different ownership schemes, different regulation frameworks, different markets) are not taken into consideration. By assuming that (a) the external factors are indifferent for the selected airports (same conditions of ownership, common European regulation, absence of competition for the same catchment area, same airport market) and (b) all the criteria selected are not weighted, an unweighted evaluation airport productivity performance framework is adopted.
3.1. Category airport development KPI
Airport productivity analysis determines how an airport can use its resources (infrastructure and human capital) to provide production output. A higher score reveals a higher performance towards AD.
The KPIs introduced to review airport efficiency (A1) are:
Aircraft traffic movements (ATM)/runways: The higher number of runways used the same time may increase offered capacity, providing the aerodrome (apron) utilization index. A higher score indicates a higher utilization ratio for the critical infrastructure of an airport, resulting lower aeronautical charges and lower supply chain cost for tourism industry, contributing to airport towards tourism and RD.
Airport international passengers (pax)/(ATM): A higher score in this index corresponds to efficient mix of aircraft types to accommodate air transport demand, resulting higher aircraft load factors, lower fares and travel cost and higher utilization factor for the airport facilities.
Pax/employees: This KPI is a workforce-based productivity measure, where labour is the overall cost addressed for all the necessary activities to accommodate airport traffic, including the cost for outsourcing activities (i.e. security, cleaning, baggage handling). The number of employees adjusted as the full-time equivalent (FTE) employees is considered as the average salaries in the region for the analysis base year.
The second group of performance indicators introduced to review airport performance is related to business outputs. The better financial outputs represent a resilient airport company, promoting stability, effective business planning and efficient transport policy that take the benefits of the tourist demand. The indexes introduced to evaluate airport business resilience are:
Pax/OPEX: Operating expenses (OPEX) performances at benchmarked airports vary widely, mainly due to the differences in the unit cost for the offered services. Airport expenses per passenger are influenced by each airport’s regional macroeconomic environment and by differences in operating efficiency, (e.g. fix cost vs. variable cost). However, in the analysis, the OPEX could be adjusted subject to the regulatory and economic variables. For the purpose of this analysis, the OPEX is not adjusted, because all the sample airports serving European regions are considered to be under the same economic and regulation framework. Therefore, the reduced airport operating cost per passenger responds to higher performance.
Revenues/Pax: Aeronautical revenues including landing and apron fees, gate charges, passenger-related charges and ground-handling revenues for each airport while non-aeronautical revenues are revenues form retail concessions, car parking, property income and rent, food and beverage, rental car concessions with significant variations in mix between airports and in different regions. Revenue per passenger may be correlated with the percentage of transfer passengers, the percentage of premium passengers and the number of runways. Especially aeronautical revenue per passenger is often a function of the airport’s capital development phase, as airport’s capex per passenger, and in turn its aeronautical revenue per passenger is likely to be influenced by where the airport stands on the capital development cycle, as for example, for airports that have recently completed major terminal projects are likely to have high debt service (financial) costs and in turn high aeronautical revenue per passenger. However, the analysis examines the current performance as it is depicted in the last airport operator financial statement, representing the current profile of the airport company. Therefore, higher revenues per passenger represent higher performance.
Profits/revenues: This indicator reveals the efficient airport management and staff productivity performance. A higher score in this index indicates a more efficient management. One of the major problems associated with comparing business performance is that while some airport operators provide activities such as security, air traffic control, handling, car parking, duty-free shops, facility management and maintenance on their own, others contract these out. Other key factors that may influence the results of airports external benchmarking are airport size—since large airports are likely to experience economies of scale—and the nature of traffic such as the share of international passengers, as these have higher costs and generate more revenues than domestic passengers.
3.2. Category regional development KPI
Regarding the evaluation of air transport industry towards RD, the KPIs (higher scores reveal higher performance) are:
International tourist arrivals at airport (ITA)/population: The population is defined as the total population of the island that the airport serves or the population of the airport’s catchment area. This indicator determines how many ITAs accommodated and handled by the population of the catchment area.
ITA/GDP: GDP is defined as the gross domestic product at regional level and a high score for this indicator represents high economic contribution per pax.
ITA/tourist bed places: This unit measures the capacity of any type of accommodation in relation to international tourists.
Regarding the environmental impact, the environmental indexes adopted for the purpose of this analysis are defined as:
ATM/peak hour: This index reveals the frequency of noise disturbance from aircraft movements within the catchment area.
Population density/ATM: The population density variable “measures” the level of noise disturbance in the selected region and is defined as the population density within a specified noise contour (a radius of 20 km).
Pax/CO2 emissions: CO2 emissions are measured according to the metric system (measure of aircraft fuel burn performance). This indicator presents the estimating amount of carbon emissions (CO2) generated by a passenger.
4. Rating approach
Multi-criteria decision-making (MCDM) framework is used to evaluate the advantages and disadvantages of the alternatives on the basis of multiple criteria, especially when there are different options with multiple potentially conflicting dimensions, which cannot be evaluated by the measurement of a simple, single dimension. The multiple criteria evaluation (MCE) approach is the appropriate method to define the role/ranking of each airport within a certain group of competitors with similar characteristics.
Applying multi-criteria approach in this analysis, aims to evaluate the ranking of each airport in relation to the best-performing airport in the group. To make the different indicators compatible they are adjusted into one measurement unit (comparative scale), by defining that each criterion score will range from 0 to 1. This normalization of the data adjusts the calculated values to the same unit of measurement in an interval range [0–1]. “0” stands for the worst performance and “1” for the best performance for each criterion and is calculated by using the equation:
where pij: the adjusted performance value of airport i on criterion j, xij: the performance value of airport i on criterion j, min(xj): the minimum value of the group’s scores on criterion j, max(xj): the maximum value of the group’s scores on criterion j.
For each airport i in the group, the four criteria categories are defined to identify: (a) airport operational efficiency; (b) airport business resilience; (c) tourism market development; and (d) environmental impact. Overall performance for each airport, i is the sum of the scores on the different “performance ratios” presented above. For the purpose of this analysis, it is assumed that all the criteria selected, affect equally the final evaluation result and an unweighted evaluation is adopted. The total score of airport i, can be formalized as:
where Si: the overall performance of airport i within the selected group of airports, pij: the performance of airport i on each criterion j.
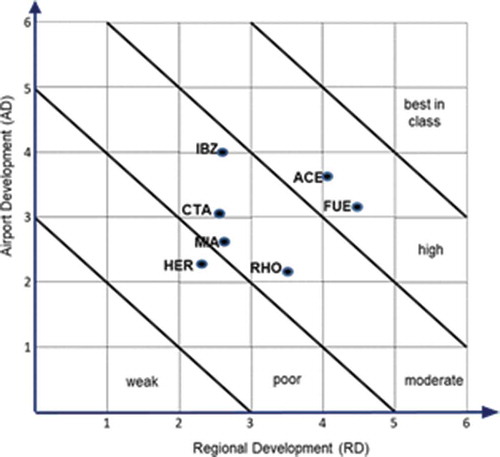
The overall score derived from the 12 selected indexes ranges from 0 (worst performance) to 12 (best performance), while 12 means best productivity performance within the perspectives of an airport’s economic efficiency and business resilience towards regional tourism development and environmental impact. Figure depicts the rating of each airport performance towards tourist productivity, as calculated according to Equations (1) and (2).
Figure 1. Airports’ productivity performance depiction.
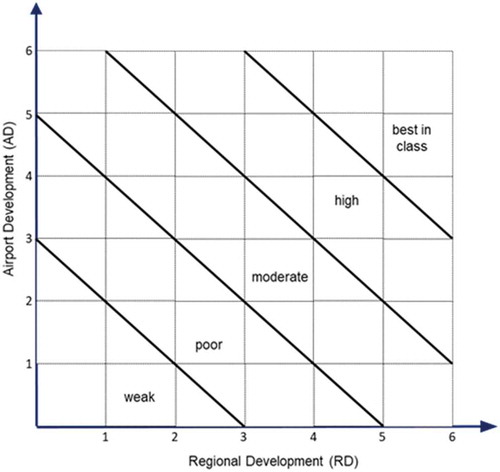
The overall score performance area is divided into five zones, according to Table .
Table 2. Airport productivity performance zones
5. Application
5.1. Airport sample
The evaluation framework is applied to a sample of seven European regional tourist airports located in four different Mediterranean countries (Table ). To ensure comparability of the airports sample, the annual passengers accommodated are chosen to be at a level of homogeneity between 4 and 6 million pax annually. The sample of the tourist regional airports consists of airports located on islands that are extremely important for the regional economic development. Therefore, the analysis outputs provide evaluation scores for a group of competitive airports serving tourist destinations, with similar demand characteristics and operation regulatory framework (Table ).
Table 3. Sample of tourist regional airports
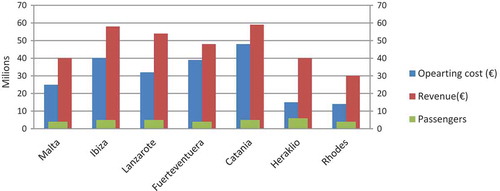
The traffic, operational and financial data (such as operating revenues and costs, number of runways, working capital, etc.) for the airports have been collected by the annual financial and sustainability reports for reference year 2016 (Figure ).
Figure 2. Annual traffic and financial data for the airports sample (reference year 2016).
Malta International Airport (MIA) is managed and operated by Malta International Airport plc. In 2016, MIA accommodated 5.08 million passengers. The airport features two runways and during last 30 years, many investments in terminal, equipment and services infrastructures have taken place.
Ibiza (IBZ), Lanzarote (ACE) and Fuerteventura (FUE) airports are operated by Aena S.A. (formerly Aena Aeropuertos, S.A.) a state-owned company (dependent on the Ministry of Development), operating the most important airports in Spain, and participating in management schemes of 27 airports worldwide. In 2016, the 47 airports and 2 heliports in the Aena network handled a total of 230.23 million passengers and 2.04 million aircraft operations. Ibiza, Lanzarote and Fuerteventura airports accommodated 7.4, 6.68 and 5.67 million passengers, respectively.
Catania–Fontanarossa Airport (CTA), located on the southern outskirts of Catania, is the busiest airport in Sicily and the sixth busiest in Italy. The SAC S.p.A is the operator of the Catania Airport. Catania Airport is a very popular destination for summer vacations for Italian and European tourists. It is noteworthy that Catania–Rome is the busiest air route in Italy and the fourth in Europe. In 2016, the airport accommodated above 7.8 million passengers.
Heraklion Airport is the biggest airport in Crete and the second busiest airport in Greece handling above 6 million tourists a year (accommodated 6.7 million pax in 2016, HCAA, Citation2015). It is operated by Hellenic Civil Aviation Authority, a department of the Greek government under the Ministry of Infrastructure, Transport and Network (HCCA). Given the importance of tourism to the regional economy, there is a need to ensure that the future aviation needs of the island will be met. The airport has constraints imposed by its limited runway length, terminal facilities and safety standards, operational constraints. These issues, coupled with a need to increase capacity, means that there is a need for the reallocation for the airport. Rhodes International Airport is located in the eastern Aegean Sea (Rhodes Island). In 2016, the airport served 4.9 million passengers (HCAA, Citation2015). Improvements and infrastructure investments have been made to the airport, like expansion of taxiways, platform and airport buildings during last years, while the most recent upgrade is a new passenger terminal, in 2005, to accommodate the growing number of charter flights and passengers. Until March 2017, the airport was operated by HCCA.
6. Results and analysis
The results suggest that there are large variations among the seven airports in terms of their different evaluation criteria. The pax per OPEX, for example, demonstrated high variation and different scores even between airports with similar business models. These differences are attributed to the different ownership schemes, affecting the different funding and financing mechanisms. Table summarizes the results for the productivity performance evaluation of the benchmarked airports. As a positive scoring scale (from 0 to 1) is adopted for each criterion and while the total performance of each airport is measured on a scale of 0–12, for every row, the value of “0” is attributed to the minimum performance of the group in the examined criterion, while “1” indicates the best performance within the given scores. The total score for each airport determines its performance in relation to the group.
Table 4. Productivity performance indexes total scores
As analytically depicted in Figure , most airports are placed in the moderate performance zone. Fuerteventura and Lanzarote airports present the highest performance score (7.74) and (7.58), respectively and are placed in the high-performance zone. The high performance of Fuerteventura and Lanzarote airports is driven by the high business resilience and efficient management of the airports, the high GDP of the region and the relatively low environmental disturbance. A strong weak point of Fuerteventura is the airport operational management, thus the score in airport operation efficiency is very low and actions should be taken to improve operation performance. The strongest point that drives the very high performance in RD for Fuerteventura Airport is the perfect location that minimizes the noise disturbance in local communities.
Figure 3. Airports’ productivity performance ranking.
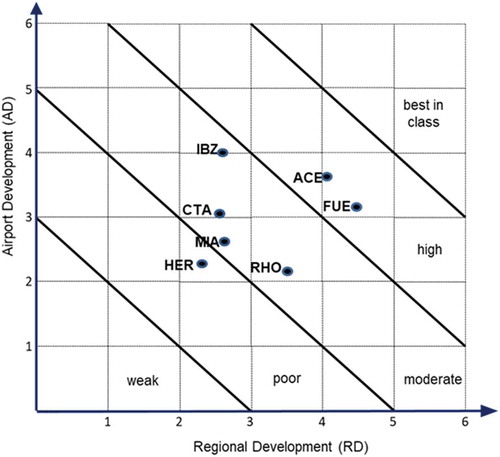
Ibiza Airport also presents a high overall productivity performance (score is 6.65) and is placed in moderate performance zone with tend to reach the high-performance zone. The airport’s high performance is driven by the AD high-performance indicators. On the other hand, RD indicators demonstrate very low performance, especially due to high levels of environmental disturbance in the region. Therefore, the airport seems to focus mostly on business development, without presenting any long-term targets towards a sustainable growth, and should adopt more measures to improve their environmental performance and focus on sustainable strategic development.
Catania and Malta are placed in the moderate performance zone with tendency to reach the poor zone. The airports’ rates on tourism development depict a low total aviation economic footprint despite a good performance on the “ITA/Population” index. Meanwhile, Catania Airport is ranked very high based on airport operational efficiency, but respond to very performance in RD. Malta Airport presents the lowest rate in the “ATM/RUNWAY” index score, which indicates that the investment in infrastructure (construction of a second runway) did not influence the traffic growth. Despite the fact that this enormous runway capacity, when compared to traffic movements, is expected to have a negative impact on the airport’s operational results, the total performance of the airport indicates the low efficiency of the Malta Airport management. Consequently, Malta Airport shows moderate scores, mainly as a result of the low rates of airport business resilience, and should focus on management performance improvement.
Rhodes and Heraklion airports located in Greece show the poorest performance in the AD category with very high rates on the “pax/OPEX”. For these two airports, it is noticeable that the investment is not directly related to airport financial statements because the operator, as a public authority, transfers the investment debts to the national financial statement. As regards RD, Rhodes Airport reveals a high score in environmental impact indicators and contributes significantly to regional sustainability and high performance towards RD. On the other hand, the suburban of the catchment area of Heraklion Airport is exposed to very high levels of aircraft noise, attributing low overall score to RD. Both airports need to improve their management performance in order to meet financial targets. Heraklion airport should also focus on environmental performance management improvement.
Regarding the airports in moderate performance zone, Malta and Heraklion airport performances are driven equal from regional and AD, while Ibiza and Catania present high rates on airport business resilience and thus on AD and not on RD. Rhodes airport is mainly driven form RD indicators. Consequently, Malta, Heraklion, Catania and Rhodes seem more attractive to tourism investment while Ibiza’s AD reveals a mature aviation market. To obtain a more equilibrated collaboration, Ibiza’s airport management strategy should be focused on managing environmental issues while Heraklion, Malta and Rhodes should concentrate on airport operation efficiency improvement.
Key strategies for these airports in the moderate zone are the need for improvement measures towards operation efficiency and business resilience, as well as a need for better coordination of the two markets as for example the extension of the tourism period, the more efficient airport management, and investments in tourism infrastructures in order to improve their market power and respond to the competition.
7. Concluding remarks
Airports serving tourist destinations are essential counterpart of the tourist demand supply chain and their productivity impact essential the region’s attractiveness and RD. Comparative benchmarking of these airports is a tool for measuring their productivity performance in meeting their established goals, by identifying areas of weakness that can be targeted for improvement and conducting comparisons with similar airports to identify opportunities for growth.
This paper deals with tourist airports productivity performance assessment towards RD for regions heavily dependent on tourism. Based on a multi-criterion unweighted analysis and ranking of KPIs essential messages towards airport’s productivity contribution in tourist regions, as well as messages for targets should be set in order to improve their contribution to RD.
The novelty of the methodology framework adopted is that it could be a useful and easy handle tool to support stakeholders, decision-makers, planners and managers around regulation policy, pricing policy and strategic planning to invest in air transport infrastructures, and monitor the airports performance with desirable economic and financial targets as well as social outcomes. The practical and managerial implications provided to industry based on the above methodology framework is to monitor and improve efficiency in sectors of air transport and tourism industry.
Further research on this subject is promoting to be contacted, providing more details on airport’s industry productivity including a larger sample of airports and an extended time window for review the performance outputs. In addition, future lines of research could be to introduce more KPIs based on indicators such as quality of service, satisfaction ratios and conditions of infrastructures. Finally, further analysis could also be the adjustment to introduce more KPIs to discuss results and messages towards governance structure and regulatory framework for managing critical transport infrastructures (e.g. ownership and management scheme, market power and competition).
Additional information
Funding
Notes on contributors
Dimitrios J. Dimitriou
Dimitriou Dimitrios J. is Professor Associate in Department of Economics, Democritus University of Thrace (Greece), on subject of management and economics for transport infrastructures. He holds Doctorate in air transport demand forecasting; MSc in Transport Infrastructures Environmental Planning; MSc in Transportation Planning and Management; and Diploma (equivalent to 4-year BA and 1-year MSc) in Civil Engineering (sector of transportation). His 20 years’ experience in the field of transport shared on three pillars of activities: research, education and consulting. He has participated in many projects in the field of transportation specialized in planning, operation, management, business development, change management, institutional set-up and economics. He has published more than 100 papers in referred journals, international conferences and scientific editions and he has occupied many executive positions in organizations, enterprises and professional associations in field of transport.
Related Research Data
References
- Adler, N., Liebert, V., & Yazhemsky, E. (2013). Benchmarking airports from a managerial perspective. Omega Journal, 41(2), 442–458. doi:10.1016/j.omega.2012.02.004
- AENA. (2015). Statistics. Retrieved February, 2017, from http://www.aena.es/csee/Satellite?pagename=Estadisticas/Home).
- ATAG. (2014). Aviation benefits beyond borders. Geneva, Switzerland: Air Transport Action Group. p. 10,47. Retreived from. https://aviationbenefits.org/media/26786/ATAG__AviationBenefits2014_FULL_LowRes.pdf.
- Benedetti, G., Gobbato, L., Perboli, G., & Perfetti, F. (2012). The Cagliari airport impact on Sardinia tourism: A logit-based analysis. Procedia – Social and Behavioral Sciences, 54(4), 1010–1018. doi:10.1016/j.sbspro.2012.09.816
- Bieger, T., & Wittmer, A. (2006). Air transport and tourism – Perspectives and challenges for destinations, airlines and governments. Journal of Air Transport Management, 12, 40–46. doi:10.1016/j.jairtraman.2005.09.007
- Dimitriou, D. (2016). Climate change implications in aviation and tourism market equilibrium, technological approaches and finances towards climate change adaptation. Climate Change Management, Springer, 24 Chapter, 2016.
- Dimitriou, D. (2018). Mobilities, tourism and travel behavior - contexts and boundaries. In L. Butowski (Ed.), ISBN 978-953-51-3727-6, Print ISBN 978-953-51-3726-9, Publisher: InTech, Chapters published January 17, 2018 under CC BY 3.0 license, doi: 10.5772/intechopen.71597 Retreived from https://www.intechopen.com/books/mobilities-tourism-and-travel-behavior-contexts-and-boundaries/air-transport-economic-footprint-in-remote-tourist-regions.
- Dimitriou, D., Mourmouris, J., & Sartzetaki, M. (2017). Quantification of the air transport industry socio-economic impact on regions heavily depended on tourism. Transportation Research Procedia, 25(2017), 5242–5254. doi:10.1016/j.trpro.2018.02.051
- Dimitriou, D., Voskaki, A., & Sartzetaki, M. (2014). Airports environmental management: Results from the evaluation of European airports environmental plans. International Journal of Information Systems and Supply Chain Management (IJISSCM), 7(1), 1–14. Retrieved from https://www.igi-global.com/article/airports-environmental-management/106824
- Forsyth, P. (2006). Martin Kunz memorial lecture. Tourism benefits and aviation policy. Journal of Air Transport Management, 12(1), 3–13. doi:10.1016/j.jairtraman.2005.09.001
- Fransis, G., Humphreys, I., & Fry, J. (2002). The benchmarking of airport performance. Journal of Air Transport Management, 8(4), 239–247. doi:10.1016/S0969-6997(02)00003-0
- Graham, A. (2006). Have the major forces driving leisure airline traffic changed? Journal of Air Transport Management, 12(1), 14–20. doi:10.1016/j.jairtraman.2005.09.002
- Hellenic Civil Aviation Authority (HCAA) (2015). Statistics. Retrieved February, 2017, from https://www.hcaa.gr.
- Khadaroo, J., & Seetanah, B. (2007). Transport infrastructure and tourism development. Annals of Tourism Research, 34(4), 1021–1032. doi:10.1016/j.annals.2007.05.010
- Lee, W. J., & Brahmasrene, T. (2013). Investigating the influence of tourism on economic growth and carbon emissions: Evidence from panel analysis of the European Union. Tourism Management, 38, 69–76. doi:10.1016/j.tourman.2013.02.016
- Lupo, T. (2015). Fuzzy Serv Perf model combined with ELECTRE III to comparatively evaluate service quality of international airports in Sicily. Journal of Air Transport Management, 42, 249–259. doi:10.1016/j.jairtraman.2014.11.006
- MIA (2015, February). Malta International Airport plc, Statistics. Retrieved from http://www.maltairport.com/en/home.htm.
- Postorino, M., & Praticò, F. (2012). An application of the multi-criteria decision-making analysis to a regional multi-airport system. Research in Transportation Business & Management, 4, 44–52. doi:10.1016/j.rtbm.2012.06.015
- SAC S.p.A. (2015, February). Statistics. Retrieved from http://www.aeroporto.catania.it/sac/l-azienda/dati-di-traffico/.
- Tovar, B., & Martin-Cejas, R. (2010). Technical efficiency and productivity changes in Spanish airports: A parametric distance functions approach. Transportation Research Part E, 46(2), 249–260. doi:10.1016/j.tre.2009.08.007
- Tsui, W. H. K., Balli, H. O., Gilbey, A., & Gow, H. (2014). Operational efficiency of Asia-Pacific airports. Journal of Air Transport Management, 40, 16–24. doi:10.1016/j.jairtraman.2014.05.003
- Ulku, T. (2015). A comparative efficiency analysis of Spanish and Turkish airports. Journal of Air Transport Management, 46, 56–68. doi:10.1016/j.jairtraman.2015.03.014
- UNWTO (2017, September). Tourism highlights report: 2017 Edition, Madrid, Spain. Retrieved from: http://www.e-unwto.org/doi/book/10.18111/9789284419029.
- Wei Lam, S., Low, J., & Ching Tang, L. (2009). Operational efficiencies across Asia Pacific airports. Transportation Research Part E, 45(4), 654–665. doi:10.1016/j.tre.2008.11.003