
 ?Mathematical formulae have been encoded as MathML and are displayed in this HTML version using MathJax in order to improve their display. Uncheck the box to turn MathJax off. This feature requires Javascript. Click on a formula to zoom.
Abstract
This article investigates the performance of moving-average strategies and tests the validity of the weak form of the Efficient Market Hypothesis (EMH) for the Qatari Stock Exchange (QSE). This study uses statistical analyses and adopts the version of the variable moving-average rule where buy and sell signals are generated by comparing a share price’s short- and long-term moving averages. The data include the daily closing share prices of 44 Qatari-listed companies for the period 2004–2017. The analysis shows that the QSE is not weak form efficient because patterns and trends are present in share prices. Sectoral analyses suggest that securities in consumer goods and services, industrials and insurance are the most efficiently priced on the QSE. The evidence suggests that profitability depends on the moving-average strategy selected. The findings may thus benefit technical analysts, fund managers, accountants and academics. This study is one of the first to examine the market efficiency of the QSE using trading rules. This research also suggests the possibility of limited transparency and accounting disclosure in the QSE, which may help policy-makers devise regulations that could improve the QSE’s efficiency.
PUBLIC INTEREST STATEMENT
Research on capital markets, particularly studies that test market efficiency, can be helpful in setting accounting standards, types of accounting practices and corporate financial disclosures that influence investment decisions in capital markets (Kothari, Citation2001). In this study, the researcher hypothesises that if stock markets are efficient, then investors cannot gain returns in the market by using trading rules. However, if the market incurs inefficiencies, then opportunities for gains above the market norm arise (Fifield, Power, & Sinclair, Citation2005, Citation2008). The results show that the Qatari Stock Exchange (QSE) is not weak form efficient because patterns and trends are present in share prices. Sectoral analyses suggest that securities in consumer goods and services, industrials and insurance are the most efficiently priced on the QSE. The evidence suggests that profitability depends on the moving-average strategy selected. The findings may thus benefit technical analysts, fund managers, accountants and academics.
1. Introduction
Research on capital markets, particularly studies that test market efficiency, can be helpful in setting accounting standards, types of accounting practices and corporate financial disclosures that influence investment decisions in capital markets (Kothari, Citation2001). This article studies the Qatari stock market in terms of whether moving-average strategies are profitable and the weak form of the EMH is valid when considering investment decisions in QSE-listed companies. According to the weak form of the EMH, information on past events does not influence the future market prices of listed companies. Rather, future price changes are random and reflect only the current available information. The weak form of the EMH supports this and discounts the impact of historical price trends or patterns on rates of return (Fama, Citation1970). That is, an investor can be certain that the current share price reflects present rather than past information.
Numerous methods are used to test the weak form of the EMH. For example, Butler and Malaikah (Citation1992) and Fama (Citation1965) used statistical analyses to search for patterns in stock-price changes and to determine whether current share price and past returns are correlated. Other researchers examine whether investors who trade using historical prices outperform those taking a passive approach (Almujamed, Alanezi, & Alfraih, Citation2017; Almujamed, Fifield, & Power, Citation2018; Almujamed, Mardini, & Salama, Citation2015; Brock, Lakonishok, & Lebaron, Citation1992; Fifield et al., Citation2008, Citation2005; Hudson, Dempsey, & Keasey, Citation1996; Sweeney, Citation1988). For example, Brock et al.’s work is one of the most commonly implemented methods in the literature, and they analyse a share’s short-term moving-average price compared with its long-term moving-average price to generate signals as to whether to buy or sell. The current work follows the same approach, investigating whether a comprehensive set of moving-average rules influences daily stock prices and the buying, selling and holding of shares on the Qatari market.
Most past research focuses on the emerging markets of South Asia, Latin America or Eastern Europe in terms of the impact of trading rules on these markets (Fifield et al., Citation2005, Citation2008; Gunasekarage & Power, Citation2001; Harvey, Citation1995). Little is known about the stock markets of the Gulf Cooperation Council countries (GCC). In this region, most attention has been devoted to Kuwait, Saudi Arabia and the United Arab Emirates (Al-Khazali et al., Citation2007; Abraham, Seyyed, & Alsakran, Citation2002; Al-Loughani & Moosa, Citation1999; Almujamed et al., Citation2017, Citation2018, Citation2015; Butler & Malaikah, Citation1992; Elango & Hussein, Citation2008; El-Erian & Kumar, Citation1995; Hassan, Al-Sultan, & Al-Saleem, Citation2003). Additionally, these studies mainly use statistical tests, source old data and concentrate on stock-market indices rather than focus on the returns of individual securities and investor interests (Abraham et al., Citation2002; Almujamed et al., Citation2017; Assaf & Charif, Citation2017; Butler & Malaikah, Citation1992; Charfeddine & Khediri, Citation2016; El-Erian & Kumar, Citation1995). The present article contributes to the literature because it one of the first to examine the market efficiency of the QSE using trading rules and considering the stage of development of the State of Qatar. This study examines the results of using trading rules that have only recently been used in Qatar. Specifically, the strategies of investors using moving-average rules are compared to those of passive investors who use information on the share prices of individual companies when making trading decisions. The study findings based on data from a typical emerging market should offer valuable policy insights for Qatar’s regulatory authorities focused on improving the QSE’s overall efficiency. Such improved understanding may lead to developments that attract more international investors to the QSE. Further, the current research should yield insights for local and foreign investors as well as for analysts who wish to understand exactly how the market has behaved during the last 14 years and how moving-average rules actually work in an emerging stock market such as the QSE. In the future, researchers can build on the current findings by testing the performance of other trading rules for companies listed on the QSE.
2. Background about Qatar
Qatar’s economy grew significantly from 2003 to 2017. Increased production of oil and gas permitted the country to diversify its economy, which in turn further contributed to GDP growth. GDP per capital increased from $US31,897 in 2003 to $US60,810 in 2017, or fully 90.6%, one of the highest growth rates in the world (IMF, Citation2017). While Qatar’s economy witnessed growth during the last two decades, the stock market was also developed; the Qatari stock exchange officially opened as the Doha Stock Exchange in 1997, with 18 listed companies (Ghaida, Ousama, Hammami, & Shreim, Citation2016). Over the next two decades, its regulations and operations changed significantly. In 2009, the market received its current name. Subsequently, it entered into a partnership with NYSE Euronext and further developed and restructured. By 2017, the number of listed companies on the QSE had increased to 45 (Qatar Stock Exchange, Citation2018). The Qatar Financial Markets Authority regulates this market to ensure that it maintains fairness and continues to be a safe place for participants to invest in shares of Qatar’s listed companies. These positive developments could indeed attract more foreign investments to the country.
Similar to the other GCC member countries, Qatar lacks its own accounting system. According to Mardini and Almujamed (Citation2015), in 1999, Qatar adopted the International Financial Reporting Standards (IFRS) of the International Accounting Standards Board; it then became mandatory for all companies listed on the QSE to follow these standards, thereby providing investors with accurate and timely financial information on QSE-listed companies. These developments naturally led to the development of a legal framework for financial reporting. This suggests that the QSE meets the needs of current and prospective investors in terms of the financial information they need to make sound investment decisions and in terms of improving the efficiency of the QSE itself. Thus, the researcher in this study hypothesises that if stock markets are efficient, then investors cannot gain advantages in the market by using trading rules. However, if the market incurs inefficiencies, then opportunities for gains above the market norm arise (Fifield et al., Citation2005, Citation2008).
3. Literature review
Research on market efficiency usually concentrates on developed markets, such as the US and the UK (Fama, Citation1965; Fama & Blume, Citation1966; Hudson et al., Citation1996; Sweeney, Citation1988). The findings of studies that investigate past data suggest that these markets are weak form efficient, which occurs when current market returns have little or no correlation with historical returns and the patterns of stock prices over time cannot be used to predict future prices (Fama, Citation1965). That is, the optimal way to invest in this type of market is to use the present information on market prices and to ignore any prior information. This is known as weak form market efficiency. Runs tests used to examine the predictability of share price changes have also shown that no patterns exist (Fama, Citation1965). Examinations of price trends in developed countries have shown that traders using trading rules underperform the passive buy-and-hold approach with a diversified portfolio for a specific time (Fama & Blume, Citation1966; Sweeney, Citation1988). In fact, studies of early stock markets show that share prices tend to be unpredictable and thus have little value to current investors (Fama & Blume, Citation1966; Kendall & Hill, Citation1953). However, a more recent study of the DJIA index in the US for the period 1897–1986, argued that investors can earn profits by using a specific trading strategy (Brock et al., Citation1992). For example, an investor using a moving-average strategy can outperform an investor who takes the passive buy-and-hold approach by more than 0.05% per day. Hudson et al. (Citation1996) and Fifield et al. (Citation2005) reached the same conclusions; however, they noted that transaction costs must also be considered, as they can reduce returns.
The literature argues that stock markets in emerging markets may not be weak form efficient because those markets are often inadequately regulated, have weak accounting standards and rules, have low levels of corporate transparency and disclosure, are slow to present information and have unsophisticated investors (Almujamed et al., Citation2017, Citation2018; Errunza, Citation1983; Fifield et al., Citation2008). Much of the previous literature focuses on statistical tests or the profitability of trading rules for early developed stock markets (Fama, Citation1965; Fama & Blume, Citation1966; Hudson et al., Citation1996; Sweeney, Citation1988). A small number of papers examine the validity of the weak form of the EMH and the profitability of trading rules in emerging stock markets (El-Erian & Kumar, Citation1995; Fifield et al., Citation2008, Citation2005; Gunasekarage & Power, Citation2001; Harvey, Citation1995). However, as data availability improves for emerging stock markets, more studies are focusing on the performance of these stock markets. More studies of stock market performance have also resulted from improved data availability and the desire of governments in developing countries to understand how they can further grow their nations’ economies.
Mobarek and Fiorante (Citation2014) examined countries such as Brazil, Russia, India and China for the period 1995–2010. These researchers found that when they examined recent data for sub-periods of the most recent 5 years, some improvements had occurred in these markets; in particular, the correlations between past returns were much higher in the earlier sub-periods. In another study, El-Erian and Kumar (Citation1995) investigated the efficiency of two Middle Eastern stock markets. For Turkey, they used daily and weekly indices for September 1992 to March 1994, and for Jordan, they used data from December 1988 to April 1993; their findings were that both markets were inefficient. These findings suggest that the trends of price changes and patterns in the current data are similar to those present in past data.
Although few studies have examined markets in GCC countries, an investigation by Charfeddine and Khediri (Citation2016) focused on the weak form of market efficiency for GCC stock markets, including Qatar, for the period 2005–2013. This period is significant for this region because of the political tensions, particularly the Arab Spring. These authors used such statistical methods as generalised autoregressive conditional heteroscedasticity in a mean (GARCH-M) model, which is a technique that studies financial time-series data under conditions of time-varying volatility where periods of calm are interspersed with periods of swings. The results show deviations from market efficiency, particularly during periods of political tension, such as the Arab Spring. In another recent study, Jamaani and Roca (Citation2015) studied all of the GCC countries’ stock markets for the period December 2003 to January 2013 to determine whether they are weak form efficient, either individually or as a group. Here, parametric and non-parametric unit root tests and the Johansen cointegration tests for daily indices indicated that these markets are not weak form efficient. The authors suggested that these market inefficiencies can be attributed to the high concentration of shares in the banking and finance sector in these countries and the low degree of foreign participation.
Assaf and Charif (Citation2017) investigated informational efficiency in a set of 10 emerging MENA stock markets, including Qatar, using variance ratio tests and unit root tests for a sample period from 1 May 2005 to 26 April 2012. The results showed that Qatar is the most volatile market within the MENA region and does not appear to be weak form efficient.
Studies of the performance of trading rules in the GCC region are the most relevant to the current paper. For example, Al-Loughani and Moosa (Citation1999) and Almujamed et al. (Citation2017) use moving-average strategies to study whether the weak form of the EMH applies to this region. In an earlier study, Al-Loughani and Moosa (Citation1999) examined the performance of eight moving-average rules and compared them to the outcomes of the hypothetical passive investor who used weekly data for two sample periods for the Kuwait stock exchange (KSE) index from 27 August 1986 to 12 March 1997. Their findings show that investments made using moving-average rules outperformed those using the buy-and-hold strategy, thereby suggesting that the KSE was not weak form efficient. In a later study, Almujamed et al. (Citation2017) investigated moving-average rules using the daily closing prices of the KSE’s official price index for the period 2000–2015. The study found that moving-average strategies can successfully predict returns on the KSE. Their findings suggested that despite the introduction of new regulations to the KSE, improved accounting disclosures, and the development of market microstructures, the market did not pass the EMH tests.
To resolve the conflicting views found in the literature, this article tests a more recent and longer period of historical data and individual shares and uses non-parametric tests such as strategies related to moving averages.
4. Data and methodology
This article’s empirical work is based on the daily closing share prices of 44 companies for the period 5 January 2004 to 1 September 2017. The data were obtained from both the QSE and Datastream. Table reports the details of the 44 firms used for this research. The table shows that the sample firms were drawn from seven different industries and ranged in size, as measured by market capitalisation, from QR155.92m (QGMD) to QR121752.8m (QNBK). Thus, a good mix of firms was included in the analysis. Further analysis shows that, on average, companies listed under banks and financial services are all classified among those firms with large capitalisations. An analysis of the final column of Table indicates that in 2016 the vast majority of the firms were profitable and that only three firms incurred losses that year. The table also shows that, on average, firms in the consumer goods and services and industrials sectors had the highest earnings per share, while VFQS—a firm in the telecom industry—reported losses.
Table 1. Samples
The tests in this research are based on both the share prices and the natural logarithms of the securities’ returns, which were calculated according to the following equation:
where Ri,t is the return for the shares of company i in day t, Ln is natural logarithms of the shares’ returns, Pi,t is the price of the shares of company i in day t, and Pi,t—1 is the price of the company’s shares on the previous day.
Table highlights the descriptive statistics for the daily returns of the shares of the sample companies. An analysis of the table highlights a number of points. First, the means of the average daily returns of the sample firms were very small; they varied from a low of −0.00065 for QGRI to a high of 0.00055 for QFBQ. Second, most (52.2%) of the average returns for the sample firms were positive, which implies an upward trend in the share prices of most firms during the 14-year period studied. The standard deviation figures associated with these returns also appear to be small; they varied from a high of 4.20% for UDCD to a low of 1.4% for VFQS. Also, it appears that, for the firms in the study, there is no strong link between the mean and the standard deviation of their returns. For example, the best performing share (QFBQ) and the worst performing one (QGRI) had relatively similar standard deviations of 2.1% and 3.3%, respectively. In addition, Table shows that, for the firms in the sample, the firm’s sector influences its returns. For example, the shares in real estate companies were, on average, among the best performing as they recorded relatively low standard deviation values. By contrast, insurance shares were, on average, the worst and more volatile and had a higher risk.
Table 2. Descriptive statistics
Third, the skewness and kurtosis for the firms being investigated reveals that, in most cases, the distributions of share returns are not normal: 42 of the 44 firms had skewness statistics that are statistically different from zero. Of these significant skewness statistics, 16 are positive and 28 are negative, suggesting that most of the firms’ returns series have a large tail of negative values. The kurtosis values are even more emphatic in that they confirm that the distributions of the returns series are non-normal; the values of this statistic for all of the shares in the sample were more than twice their standard errors. This finding suggests that statistical tests, which are based on the assumption of normally distributed data, may not be appropriate. Thus, care must be exercised when examining the outcomes of parametric tests and greater emphasis must be given to the results of the various trading rules.
4.1. Autocorrelation testing
The autocorrelation coefficient calculates the correlation between the value of a variable at time (t) and its value k periods earlier (t-k). This test can indicate whether there is a significant relationship between the current and lagged values of a series by comparing the coefficients to their standard errors. The null hypothesis of no significant association can be rejected if the coefficient is significantly different from zero at the 5% level. Rejection of the null hypothesis would suggest that the current share price changes can be predicted from their past values, which would contradict the weak form of the EMH. Autocorrelation was thus calculated as follows:
where ρk is the correlation coefficient of the time series r (t) with its lagged values, represents the return on a share at time t, and K is the lag length where k = 1, 2, 3, 4 and 5 days.
Several studies using both the US and the UK data explore the size of the autocorrelation coefficient for share price changes and show that these coefficients are not significantly different from zero (Fama, Citation1965; Kendall & Hill, Citation1953). Middle Eastern countries, autocorrelation tests also indicate that the estimated coefficients may not be statistically significant (Butler & Malaikah, Citation1992; El-Erian & Kumar, Citation1995). For instance, Butler and Malaikah (Citation1992) used daily and weekly data for the 36 and 35 most liquid shares listed on the Kuwaiti and Saudi stock markets, respectively. The authors found that the correlation coefficients for 23 of the 36 (64.0%) Kuwaiti shares were not statistically significant at the 5% level for the first lag. In the current investigation, autocorrelation statistics are calculated for Lag 1 to Lag 5. Obviously, different lag lengths could have been selected, but the lags tested here appear to be commonly used in the literature and thus allow for easy comparison of the current results with previous findings (Brock et al., Citation1992; Butler & Malaikah, Citation1992; Fama, Citation1965).
4.2. Runs tests (non-parametric)
A runs test is a non-parametric test that does not require the data series to be normally distributed. It examines changes in the sign of share price changes and investigates whether any patterns are present (Butler & Malaikah, Citation1992). A run is a sequence of consecutive price changes of the same sign. Share price changes can be positive (+), negative (-) or no change (0). The randomness of a series is then analysed by comparing the actual to the expected number of runs. When the actual number of runs differs from the expected number by a significant amount, the null hypothesis of a random series can be rejected. If the number of actual runs is significantly higher than the expected number of runs, this suggests that prices are changing direction very frequently. By contrast, if the number of runs is lower than expected, this indicates that there may be a trend in the share price series.
The actual runs (A) are then counted and matched to the expected number of runs (E) under the assumption of independence as in the formula (3):
where N is the total number of return observations, and ni is the sum of the price change for each sign. For a large number of observations (N > 30), E approximately corresponds to a normal distribution with a standard error (σE) of runs as identified in formula (4):
The Z-statistic tests the null hypothesis, which states that the number of actual runs is equal to that which would be expected in a random series. A positive (negative) Z value is obtained when the actual number of runs exceeds (falls below) the expected number of runs. A positive (negative) Z value indicates negative (positive) serial correlation in the return series.
4.3. Trading rules (moving-average rules)
As already noted, investors have a number of options to choose from in terms of investment strategy. Some study the moving averages of share prices, selecting the periods by number of days; others that the passive approach of using the buy-and-hold strategy for only the current information on a firm. This study looks at the various moving-average strategies and compares the trading rule, by length of period, to the buy-and-hold strategy, in terms of profits earned. The idea, here, is to determine whether the various trading rules outperform the strategy of buy-and-hold. Moving-average strategies are based on past information on a firm, including the share price and its trend over a specific number of trading days. If this strategy can generate higher returns than the buy-and-hold strategy, then the weak form of the EMH is rejected and the market is considered inefficient. However, if the returns from the moving-average strategies are less than or equal to the returns from the buy-and-hold strategy then the weak form of the EMH is supported (Fifield et al., Citation2005).
In this study, the weak form of the EMH for the QSE is investigated using 12 moving-average rules. Here, this study adopts the variable moving-average rule employed by Brock et al. (Citation1992). In this rule, when the moving-average goes above the long moving-average by an amount larger than a bandwidth, then this generates a buy signal; if shares are purchased, then they are held until a sell signal occurs. If the share price goes below the moving-average by an amount larger than a bandwidth, then it generates a sell signal (Brock et al., Citation1992).
Using bandwidth as a measure avoids the hazard of trading when the short-run share price is marginally above or below its long-run moving-average. According to Brock et al. (Citation1992), avoiding the bandwidth “whiplash” signals that can occur in such cases also reduces the incidence and number of trades, thereby reducing the number of transactions and their costs.
A number of variable moving-average rules are used to investigate the performance of moving-average rules; these include one 1-day period (short-run), four periods of 50, 100, 150 and 200 days (long-run), and three bandwidths of 0.0, 0.01 and 0.05. For example, a study on the moving-average rule of (1, 50, 0.01) would be looking at the rule that applies to a short-run period of 1 day, a long-run period of 50 days, and a 1.0% bandwidth. The profitability of investing according to this scenario is then compared to the returns earned by using the buy-and-hold strategy.
As other studies have also used these particular rules to study the same topic for other countries, the results of this investigation can be cross compared (Almujamed et al., Citation2017, Citation2015; Brock et al., Citation1992; Fifield et al., Citation2005).
Third, research also follows the assumptions proposed by Fifield et al. (Citation2005, Citation2008). They are as follows: First, it is assumed that the investor enters the market to purchase shares (a buy position); s/he buys the shares and holds them until they receive a sell signal, at which point the investor sells the shares and stays out of the market until they see the next buy signal. The investor repeats this process throughout the period. Second, it is assumed that each investor has a limited amount of cash, uses all of their money in each buy transaction, and is not allowed to borrow to purchase or sell securities. Third, it is assumed that the profits generated from the purchase and sale of shares, under the moving-average rules, are not reinvested. Fourth, since the QSE does not allow short selling, this does not occur. Multiple buys (sells) are not permitted; and a security must be sold before another can be purchased.Footnote1 Finally, any interest earned when an investor is out of the market is not included.Footnote2 We believe that these assumptions make this study more realistic and bias the results against finding any evidence of generating profits by using the moving-average rule.
The analysis looks at the returns generated by the buy-sell transactions according to the rule of moving-averages. It then compares them with the earnings generated from a buy-and-hold strategy for the same period, assuming that the investor buys the stock on the first day of the period and holds it until the last day, and then sells the stock. The difference, here, is in the number of transactions over the period. That is, when the returns from both strategies are calculated, they take into account the transaction cost of 0.40% on the QSE. Including transaction costs makes the study more realistic and less subject to the criticisms incurred by studies that ignored the impact of transaction costs on net earnings (Huang, Citation1995; Sweeney, Citation1988).
5. Empirical results
5.1. Autocorrelations
Autocorrelations were calculated for the daily returns of the Qatari listed firms for the period 5 January 2004 to 1 September 2017 for lags of 1, 2, 3, 4 and 5 days. The coefficients in the table show whether any of the price movements for the last 5 days can help in forecasting the current share return. An analysis of the results in Table shows that 92 of the 220 autocorrelations are positive, while 128 are negative. For 28 (63.6%) of the 44 firms the autocorrelation coefficients are significant at the first lag, indicating the presence of serial dependence among the daily returns for these companies. The coefficient varies from a low of −0.2133 (DBIS) to a high of 0.1462 (QNCD). For the entire sample, only 51 autocorrelation values are statistically significant, which represents 23.18% of the 205 coefficients calculated; according to Table , 28, 12, and 1 significant autocorrelation values were documented for lags 2, 3, 4 and 5 respectively. In addition, the mean for the lag 1 autocorrelation is −0.0167. Therefore, there is very little evidence to reject the null hypothesis that past returns can help in predicting current share price changes. Overall, the autocorrelation findings appear to support the weak-form of the EMH, although a small amount of inefficiency may exist at very short lag lengths. These results are relatively similar to those reported in Fama (Citation1970) for the NYSE.Footnote3 The autocorrelation results also support the findings of studies for the KSE such Butler and Malaikah (Citation1992)Footnote4
Table 3. Autocorrelation statistics
Table 4. Results of the runs test
Table 5. Results of moving average rules
Table 5. (Continued)
Table 6. Analysis of variance (ANOVA) of the difference between moving average rule returns and the profits of the buy-and-hold strategy
5.2. Runs tests
Table reports the findings of the runs test. The table is divided into seven columns: the firm code is given in the first column while the numbers of price changes less than or equal to and greater than zero are given in columns two and three, respectively. The fourth column indicates the expected number of runs for a random series while the fifth column shows the actual number of runs present in the share price series. The penultimate column includes the Z-statistic which tests the null hypothesis that the actual number of runs differs from that expected in a random series. The p-value for this Z-statistic is shown in the final column of the table. A visual inspection of the table reveals that, for most of the firms (56.8%) in the sample, the difference between the actual and expected number of runs is not statistically significant. Indeed, the Z-statistics are insignificant in 25 of the 44 cases considered; the p-values are all more than the critical value of 0.05. Of the 44 firms in the sample, 21 produced negative Z-values indicating that fewer runs occurred than were expected, suggesting that trends may be present in the share prices of these securities. Therefore, the null hypothesis can be rejected for 19 firms (43.18%) in the sample. This percentage is much lower than that found by Butler and Malaikah (Citation1992). Overall, any judgment about the efficiency of the market cannot be made based on evidence from two tests. Trading rules like moving-average rules need to be investigated in order to reach a more considered conclusion about the efficiency of the Qatari-listed companies.
5.3. Moving average rules
From Table it appears that investors using the buy-and-hold strategy achieved an average return of −3.4% for all 44 firms in the sample; only 14 of the 44 shares purchased achieved positive returns, thus, suggesting that their market value slightly declined over the 14-year period studied. The findings from the buy-and-hold strategy reveal that large-size firms outperformed small- and mid-sized companies. For example, a passive investment in large firms, such as QNBK, IQCD, ERES, MARK and QIBK, generated returns of 128.26%, while small- and mid-sized companies reported losses of −228.86% and −50.51%, respectively. Most of the profitable firms (64.2%) were from the consumer goods and services and industrials sectors (ZHCD, MCGS, QFLS, WDAM, MERS, QIMD, IQCD, QIGD and QEWS). This confirms the finding from the descriptive statistics that firms in these sectors were the most profitable on the QSE, during the period investigated. Indeed, most of the firms in the consumer goods and services sector (5 out of the 9) achieved returns that ranged from a high of 511.9% for the firm MERS, to a low of 91.0% for the firm MCGS. Moreover, an analysis of the results for firms in other sectors shows that all firms in the insurance and telecoms sectors and the majority of the firms in banking and financial services, real estate and transportation recorded losses after using the buy-and-hold strategy.
Table also shows that the number of trades ranged from a high of 344 for the rule of (1, 50, 0.0), to a low of 2 for the rule of (1, 150, 5.0) and the rule (1, 200, 5.0). Moreover, introducing the bandwidth significantly decreased the number of trades. For instance, with the strategies of using the rule of (1, 50, 0.0), a bandwidth of 5.0% reduced the number of trades, on average, from 197.1 to 38.9. Therefore, an investor who followed the strategy of the rule of (1, 50, 5.0), over the 14-year period studied, would only have made about 39 transactions for each share. A more detailed investigation of the number of trades for the individual firms in the sample reveals that the rule of (1, 50, 0.0) for the firm QIMD generated the largest number of transactions, at 344, while the firm MPHC is associated with the smallest number of transactions, at 2, when the (1, 200, 5.0) rule is tested.
Table also shows that when the difference between the profits using the moving-average rule strategies and the returns from the buy-and-hold strategy are compared, the differences are positive for 8 of the 12 moving-average strategies. Indeed, all of the moving-average rules except the (1, 50, 0.0), (1, 100, 0.0), (1, 150, 0.0) and (1, 200, 0.0) outperform their buy-and-hold counterparts in the QSE. These findings are not different from the results reported by Almujamed et al. (Citation2015; Citation2017) and Fifield et al. (Citation2005) that suggest that the moving-average rules perform well in emerging stock markets. Almujamed et al. (Citation2015) shows that, in the Amman stock market, 6 out of 10 moving-average rules were profitable and outperformed their buy-and-hold counterparts.
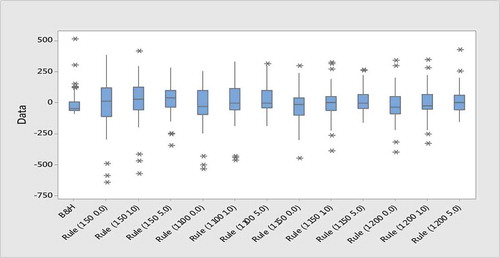
Figure provides a complete picture of the profitability of the moving-average rules and the buy-and-hold strategy. The box plots of this figure show the distribution of the profits (losses) of all of the moving-average rule sizes and the buy-and-hold strategy; the figure summaries the results of the moving-average strategies. Overall, the results are similar to those shown in Table . However, Figure shows that none of the medians across the moving-average rules underperformed the buy-and-hold strategy, which suggests that the moving-average rules performed better than their buy-and-hold alternatives. Moreover, it appears that some outliers are present in the results, which suggests that some shares generate enormous profits for most of the moving-average rules. For example, when the (1, 200, 5.0) rule is employed, a firm such as MCGS earns a profit of 422.73%. Therefore, investors could have achieved considerable profits, over the period 2004 to 2017, if they had implemented this moving-average strategy.
Figure 1. Boxplot profits (losses) of buy & hold and all moving average strategies.
These box plots show the distribution of profits (losses) for the buy-and-hold strategy and all moving average rules. Each box plot presents data into five values including: (i) the smallest observation (minimum); (ii) lower quartile (Q1); (iii) median (Q2); (iv) upper quartile (Q3); (v) and largest observation (maximum). Any values beyond whiskers might be considered outliners and marked by *
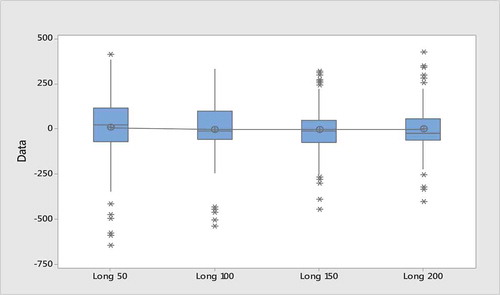
An analysis of these findings and of Figure reveal that the most profitable rule is to take a strategy of a long-run period of 50 days; when the long-run period is increased to 100, 150 or 200 days, however, the performance of these rules deteriorates. Indeed, a long-run period rule of 50 days generated a mean return of 7.12%, while long-run periods of 100, 150 and 200 days produced mean returns of −3.02%, −4.10% and −1.89%, respectively.
Figure 2. Boxplot profits (losses) of all moving average strategies based on long-run period.
These box plots show the distribution of profits (losses) for all moving average rules based on Long-run period. Each box plot presents data into five values including: (i) the smallest observation (minimum); (ii) lower quartile (Q1); (iii) median (Q2); (iv) upper quartile (Q3); (v) and largest observation (maximum). Any values beyond whiskers might be considered outliners and marked by *
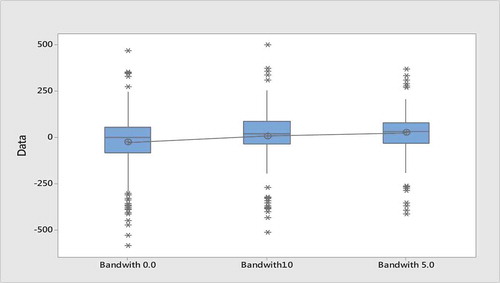
Further, Figure suggests that the introduction of a bandwidth into the trading strategies seems to have had a positive impact on the moving-average strategies. For example, the introduction of 1.0% and 5.0% bandwidths generated mean returns of 7.69% and 25.63%, respectively.
Figure 3. Boxplot profits (losses) of all moving average strategies based on bandwidth.
These box plots show the distribution of profits (losses) for all moving average rules based on Bandwidth. Each box plot presents data into five values including: (i) the smallest observation (minimum); (ii) lower quartile (Q1); (iii) median (Q2); (iv) upper quartile (Q3); (v) and largest observation (maximum). Any values beyond whiskers might be considered outliners and marked by *
Overall, in 60.03% of the cases investigated (317 out of 528 instances),Footnote5 the moving-average strategies outperformed the buy-and-hold approach. This suggests that patterns exist in the QSE. As a result, the moving-average rule tests indicate that the QSE may not be weak form efficient, since a trading strategy that is based on historic data outperformed the corresponding naïve (buy-and-hold) trading tactic.
6. Analysis of variance
A general linear model was fitted to the data in order to explain any variance between the profits earned by using the moving-average rules and the returns achieved by using the corresponding buy-and-hold strategy (Diffs). The purpose of this test is to investigate whether any difference in profits (Rule-B&H) varies systematically, from one sector to another, across different rule sizes or levels. The general linear model also seeks to determine whether any difference in profits is related to the size of the firms (in market capitalisation) analysed in the sample. In explaining the variance in any difference between the profits earned by using the moving-average rules and the returns achieved by using the corresponding buy-and-hold strategy, the model took the following form:
where Diff j (s, r, m) is the difference between the returns generated by using moving-average rules and the profits earned by using the corresponding buy-and-hold strategy for company j in sector s, with market capitalisation m. µ is the overall mean for the difference between the profits earned using the moving-average rule and those earned using the buy-and-hold strategy for all firms across the rules; αs is the main effect for the sector; and βr is the main effect of rule size. (αβ)sr is the interaction effect for sector s and rule size; this allows for the possibility that rule profitability may vary across sectors for different rule characteristics. Finally, αm is the regression coefficient for market capitalisation.
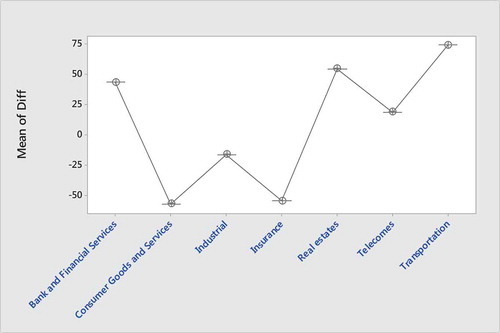
Table shows that the model was capable of explaining approximately 64.1% (R2) of the variation in profit differences. Table shows strong evidence of the differences in profitability between the rules strategy (F = 122.21, p < 0.01), between sectors (F = 23.55, p < 0.01) and between firm sizes as measured by market capitalisation (F = 13.96, p < 0.01). These main factors are statistically significant since the F-ratios are large and the p-values are less than 0.01. Further analysis provides evidence suggesting that the rules behave differently in different sectors: the interaction term had an F-ratio of 5.50 with a p-value of 0.000. Thus, there is evidence that investments using some rules consistently outperformed those using the buy-and-hold strategy in different sectors. The findings from the sectoral analysis and Figure suggest that the securities of firms in the consumer goods and services sector and in industrial and insurance industries, on average, are the most efficiently priced among the shares traded on the QSE. One possible justification for this finding is that the level of transparency and accounting disclosure is much higher for these sectors than for the other industries analysed in the sample. Finally, the investigation shows that selecting the moving-average strategy is extremely important for determining the trading strategy’s overall profitability. It is not surprising that this result is consistent with the substantive body of literature arguing that the selection of an appropriate rule size influences the success of the strategy (Almujamed et al., Citation2017, Citation2018; Huang, Citation1995). This finding is consistent with the results shown in Section 4, indicating that a long-term period rule of 50 days generates the most profitable results.
Figure 4. Difference between the moving average rule profits relative to the buy-and-hold strategy (Diff) across secotrs.
These mean plots show the difference between the moving average rule profits relative to the buy-and-hold strategy (Diff) across different sectors
7. Conclusion
This study investigates the performance of a number of investment strategies and examines the validity of the weak form of the EMH for Qatari-listed companies from January 2004 to September 2017. Autocorrelations, runs tests and moving-average strategies were used to achieve the goal of the study. The findings reveal patterns and trends in the share prices of firms listed on the QSE, indicating that the QSE is not weak form efficient. Thus, if investors had used moving-average strategies based on the price histories of stocks, they could have earned profits. Further, the profitability of the moving-average rules shows that in Qatar, transaction costs of 0.4% have no impact on the earnings of shares that were bought and sold using this strategy. This finding differs from the conclusions of earlier studies that transaction costs eliminated the gains that trading rules achieved (Fama & Blume, Citation1966; Tijjani, Citation2008). This particular conclusion contradicts the present study’s evidence that the transaction costs that the QSE actually imposes can be relatively small. This article’s findings also show that investors’ overall profitability improves when their trading strategy is to use the stock’s moving-average of a 50-day period. Breaking down the findings on a sectoral basis suggests that in the QSE, the securities of firms in consumer goods and services, industrials and insurance are the most efficiently priced. Finally, given the limited transparency and accounting disclosure in the QSE, policy-makers in the State of Qatar should introduce regulations to improve these deficiencies. Such an approach would allow them to better understand the functioning of the QSE, which might in turn lead them to introduce regulatory changes that would improve the efficiency of this stock exchange.
The evidence in this study may be beneficial in supporting technical analysts, fund managers, accountants and academics. Future research on the QSE could investigate a larger number of listed firms, including newly listed firms; it could also test shorter and more recent time periods and investigate a wider range of data and trading rules. Future studies could also incorporate new methods or even more sophisticated statistical tests, such as variance ratio tests, spectral analyses or ARCH tests.
Additional information
Funding
Notes on contributors
Hesham I. Almujamed
Hesham I. Almujamed, PhD is an Associate Professor of Accounting at the College of Business Studies, The Public Authority for Applied Education and Training, Kuwait. He holds a PhD in Accounting and Finance from the University of Dundee, UK. He is Kuwaiti Certified Public Accountant (KCPA) and a Certified Investment and Derivative Auditor (CIDA). He works as a consultant to Deputy Prime Minister, Minister of Commerce & Industry. His research interests include stock market efficiency, trading strategies, the effect of information attributes on how accounting information is incorporated in valuation and forecasts in capital markets, value relevance, accounting disclosure and corporate governance. E-mail address: [email protected].
Notes
1. Some studies found that the trading rules do permit a one-buy transaction to follow another and for the investor to assume that s/he can borrow unlimited funds to leverage any existing long position (e.g. Gunasekarage & Power, Citation2001). However, the current study does not take this approach.
2. It is assumed that no investment is made, such as investing at a risk-free rate of interest when the investor is out of the market. However, the inclusion of investments at the risk-free rate would still not fundamentally affect the results presented in Table .
3. Fama (Citation1970) reported that 37.0% (11 of 30) of large NYSE firms were also statistically significant for the first lag of autocorrelation.
4. Al-Loughani (1995) investigated the autocorrelation for the Price index for the Kuwait Stock Exchange (KSE) while Butler and Malaikah (Citation1992) tested individual shares. For example, Butler and Malaikah (Citation1992) investigated 36 individual shares in the KSE for daily and weekly data and found that 13 firms of the 36 (36.0%) sample firms for the daily data had statistically significant at the level of 5.0% of confidence for the first lag. In addition, they reported that the mean for lag one was 0.053.
5. The number of 528 results from the 12 moving-average rules multiplied by 44 firms.
Related Research Data
References
- Abraham, A., Seyyed, F. J., & Alsakran, S. A. (2002). Testing the random walk behavior and efficiency of the Gulf stock markets. The Financial Review, 37(3), 469–480. doi:10.1111/fire.2002.37.issue-3
- Al-Khazali, O. M., Ding, D. K., & Pyun, C. S. (2007). A new variance ratio test of random walk in emerging markets: A revisit. Financial Review, 42(20), 303–317. doi:10.1111/j.1540-6288.2007.00173.x
- Al-Loughani, N. E., & Moosa, I. (1999). Testing the efficiency of an emerging stock market using trading rules: The case of Kuwait”. Journal of the Gulf and Arabian Peninsula Studies, 95(24), 217–237.
- Almujamed, H., Alanezi, F. S., & Alfraih, M. M. (2017). Are developing stock markets efficient? Evidence from recent Kuwaiti Data. Arab Journal of Administrative Sciences, 24(1), 61–79.
- Almujamed, H., Fifield, S. G. M., & Power, M. D. (2018). An investigation of the weak form of the efficient markets hypothesis for the Kuwait stock exchange. Emerging Market Finance, 17(1), 1–28. doi:10.1177/0972652717748085
- Almujamed, H., Mardini, G., & Salama, M. (2015). Market efficiency of the amman stock market: Evidence from the examination of trading rules. Studies in Business and Economics, 18(1), 51–68.
- Assaf, A., & Charif, H. (2017). Market efficiency in the MENA equity markets: Evidence from newly developed tests and regime change. Journal of Reviews on Global Economics, 6, 15–32. doi:10.6000/1929-7092.2017.06.02
- Brock, W., Lakonishok, J., & Lebaron, B. (1992). Simple technical trading rules and the stochastic properties of stock returns. Journal of Finance, 47(5), 1731–1764. doi:10.1111/j.1540-6261.1992.tb04681.x
- Butler, K. C., & Malaikah, S. J. (1992). Efficiency and inefficiency in thinly traded stock markets: Kuwait and Saudi Arabia. Journal of Banking and Finance, 16(1), 197–210. doi:10.1016/0378-4266(92)90085-E
- Charfeddine, L., & Khediri, K. (2016). time varying market efficiency of the gcc stock markets. Physica A: Statistical Mechanics and Its Applications, 444(C), 487–504. doi:10.1016/j.physa.2015.09.063
- Elango, R., & Hussein, M. I. (2008). An empirical analysis on the weak-form efficiency of the GCC markets applying selected statistical tests. International Review of Business Research Papers, 4(1). Retrieved from http://ssrn.com/abstract=1026569
- El-Erian, M., & Kumar, M. (1995). Emerging equity markets in middle eastern countries. IMF Staff Paper, 42(20), 313–343. doi:10.2307/3867575
- Errunza, V. R. (1983). Emerging markets: A new opportunity for improving global portfolio performance. Financial Analysts Journal, 39(5), 51–58. doi:10.2469/faj.v39.n5.51
- Fama, E. F. (1965). The behavior of stock-market prices. The Journal of Business, 38(1), 34–105. doi:10.1086/jb.1965.38.issue-1
- Fama, E. F. (1970). Efficient capital markets: A review of theory and empirical work. Journal of Finance, 25(2), 383–417. doi:10.2307/2325486
- Fama, E. F., & Blume, M. E. (1966). Filter rules and stock-market trading. Journal of Business, 39(1), 226–241. doi:10.1086/294849
- Fifield, S. G. M., Power, D. M., & Sinclair, C. D. (2005). An analysis of trading strategies in eleven European stock markets. The European Journal of Finance, 11(6), 531–548. doi:10.1080/1351847042000304099
- Fifield, S. G. M., Power, M. D., & Sinclair, C. D. (2008). The performance of moving average rules in emerging stock markets. Applied Financial Economics, 18(19), 1515–1532. doi:10.1080/09603100701720302
- Ghaida, R., Ousama, A., Hammami, H., & Shreim, O. (2016). Do users in qatar perceive intellectual capital information to be value relevant for decision-making purposes? International Journal of Knowledge Management Studies, 7(1/2), 26–52. doi:10.1504/IJKMS.2016.080225
- Gunasekarage, A., & Power, D. M. (2001). The profitability of moving average trading rules in South Asian stock markets. Emerging Markets Review, 2(1), 17–33. doi:10.1016/S1566-0141(00)00017-0
- Harvey, C. R. (1995). Predictable risk and returns in emerging markets. Review of Financial Studies, 8(3), 773–816. doi:10.1093/rfs/8.3.773
- Hassan, K. M., Al-Sultan, W. S., & Al-Saleem, J. A. (2003). Stock market efficiency in the Gulf Cooperation Council Countries (GCC): The case of Kuwait stock exchange. Scientific Journal of Administrative Development, 1(1), 1–21.
- Huang, Y. S. (1995). The trading performance of filter rules on the Taiwan stock exchange. Applied Financial Economics, 5(6), 391–395. doi:10.1080/758538598
- Hudson, R., Dempsey, M., & Keasey, K. (1996). A note on the weak form efficiency of capital markets; The application of simple technical trading rules to UK stock prices - 1935 to 1994. Journal of Banking and Finance, 20(6), 1121–1132. doi:10.1016/0378-4266(95)00043-7
- IMF. (2017). Several bulletins from international monetary fund. Retrieved from http://www.imf.org/external/datamapper/NGDPDPC@WEO/OEMDC/ADVEC/WEOWORLD.
- Jamaani, F., & Roca, E. (2015). Are the regional gulf stock markets weak-form efficient as single Stock markets and as a regional stock market? Research in International Business and Finance, 33(C), 221–246. doi:10.1016/j.ribaf.2014.09.001
- Kendall, M. G., & Hill, A. B. (1953). The analysis of economic Time-Series-Part I: Prices. Journal of the Royal Statistical Society, Series A (General), 116(1), 11–34. doi:10.2307/2980947
- Kothari, S. P. (2001). Capital market research in accounting. Journal of Accounting and Economics, 31(1–3), 105–231. doi:10.1016/S0165-4101(01)00030-1
- Mardini, G. H., & Almujamed, H. I. (2015). The adoption of IFRS 8: The case of Qatari listed companies. International Journal of Managerial and Financial Accounting, 7(3/4), 173–197. doi:10.1504/IJMFA.2015.074898
- Mobarek, S., & Fiorante, A. (2014). The prospects of BRIC countries: Testing weak-form market efficiency. Research in International Business and Finance, 30(C), 217–232. doi:10.1016/j.ribaf.2013.06.004
- QSE. (2018). Several bulletins from Qatar stock exchange. Retrieved January 12, 2018 from https://www.qe.com.qa/statistical-reports
- Sweeney, R. J. (1988). Some new filter rule tests: Methods and results. Journal of Financial and Quantitative Analysis, 23(3), 285–300. doi:10.2307/2331068
- Tijjani, B. (2008). An empirical investigation of the equity investment and share valuation process in Nigeria ( Unpublished Ph.D thesis). University of Dundee, Dundee.