Abstract
This research focuses on the effects on users’ engagement of different tweet forms including text length, text sentiment and the usage of hashtag, mention, video or picture URL. In the first part, we analyze the tweets of five companies from the apparel industry and finds out that there is no universal form that can boost user’s engagement, but in company scale, the effects of different forms between companies are various due to company attributes. Hence, in our second research, we expand the dataset and analyze the formats of tweets from 70 brands focusing on the attribute of the industry section. The conclusion shows that industries such as luxury and hardware technology are more digital sensitive and benefit more using more hashtag and video or picture URL while industry such as software industry is more digital insensitive. The result could provide evidence and guidance for different categories of companies to design tweets with high customer engagements and serve as a reference for enterprises on other media platforms.
Public Interest Statement
With the prevalence of social media, more brands tend to use their official account on social media such as Twitter to enhance brand loyalty and consumer engagement. This perspective article describes some tips for companies to utilize their Twitter account, based on data gathered via TwitteR, a tool provided by Twitter to obtain public tweets data. It finds that shortening or lengthening the tweet, adding more hashtag or mention, or inserting picture or video will not affect the user’s engagement in the same way for different companies. Instead, the effects of different tweets’ form are industry-various. Industries such as software technology and luxury are more digital, sensitive, and can benefit more by using more hashtag and video or picture URL. The retail industry is more insensitive in these tweets’ form changing. So, a company should identify its industry feature first when managing the Twitter account.
Nowadays, as the marketing competition becomes fiercer and more intensive in many industries, an increasing number of enterprises are trying to switch their marketing platform from traditional media to social media (Montague, Gazal, Wiedenbeck, & Shepherd, Citation2016), due to the lower cost and diverse presentation forms for marketing contents (Momany & Alshboul, Citation2016). Twitter, by virtue of its 68 million monthly active users in the United States (Twitter, Citation2018), is currently employed by numerous companies as their marketing channel in America (Momany & Alshboul, Citation2016). In order to establish a deep relationship with users, companies are seeking ways to enhance the users’ engagement with tweets and replies, so that the interactions could impress users and thus build stronger brand loyalty (Syrdal & Briggs, Citation2018) (Burton & Soboleva, Citation2011).
To figure out what kind of format of tweet can attract more customer engagement, a number of scholars have conducted researches on the qualitative analyses on users’ engagement with regards to different advertising formats (Tutaj & Van Reijmersdal, Citation2012) (Kalro, Sivakumaran, & Marathe, Citation2017), but there are few studies on quantitative exploration for it and no quantitative findings show how different formats of tweet influence their customer engagements. Besides easily thinking the richer the content of tweet the better of its customer engagement or the simpler the better, there should be some customized strategy for a specific industry of the company. Therefore, based on the previous researches and existing studies, this thesis analyzes the main elements of tweet formation and how these elements affect the users’ engagements, respectively, so as to provide advice and direction for companies to devise tweets that could arouse more interaction with users.
1. Theoretical basis and data source
1.1. Theoretical basis and model
Tweets include couple different components not only texts but also URL, hashtags and mentions. Their contents show different sentiment scores, which could be a very important factor that influences customer engagement of this tweet. To build a relationship between formats of tweets and customer engagement, we did some research below to find some theoretical supports.
People today rarely communicate with text only, while pictures and videos are used more and more widely in communication (Burnett, Citation2015), including communication in social media marketing. According to the statistics, press releases that include a photo or video get 45% more views than those with text only (James, Citation2012). These media serve as stimuli to influence viewers’ perceiving and consequent engagement (Byrum, Citation2014). In tweets, the URL demonstrates the presence of pictures and videos, so we set the URL number as an independent variable for the engagement measurement.
Another unique and important feature of the tweet is the hashtag. It serves as a metadata tag used on Twitter to facilitate a search for a specified topic of interest (Antoine, Citation2016). For companies, the hashtag can be a supplement to brand image, building community and evoking an efficient response, and companies use the hashtag to launch campaigns, engage directly with consumers (Kleinberg, Citation2013). Thus, the number of hashtags is reasonable to be perceived to influence consumers’ engagement.
Based on the observation of some typical brand tweets, the function of mention (“@”) is sometimes used to mention brands’ stakeholders, who most of the time are celebrities or influencers (Bao, Hua-Wei, Huang, & Chen, Citation2013). Similar to celebrity endorsement, the function of mention indicates the public endorsement of the celebrity to the brand, thus enhancing the followers’ positive attitude (Tang, Ni, Xiong, & Zhu, Citation2015).
When Twitter extents its tweet length limits, many researches were conducted to exam the effect of longer tweets. Some literature already indicate that longer text increases the complexity in perception (Arrabal-Sánchez & De-Aguilera-Moyano, Citation2016), but according to SocialFlow, tweets longer than the old 140-character limit are great for getting attention and engagement (Cho, Citation2012). Tweets that below 140 characters were retweeted on average 13.71 times and received 29.96 likes. Go above 140 characters and the retweets jump to 26.52 and the likes to 50.28 (Sherman, Citation2017). So, the tweet length is set as an independent variable.
Twitter offers a unique dataset in the world of brand sentiment as companies can receive sentiment messages directly from consumers. Both the targeted and competing brands can dissect these messages to determine changes in consumer sentiment (Ghiassi, Skinner, & Zimbra, Citation2013). But the sentiment of tweets posted by the brand can also influence consumer’s engagement, as a strong argument with emotion offers a convincing manner (Byrum, Citation2014). To measure the sentiment of tweets, we use sentiment score as the independent variable.
The concept of customer engagement provides a construct that comprises the total set of behavioral activities toward a firm (Johanna, Veronica, Emil, & Minna, Citation2012), reflecting the broadest theoretical perspectives of the paradigm of services and of relational marketing and is able to provide enhanced predictive and explanatory power of focal consumer behavior outcomes such as brand loyalty (Linda, Mark, Glynn, & Roderick, Citation2014).
As for the measurement of users’ engagement, a comprehensive algorithm formula (Figure .) is referred for the calculation the ratio of weighted engagement on Twitter. (Muñoz-Expósito, Oviedo-García, & Castellanos-Verdugo, Citation2017)
Figure 1. Algorithm formula of engagement on Twitter.
In this algorithm, the terms mean different actions as detailed below:
Interaction of diffusion (I.diffusion): number of Retweet and Share.
Interaction of conversation (I.conversation): number of Reply.
Interation of approval (I.approval): number of Likes.
Other interactions: number of Detail Expands, Embedded Media Clicks, Hashtag Clicks, Follows, User Profile Clicks, Link Clicks, Permalick Clicks, Appinstall attempts, App opens, and Leads submitted.
Number of tweets (No. of tweets): number of tweets that posted by the account.
Average impression: total number of views of a tweet divided by the number of tweets considered over the same period.
Average reach: total number of audience of a tweet divided by the number of tweets considered over the same period.
The algorithm covers all the possible actions of the Twitter users that could enable them to interact with the brand and thus reduces the inaccuracy of the result. Moreover, such a formula is also flexible according to the practical situation. Therefore, we choose it as the original algorithm for Twitter engagement calculation.
In this study, we focus on the engagement for every single tweet, so there is no time period for the measurement of all mentioned actions, impressions and reach, as well as other interactions. Besides, only very few tweets contain reply, so we eliminate the effect the reply in the algorithm to reduce further bias. Therefore, only Interaction of diffusion and Interaction of approval are left in terms of user interactions, and their original ratio 3:1.5 could be simplified to 2:1. Furthermore, the number of impressions is almost the same to that of reach, and hence the calculation “impressions/reach” in the algorithm is equal to 1. So, the below-revised algorithm formula will be adopted in the calculation and analysis. (Figure )
Figure 2. Revised algorithm formula of engagement on Twitter.
Figure 3. Elements of Tweet Form (Independent Variables) and elements of engagements (Dependent variables).
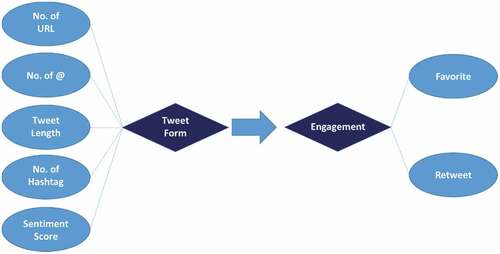
1.2. Hypothesis generation
Therefore, to figure out the influence on customer engagement from the contents of tweets, we make several hypotheses to test the influence contents of tweet and customer engagement. Each type of tweet forms may influence the engagement which can be demonstrated by two attributes, Favorite and Retweet behavior (Figure ).
H1: the number of URL in a tweet will influence the engagement.
H2: the number of hashtag in a tweet will influence the engagement.
H3: the number of at in a tweet will influence the engagement.
H4: the length of a tweet will influence the engagement..
H5: the sentiment of a tweet will influence the engagement.
1.3. Data collection
To extract information such as tweets and followers from each account, we use R Language and the TwitteR package. By requiring and utilizing APIs from Twitter (authentication from twitter developer website, apps.twitter.com), we obtain 3200 tweets at maximum for each account including text content, favorite count, created time, retweet count and so on. To set-up a data set for further analysis, different pre-handling steps are needed (See Figure in Appendix).
2. Data collection and empirical analysis
2.1. Data sample selection
In deciding which companies’ Twitter accounts should be chosen, we exam several criteria to guarantee the quality of rudimental data for further analysis. First of all, the Twitter accounts of these companies must be active, with abundant tweets daily or weekly. It also demonstrates that these companies indeed spend marketing efforts on social media. Besides, all selected companies should be in the same industry to eliminate the potential risk of heterogeneity in different industries (Sevin, Citation2013). Also, the companies should be the leading companies in the industry so that the result can be more instructive to a certain industry. For the measurement of this criterion, we focus on the followers in each account, as more followers mean greater brand awareness and higher possibility of quality communication.
Enlightened by Sevin (Citation2013), we exam Twitter accounts in several industries such as airlines, smartphone manufacturers, supermarkets and apparel. And ultimately, we decide to collect data from apparel industry and specifically, from Forever 21 (@Forever21), Gap (@Gap), H&M (@hm), Abercrombie & Fitch (@Abercrombie) and GUESS (@GUESS). Their Twitter accounts all enjoy hundred-thousands of followers and thousands of “favorite”.
2.2. Data pre-analysis processing
First, tweets returned by TwitteR inquiry contain both original tweets post by the brand and retweets sent to other users. As retweets by the brand are hard to be observed by its followers and usually irrelevant with its own marketing attempt, we exclude from the rudimental dataset about retweets with “mention” as initial in text attribute.
Before data cleaning, we count the number of hashtags and URLs as they are variables that we need in SPSS analysis. Then, as the process of sentiment analysis, we practice data cleaning to the text, eliminating irrelevant information in the corpus, including URLs, punctuation, number and stop words (Feinerer, Hornik, & Software, Citation2017). After the data cleaning, some rows in the data frame are vacant in the text, hence we have to delete these rows too for sentiment analysis (Pak & Paroubek, Citation2010). By Sentiment140 package, we categorize the dataset into three classes: positive sentiments, negative sentiments and a set of objective texts (no sentiments), assigned 1, −1, 0, respectively (See Figure in Appendix).
2.3. Data description
After the data collection and preliminary data process, we finally get a dataset including 316 rows of data. The columns of the table include (1) relevant information: post-data-cleaning text, brand name; (2) independent variables: URL number, hashtag number, mention number, tweet’s length, sentimental score (set positive and negative separately as dummy variable), and (3) dependent variables: favorite count, retweet count, reach, impression and engagement ratio.
From the description of data (Table ), we can see that the average number of favorite count of a tweet is 141.5 and the average number of retweet count of a tweet is 17.75. In our case, the influence on engagement caused by the number of favorites is higher than the number of retweets. Besides, most tweets have no mention and hashtag but have more than one URL. We can see that the median of the favorite count, Retweet count and engagement score are lower than the means, which means there are some extremely big number in these dimensions.
Table 1. Descriptive analysis of the data sample
2.4. Empirical analysis
According to the previous hypotheses and meanwhile considering the law of diminishing marginal utility, we use log-linear regression to test these hypotheses. To avoid interaction influence among companies, we create dummy variables for different companies to decrease the influence caused by companies themselves. Finally, we got the following result.
From the result, we use 95% confidence interval and compare it to a p-value of all independent variables from three different regressions. So, we can have a conclusion to our hypothesis based on the statistical significance.
3. Conclusion
Through in-depth evaluation and comprehensive analysis, we find that all these five independent variables (number of URLs, number of hashtags, number of mentions, length of the tweets, and sentiment of the tweets) do not pose direct influence on users’ engagement of the tweet, which is different to public common sense. Namely, there is a general recommendation for these five companies to spend efforts on specific tweets’ format as the result show that no independent variables will affect the engagement (Table ). But from the regression result, we find that the companies factors (dummy variables in Table ) are statistically significant, which means that different companies have different Twitter performance according to their own format of tweets, their brand image and other individual factors, such as industry section. Rather than analyzing the relationship between the contents of individual tweets and their engagement performance, it is more necessary to explore the tweets difference between companies. So, instead, based on the individual tweets, we conduct a further analysis based on individual companies, to examine if there is any pattern in groups of companies that have similar Twitter performance.
Table 2. R language result of different Tweet Form’s effect on engagement score
Table 3. Result of hypothesis
4. Effect analysis on specific industries
4.1. Data sample selection
In this section, we expand our selection of companies and their Twitter accounts. Because the number of followers can indicate the activity of companies’ social media marketing to some extent and influence the sample size (more followers can have a significant difference in the number of retweets and favorites on different tweets), we choose 100 companies with the top number of followers on Twitter. To eliminate the heterogeneity caused by the followers’ geography, we exclude the companies and accounts that are local-based and finally obtain 70 global companies with a high number of followers. Among them, there are 22 technology companies, 17 luxury brands, 7 game companies 7 retail companies, 5 FMCG companies, 4 auto brand, 2 news companies and 6 others.
4.2. Data description
We collect data from 70 different companies and filter 46,822 pieces’ tweets as our dataset, which have all the factors we need to analyze. We summarize all data in Table , and you can see all tweets have diversified coponents, which give us more chance to analyze the influence of format of tweet on its engagement. As we conclude above, for different companies, their Twitter performance (tweets engagement, the number of retweets and number of favorites) are determined by different factors statistical significantly. For example, some companies’ Twitters performance may be significantly influenced by URL numbers when others may be not by it but hashtag number. Also, the influence can be positive or negative to different companies.
Table 4. Descriptive analysis of the data sample
So, we summarize all the factors that are both positive significant and negative significant for each company and use 1 as the positive coefficient, −1 as the negative coefficient and 0 we present in the table shows that this independent variable is not statistically significant to the specific company. Then, a company with result 1 should enrich its use on this variable. If a factor is significant, we then call the company is sensitive towards the factors and the proportion of these companies in the same industry is the sensitive rate of a factor for this industry.
General speaking, for the influence of tweet contents on engagement, almost 1/3 companies are sensitive on the URL number and hashtag number, reaching 31.43% and 34.29%, respectively. Among these companies, 2/3 of their engagement performance are positively influenced. Mention number has an equal rate in positive sensitive and negative sensitive while the length is mainly a negative influence on engagement with 7.14% positive sensitive ratio and 17.14% negative sensitive rate (Table ). As for sentiment score, it affects the engagement score of companies only in a positive way.
4.3. Data empirical analysis
From Table , we can see that the retail industry is a good category of companies to design different messages to increase companies’ customer engagement. The number of URL, hashtag and sentiment score of tweets have a positive influence on 14.29%, 28.57% and 42.86% of the companies’ customer engagement, respectively, and no negative influence on any company’s customer engagements. Besides, the number of mention and the length of a tweet have a negative influence on 14.29% and 14.29% of the companies’ customer engagement and no positive influence on any company’s customer engagement. All in all, retail companies should make their tweets content including more URL, hashtag and positive words by decreasing mentions and length at the same time to increase customer engagement.
Table 5. Further R Language Result of Different Tweet Form’s Effect on Engagement Score
Table 6. R language result of different Tweet Form’s effect on engagement score for different categories of companies
Besides, the sentiment score has no negative influence on any company’s customer engagement and has a positive influence on 18.57% of the companies’ customer engagement. It positively influences 42.86% of the retail companies’ customer engagement, who are influenced by sentiments score most severely. Generally, people prefer positive content, and companies should take care of their tweets design by making their contents more positive.
Technology companies who based on hardware business have different influences from tweets format design compare with those who based on the software business. Different formats have some influence on 40% of the companies’ customer engagement who are technology companies based on hardware business, but only 14.67% of those technology companies based on the software business. The format design of tweets matters more for technology companies based on hardware business compare with those based on the software business.
Finally, if game companies use more hashtags and fewer mentions in their tweets and technology companies use fewer words in their tweets content, their tweets’ formats will help them to increase customer engagement.
5. Summary
5.1. Conclusion
Based on the comprehensive analysis on tweets from above-mentioned brands and companies, we come up with the conclusion that company marketing teams should design the tweet with considerations toward which category their company lies in, since different forms of tweets will contribute to the different results of engagement score in terms of different categories of companies. For managers, when considering the utilization of Twitter as part of social media marketing strategy, it is better to analyze the Twitter performance of companies similar patterns, in our study, same industry, before generating own tweets content. In that way, managers can recognize whether the company is necessary to manage the Twitter account in terms of social media sensitivity and which tweet format will improve the Twitter engagement at most.
5.2. Limitation
In the study, we focus on the engagement for tweets as our main dependent variable. And we generally indicate that the engagement is the only goal for the company using Twitter. But sometimes the company will use Twitter for other reasons such as announcement which do not care much about engagement. Also, we do not consider the time period for the measurement of the actions, which is hard to obtain from TwitteR. Further study can include these considerations.
Based on our first data analysis, we find the further research necessity on the exam the relationship between tweets’ engagement performance regarding different formats and companies’ different attributes. In this thesis, we only focus on industry section as one feature of companies. Further study can explore other factors that differ the results on tweet performance, to provide other aspects for companies considering applying Twitter.
Besides, the number of companies we select is limited and not applicable to log-linear analysis. So our conclusion about how a company should design the format of its tweet is based on the descriptive analysis. We will expand our database with more companies from different industries to conduct our research and find out statistical significance to approve our conclusion.
Supplemental Material
Download MS Word (47.4 KB)Acknowledgements
This paper is totally conducted by us without other financial supports or direct guides. There is no conflict of interest regarding the publication of this paper. Someone helped us with some useful suggestions are Chen Tao, Minghong Xu and Ling Hu. This paper uses data from Twitter API, which is an open source data analysis access operated by Twitter. We are also grateful for this platform provided by Twitter.
Supplementary material
Supplementary material for this article can be accessed here.
Additional information
Funding
Notes on contributors
Xu Han
Xu Han, Xingyu Gu, Shuai Peng are master of Marketing from Johns Hopkins University Carey business school. In the time when pursuing the master degree, they learnt data analytics with R and conducted course project about studying the data patterns and predicting heart disease for the Cleveland dataset. After the course, they tried to find interesting and realistic problem and lay their interest on social media marketing. They focused on Twitter and analyzed the tweet form’s effect on users’ engagement, as their first academic research for publishing. Currently, Xu Han and Xingyu Gu study further at Carey Business school as master student in Information System and dedicate their time to data analysis utilizing more advanced tools. Meanwhile, Shuai Peng works as marketing Specialist in a digital marketing company, applying his knowledge on analysis about social media.
Related Research Data
References
- Antoine, H. A. (2016). Hashtagging: What you need to know about hashtags as trademarks, hashtag litigation, the FTC, viral campaigns, and more. Computer & Internet Lawyer, 33(11), 6–10. Retrieved from http://search.ebscohost.com.proxy1.library.jhu.edu/login.aspx?direct=true&db=bsu&AN=119547933&site=ehost-live&scope=site
- Arrabal-Sánchez, G., & De-Aguilera-Moyano, M. (2016). Communicating in 140 characters. How Journalists in Spain use Twitter. Comunicar, 24(46), 9–15. doi:10.3916/C46-2016-01
- Bao, P., Hua-Wei, S., Huang, J., & Chen, H. (2013, March). Mention effect in information diffusion on a micro-blogging network. San Francisco: Public Library of Science.
- Burnett, R. (2015, July 6). Images and videos - media for communication. London: MENA Report.
- Burton, S., & Soboleva, A. (2011). Interactive or reactive? Marketing with Twitter. Journal of Consumer Marketing, 28, 491–499. doi:10.1108/07363761111181473
- Byrum, K. L. (2014). A comparison of the source, media format, and sentiment in generating source credibility, information credibility, corporate brand reputation, purchase intention, and social media engagement in a corporate social responsibility campaign presented via soci. Ann Arbor: ProQuest Dissertations Publishing.
- Cho, C. (2012, December). Domains/SocialFlow. PRweek, p. 1.
- Feinerer, I., Hornik, K., & Software, A. (2017, December 6). Text Mining Package “tm”. Retrieved from R-Project: https://cran.r-project.org/web/packages/tm/tm.pdf
- Ghiassi, M., Skinner, J., & Zimbra, D. (2013). Twitter brand sentiment analysis: A hybrid system using n-gram analysis and dynamic artificial neural network. Expert Systems with Applications, 40(16), 6266–6282. doi:10.1016/j.eswa.2013.05.057.
- James, M. (2012, April). The power of pictures in marketing. LIMRA’s Marke Facts Quarter;u, p. 19.
- Johanna, G., Veronica, L., Emil, W., & Minna, P. (2012). Customer engagement in a facebook brand community. Management Research Review, 35(9),857-877. Retrieved from https://doi-org.proxy1.library.jhu.edu/10.1108/01409171211256578
- Kalro, A. D., Sivakumaran, B., & Marathe, R. R. (2017). The ad format-strategy effect on comparative advertising effectiveness. European Journal of Marketing, 51, 99–122. doi:10.1108/EJM-11-2015-0764
- Kleinberg, S. (2013, May 20). To hashtag or not to hashtag?: That is the question - how to use them correctly without going overboard. Chicago Tribune; Chicago, Ill, pp. 2–5. doi:10.1016/j.jhazmat.2013.03.057
- Linda, H., Glynn, M., & Roderick, B. (2014). Consumer brand engagement in social media: Conceptualization, scale development and validation. Journal of Interactive Marketing, 28(2),149-165. ISBN 1094-9968. Retrieved from doi:10.1016/j.intmar.2013.12.002
- Momany, M., & Alshboul, A. (2016). Social media marketing: Utilizing social media to advance brand awareness and increase online sales. International Journal of Business, Marketing, & Decision Science,9(1), 33-54.
- Montague, I., Gazal, K. A., Wiedenbeck, J., & Shepherd, J.-G. (2016). Forest products industry in a digital age: A look at E-Commerce and social media. Forest Products Journal, 66, 49–57. doi:10.13073/FPJ-D-14-00104
- Muñoz-Expósito, M., Oviedo-García, M., & Castellanos-Verdugo, M. (2017). How to measure engagement in Twitter: Advancing a metric. Internet Research, 27, 1122–1148. doi:10.1108/IntR-06-2016-0170
- Pak, A., & Paroubek, P. (2010). Twitter as a corpus for sentiment analysis and opinion mining. Paris: European Languages Resources Association.
- Sevin, E. (2013). Places going viral: Twitter usage patterns in destination marketing and place branding. Journal of Place Management and Development, 6, 227–239. doi:10.1108/JPMD-10-2012-0037
- Sherman, E. (2017, December). A genius way to get more attention for tweets also makes life easier. Retrieved from https://www.inc.com/erik-sherman/a-genius-way-to-get-more-attention-for-tweets-also-makes-life-easier.html
- Sherman, E. (2018, July 16). A genius way to get more attention for tweets also makes life easier. Inc.: A genius way to get more attention for tweets also makes life easier.
- Syrdal, H. A., & Briggs, E. (2018, January 1). Engagement with social media content: A qualitative exploration. Journal of Marketing Theory & Practice, 26, 4–22. doi:10.1080/10696679.2017.1389243
- Tang, L., Ni, Z., Xiong, H., & Zhu, H. (2015, July). Locating targets through mention in Twitter. World Wide Web, 18, 1019–1049. doi:10.1007/s11280-014-0299-8
- Tutaj, K., & Van Reijmersdal, E. A. (2012). Effects of online advertising format and persuasion knowledge on audience reactions. Journal of Marketing Communications, 18, 5. doi:10.1080/13527266.2011.620765
- Twitter. (2018). Number of monthly active Twitter users in the United States from 1st quarter 2010 to 4th quarter 2017 (in millions). United States: Author.
- Twitter Developer. (n.d.). Twitter API reference. Retrieved from https://developer.twitter.com/en/docs/api-reference-index
- Unknown. (n.d.). Sentiment140. Retrieved from http://help.sentiment140.com/home
Appendix A.
Figures below show R codes this study used to catch, clean and reorganize data into formats that can be done further analysis. These codes can be replicable used to address further or related conclusions of this study.
Figure A1. R language code of TwitteR to catch data from Twitter API.
Figure A2. R language code for data cleaning and reorganization.