
 ?Mathematical formulae have been encoded as MathML and are displayed in this HTML version using MathJax in order to improve their display. Uncheck the box to turn MathJax off. This feature requires Javascript. Click on a formula to zoom.
Abstract
this study proposed a model to assess visitor experience quality and its effect on their image, perceived value, delight, satisfaction, and behavioral intentions in Iranian water parks. Based on convenience sampling, a sample of 384 visitors at five water parks in Mashhad, Iran was selected. Data were subjected to partial least squares analysis based on structural equation modeling (PLS-SEM). The findings of this study showed that quality of visitors’ experiences significantly affects water park image, perceived value, and visitor’s satisfaction. Also, water park image significantly affects perceived value, delight, and visitor’s satisfaction. Moreover, perceived value and water park image exert a direct influence on customer satisfaction, and they also positively affect behavioral intentions. But, the visitor’s delight affects indirectly and through satisfaction on behavioral intentions. Therefore, the results of this study will assist water parks management to develop and implement market-orientated service strategies both to increase experience quality and water park image and to enhance perceived value, delight, and satisfaction among visitors. It is hoped such changes will increase visitors’ favorable behavioral intentions such as revisit and positive word of mouth from the water park in the future.
PUBLIC INTEREST STATEMENT
This study is an attempt to explain the impact the quality of experience the water park visitors on behavioral intention by adding the mediating role of water park image, perceived value, delight, and satisfaction. A waterpark is an amusement park that features water play areas such as swimming pools, water slides, splash pads, water playgrounds, and lazy rivers, as well as areas for bathing, swimming, and other barefoot environments. The proposed model is applied in the service and tourism sector of Iran and results show that water parks can improve the image, experience, perceived value, delight, satisfaction, and ultimately their behavioral intentions by increasing the quality of the visitors’ experience. The study also provides the insights for companies active in the field of thematic parks that they must pay intensive attention to improve their behavioral intention through the creation of unique experiences and positive image using designing and organizing of services in such a way as to meet the needs of the visitors.
1. Introduction
Theme parks are a relatively new form of entertainment attraction that attempts to create a fantasy atmosphere of another place and time (Milman, Citation2009).They are an important segment of the tourism and hospitality industry and serve as economic engines for the local communities they operate in (Bigné, Andreu, & Gnoth, Citation2005; Manthiou, Kang, Chiang, & Tang, Citation2016; Tasci & Milman, Citation2017). Hence, these parks have become an interesting and important topic for marketers and activists in the industry (Ali, Kim, Li, & Jeon, Citation2018; Başarangil, Citation2016; Bigné et al., Citation2005; Cheng, Du, & Ma, Citation2016; Geissler & Rucks, Citation2011; Kao, Huang, & Wu, Citation2008; Lin, Morais, Kerstetter, & Hou, Citation2007; Ma, Gao, Scott, & Ding, Citation2013; Ma, Scott, Gao, & Ding, Citation2017; Milman & Tasci, Citation2017; Ryan, Shih Shuo, & Huan, Citation2010; Tasci & Milman, Citation2017; Tsang, Lee, Wong, & Chong, Citation2012; Wu, Li, & Li, Citation2014; Zhang, Li, Su, & Hu, Citation2017).
Pearce (Citation1988) defined theme parks as “extreme examples of capital intensive, highly developed, user-oriented, man-modified, recreational environment”. Among the various types of theme parks, water parks have recently begun to attract the attention of hospitality and tourism scholars interested in better understanding consumer behavior in this unique segment of the attractions industry(Jin et al., Citation2016; Jin, Lee, & Lee, Citation2015; Kim, Citation2006; Lee, Jin, & Lee, Citation2014) .
Although, in order to stay competitive, the continued addition of new and innovative features has long been a part of water park marketing strategy. However, technology alone is not enough to sustain a competitive advantage in the attractions marketplace. Consumers must also believe that an attraction is capable of satisfying their experiential needs. As such, creating and maintaining a meaningful image is an essential part of the marketing management function in the water park industry(Jin et al., Citation2016). Amusement parks are also unique in their product offerings; and unlike other hospitality offerings (e.g., lodging, foodservice, etc.) that feature both hedonic and utilitarian attributes, the amusement park product is nearly exclusively focused on fun and entertainment. Accordingly, marketing strategies in this industry have shifted toward a focus on experience management(Jin et al., Citation2016).
Service quality model, SERVQUAL, has been considered as a critical concept in order to explain customers’ satisfaction and behavioral intention, and the concept has been used in numerous previous studies in the tourism(González, Comesaña, & Brea, Citation2007; Hudson & Shephard, Citation1998; Otto & Ritchie, Citation1996); and hospitality industry(Hu, Kandampully, & Juwaheer, Citation2009; Oh, Citation1999; Olorunniwo, Hsu, & Udo, Citation2006; Qin & Prybutok, Citation2009). However, its measurement does not fully address the specific characteristics of the tourism industry. Because service quality focused mainly on functional features and normally does not cover consumers’ emotional or hedonic tendencies(Parasuraman, Zeithaml, & Berry, Citation1985).
While, Hirschman and Holbrook (Citation1982) found that consumers make purchases not only for functional reasons but also for emotional satisfaction including fun or enjoyment on the basis of their experiences(Jin et al., Citation2015). And they define experiential consumption, alternatively referred to as hedonic consumption, as “those facets of consumer behavior that relate to the multi-sensory, fantasy and emotive aspects of one’s experience with products(Hirschman & Holbrook, Citation1982).” Yuan and Wu (Citation2008) found that the nature of these experiences is critical for the tourism industry because the intangible experience is the core of the products/services offered by businesses. Also, according to Titz (2008), hedonic or experiential consumption is central to a comprehensive understanding of consumer behavior in the hospitality and tourism context(Wu et al., Citation2014). Therefore, researchers have suggested that in the research on satisfaction to be investigated by considering not only include cognitive components but also affective or emotional variables (Duman & Mattila, Citation2005; Lin et al., Citation2007; Zins, Citation2002).Because customers’ satisfaction and behavioral intention have been influenced by various affective aspects as perceived by visitors such as service environment or interpersonal relationship during their consumption experience(Ali et al., Citation2018; Bigné et al., Citation2005; Wu & Ai, Citation2016; Zins, Citation2002). Hence, Researchers such as (Ko and Pastore 2005; Ko et al., 2011; Moon et al., 2011 have modified the concept of service quality in order to define and create a new construct for “experience quality” rather than utilizes a more general category of service quality in diverse sectors.
On the other hand, assessing customers’ experience quality provides a better understanding of consumption’s experiential aspects that include tourists’ affective responses to fulfill psychological desires by participating in theme parks activities (Başarangil, Citation2016; Jin et al., Citation2015; Wu et al., Citation2014). Thus, Improvement in visitor satisfaction and understanding customers’ experiences has become a critical factor for one of the important marketing strategies because positive experiences influence visitors’ post-consumption behaviors, such as satisfaction, image, perceived value, and behavioral intention like revisit intentions, positive word-of-mouth(Başarangil, Citation2016; Jin et al., Citation2015; Wu et al., Citation2014).
Previous research revealed that the fundamental marketing purpose of water parks is to create a pleasurable experience for all visitors(Jin et al., Citation2016, Citation2015) and Ma et al. (Citation2013) believed that an important antecedent to achieving this goal is to ensure that customers’ expectations are not merely met, but are exceeded. Exceeded expectations result in delight, which in turn, lead to the formation and reinforce the positive image of the water parks in the between visitors(Jin et al., Citation2016). However, building and maintaining a positive image is critical because consumers are often willing to incur relatively higher costs if image-based evaluations are positive(Bigné et al., Citation2005).
Finally, in the tourism industry, the ultimate goal of increasing perceived value is to retain satisfied visitors through taking customers’ demands and improving their experience quality. To date, however, empirical studies, related to the water park segment only, largely consider simple antecedents of satisfaction and behavioral intention (Jin et al., Citation2015; Kim, Citation2006; Kwak, Kim, & Lee, Citation2010).
The existing literature review showed that variables such as water park image, perceived value, satisfaction and delight of the visitors play the role of mediation in the relationships between experience quality and the behavioral intentions of visitors. However, the research has not investigated the relationship between them in the form of a comprehensive model, and previous research has only examined some of the variables in their model. Accordingly, the contribution of this research is twofold. First, we seek to better understand the mechanisms through which experience quality and image affect perceptions of value, satisfaction, and delight in a waterpark context. Second, we seek to understand the effect of these relationships on behavioral intentions in this unique setting. We satisfy these objectives via the development and empirical validation of a model of visitor behavioral intentions through the quality of experience, image, value, satisfaction, and perceived delight by them in the waterpark industry. Consequently, this study provides useful insight for both researchers and marketers of the theme park industry, particularly those engaged in marketing water parks as leisure destinations, and in turn, supporting managements’ efforts to develop effective marketing strategies.
The remainder of this paper is organized as follows. The following section discusses the literature review and concepts that are central to the study. The next focuses on the conceptual model and discusses the relationships among the model elements, along with the research methodology and data collection. The final section consists of the findings, implications, and suggestions for future research directions.
2. Literature review
2.1. Behavioral intention
Behavioral intention represents an individual’s efforts to obtain the desired goal (Jin et al., Citation2015). Ajzen and Fishbein(1980)defined as people’s beliefs about what they intend to do in a certain situation. Furthermore, Oliver (Citation1997) defines behavioral intention as “a stated likelihood to engage in a behavior” (p. 28). The behavioral intention variable, which emerged as a dependent variable in tourism (Başarangil, Citation2016; Chen & Chen, Citation2010; Jin et al., Citation2015; Wu et al., Citation2014; Wu, Li, & Li, Citation2016) and hospitality studies (Ryu, Han, & Kim, Citation2008; Ryu, Lee, & Gon Kim, Citation2012), includes intentions like revisit and recommendation to others.
In marketing literature, revisit are defined in different ways, for example, from the view of leisure and recreation, revisit intention by Baker and Crompton, (Citation2000) defined as the intention of visitors to revisit within a year and their willingness to travel often to the destination. In the same vein, Han, Back, and Barrett (2009) revisit intention is described as an affirmed likelihood to revisit the restaurant in both the absence and presence of a positive attitude towards the service provider(Wu et al., Citation2014). Also in the tourism literature, the recommendation to others defined as the willingness to recommend the destination/restaurant to family, friends, and others(Chen & Tsai, Citation2007; Ryu et al., Citation2008). Previous empirical studies related to tourism recognized that image, perceived value, satisfaction, and delight precedes behavioral intention (Chen & Chen, Citation2010; Jin et al., Citation2015; Ma et al., Citation2017; Ryu et al., Citation2008, Citation2012; Wu et al., Citation2016). For example, Chen and Chen (Citation2010) showed a high degree of correlation between perceived value, satisfaction, and behavioral intentions. Hence, in this research, behavioral intention defined as the visitor’s judgment about the likeliness to revisit the same water park or the willingness to recommend the water park to others. Finally, we examine the direct and indirect relationships among the five important structures of experience quality, perceived value, image, satisfaction, delight, and visitor’s behavioral intention in the water park industry.
2.2. Experience quality
The quality of customers’ experience has become a critical concept in consumer behavioral research (Chen & Chen, Citation2010; Cole & Scott, Citation2004; Jin et al., Citation2015; Kao et al., Citation2008; Otto & Ritchie, Citation1996). Conceptualization of the experiential quality encompasses tourists’ affective responses to their desired psychological advantages from a visiting experience (Lian Chan & Baum, Citation2007).
Crompton and Love (Citation1995) define experiential quality as involving “not only the attributes provided by a supplier, but also the attributes brought to the opportunity by the visitor” (p. 12). In the tourism context, the quality of customer experience is preferable towards to the quality of service, since leisure and tourism services are hedonic in their nature and generate consumer experiences (Otto & Ritchie, Citation1996).
In Otto and Ritchie’s (Citation1996) study, differences between service quality and experience quality are discussed. For example, experience quality is subjective in terms of measurement while service quality is objective (Chen & Chen, Citation2010). The evaluation of experiential quality tends to be holistic/gestalt rather than attribute-based, and the focus of evaluation is on self (internal) but not on service environment (external). In addition, the scope of experience is more general than specific, the nature of benefit is experiential/hedonic/symbolic rather than functional/utilitarian, and the psychological representation is affective instead of cognitive/attitudinal (Chen & Chen, Citation2010).
In the tourism context, service quality refers to service performance at the attribute level while experience quality refers to the psychological outcome resulting from customer participation in tourism activities (Chen & Chen, Citation2010; Cole & Scott, Citation2004; Crompton & Love, Citation1995; Mackay & Crompton, Citation1988). The former has been defined as the quality of the attributes of a service that are under the control of a supplier, whereas the latter involves not only the attributes provided by a supplier but also the attributes brought to the opportunity by the visitor (Chen & Chen, Citation2010; Mackay & Crompton, Citation1988). On the other hand, as tourism services are hedonic in nature and generate consumer experiences (Otto & Ritchie, Citation1996), the study of consumer experiences in the tourism the industry is of both theoretical and practical (Bigné et al., Citation2005). In general, the quality visitors perceive is much more associated with their experiences during the process of visitation than services per se provided by the water park. Unlike service quality and its measurement, however, there is still little research shedding light on the experiential quality of specific tourism participation such as water park visitation (Jin et al., Citation2015).
Unfortunately, no consensus seems to exist in the literature on exactly what comprises experience quality. Table lists 13 dimensions of experience quality that could be identified in the literature. Some dimensions (e.g. involvement and peace of mind) are common to different studies and contexts, while other dimensions seem to be unique to a specific context.
Table 1. Dimensions of experience quality
Among the four experience quality dimensions proposed by Kao et al. (Citation2008) in the context of theme parks, namely immersion, surprises, fun, and Participation. The present research considers three dimensions of immersion, surprises, and fun as dimensions of the experience quality of water park visitors. Pine and Gilmore (Citation1999) are defined immersion as the involvement of consumers during consumption, which leads them to forget time and emphasize the consumption process instead of consumption results(Jin et al., Citation2015). Also, Surprise refers to the freshness, specialty or uniqueness perceived(Chen & Chen, Citation2010). And according to Hirschman and Holbrook (Citation1982), it’s an important element in an experience because customers encounter unique stimuli from the unexpected situations during consumption of products or services(Jin et al., Citation2015; Kao et al., Citation2008). Finally, fun relates to the happiness and enjoyment that visitors receive from playing in the water park(Jin et al., Citation2015).
2.3. Water park image
The image is an essential component of the marketing mix and it is regarded as an important competitive strategy component for marketers (Keller, Citation2003). Barich and Kotler (Citation1991) define corporate image as the sum of individuals’ beliefs, attitudes, and impressions toward an organization. Baloglu and Brinberg (Citation1997) also defined the image as “the sum of beliefs, ideas, and impressions that people have of a place or destination.”
The image is also a critical concept in consumer behavior research and literature because it affects people’s individual, subjective perceptions, value for consumers, satisfaction, delight, and behavioral intention (Castro, Armario, & Ruiz, Citation2007; Chen, Citation2008; Cheng et al., Citation2016; Jin et al., Citation2015). Keller, (Citation2003) points out that the image is impacted by a variety of information sources including a firm’s name, the atmospheric environment, characteristics of the product and service offerings, and personal experience.
Kennedy (Citation1997) categorized the image into two functional and emotional components. The functional component of an organization’s image is associated with tangible characteristics while the emotional component is psychological in nature and is often reflected in consumers’ attitudes toward (and perceptions of) a service provider. In general, however, both parts of the image construct arise from direct and indirect customer experiences with the firm(Jin et al., Citation2016). In this research, therefore, the image of water park refers to the overall perceptions of visitors of water parks, in particular, those arising from emotional responses and those influenced by prior experience or vicarious information about a water park.
2.4. Perceived value
Customer perceived value has recently gained a large amount of attention from marketers and researchers because of the important role that it plays in predicting purchasing behavior and achieving sustainable competitive advantage(Cheng et al., Citation2016). Zeithaml (Citation1988) defines perceived value as “the consumer’s overall assessment of the utility of a product or service based on perceptions of what is received and what is given” (p. 14).
In another definition, Lovelock (Citation2000) defined it’s as the trade-off between perceived benefits and perceived costs. And finally, Chen and Chen (Citation2010) declared that perceived value is a comprehensive assessment of tangible and intangible benefits and costs. There is a lack of convergence to provide a single definition of perceived value because the perceived value construct can be analyzed using a one-dimensional measure or a multidimensional scale(Chen & Chen, Citation2010; Sánchez-Fernández & Iniesta-Bonillo, Citation2007).
The one-dimensional measure that rooted in neoclassical economic theory is always criticized be due to its assumption that consumers have a shared meaning of value And according to utilitarian perspective, consumers’ perceived value of a product/service is generally determined by the difference between performance (benefits consumers receive from the product/service) and the sacrifices they make to acquire that product/service(Chen & Chen, Citation2010; Hallak, Assaker, & El-Haddad, 2017). On the other hand, the multidimensional approach to measure perceived value has its roots in consumer behavior psychology, by overcoming the problem of validity, it brings richness and complexity for perceived value construct, but there remains little consensus on the components of this multidimensional construct or how these components are related (Chen & Chen, Citation2010; Hallak et al., 2017; Sánchez-Fernández & Iniesta-Bonillo, Citation2007). A multidimensional measure of perceived value encompasses both the cognitive and affective facets of a product/service; For example, Sheth et al. (1991) have classified the customer’s perceived value into five dimensions social, emotional, functional, epistemic, and conditional responses(Chen & Chen, Citation2010). Alternatively, SERV-PERVAL scale proposed by Petrick and Backman (Citation2002) is another example which includes five dimensions: i.e. quality, monetary price (value perceived in contrast to the price paid), nonmonetary price (value perceived in return for costs, such as time and effort expended), reputation, and emotional response(Hallak et al., 2017).
Given that the main focus of this research is on the conceptualization of experience quality, thus, we measured perceived value by using a multidimensional perspective that encompasses both the cognitive and affective facets(Jin et al., Citation2015; Wu et al., Citation2014). Through which value is measured in terms of the value of quality, monetary price, nonmonetary price, reputation, and emotional response(Petrick & Backman, Citation2002). Several studies indicate that perceived value has been considered as a key component of behavioral intentions in the hospitality and tourism literature.
2.5. Visitor delight
Recently, the concept of customer delight has been gaining attention among researchers as well as practitioners (Ali et al., Citation2018; Ali, Kim, & Ryu, Citation2016; Ball, Ball, Barnes, & Barnes, Citation2017; Jin et al., Citation2016; Kim, Vogt, & Knutson, Citation2015; Ma et al., Citation2013, Citation2017; Torres, Fu, & Lehto, Citation2014). Customer delight has been defined from three different perspectives in the current literature. One definition stresses the expectancy–disconfirmation paradigm. The next group of research stresses the emotional components. Finally, the last school of thought emphasizes human needs(Torres et al., Citation2014).
Expectancy-disconfirmation paradigm (Oliver, Citation1980) stresses consumers compare their actual experience with a service provider to their expectations of the experience (Jin et al., Citation2016), and delight occurs when a customer is pleasantly surprised in response to an experienced disconfirmation toward a company or its product/service experiences (Kim et al., Citation2015). Based on this viewpoint, customer delight can be defined as a positive emotional response. For example, Berman (Citation2005) defined customer delight as customer’s positive response when they receive a service or product that not only satisfies but provides unexpected value (Crotts, Pan, & Raschid, Citation2008). In another definition, delight is defined as an aroused positive emotion coexisting with satisfaction (Alexander, Citation2012; Denning, Citation2011).Also, Finn (Citation2005) defined customer delight as an emotional response which results from surprising and positive levels of performance. Exploring the definitions of the concept of delight clearly shows that it is introduced as a positive emotional response, which helps us to distinguish the structure of delight from satisfaction. Because unlike delight; satisfaction is largely a function of cognition (Plutchik, Citation1980). And delight represents a positive emotion that goes beyond consumer satisfaction (Füller & Matzler, Citation2008). Therefore, Scholars such as Finn (Citation2005) and Torres and Kline (Citation2006) consider delight an emotion that is a combination of high levels of pleasure (joy, elation) and arousal. Pleasure refers to the degree to which a person feels good, joyful or happy in a situation, whereas arousal refers to the extent to which a person feels stimulated and active (Bigné et al., Citation2005).
In the marketing literature, different scales have been used to measure customer delight. Some researchers have measured delight using scales of emotions (Finn, Citation2005; Loureiro, Citation2010). Others, such as Oliver (Citation1997) and Kumar, Olshavsky, and King(2001), have used a single item, “feel delighted”, which certain researchers have later criticized as it does not measure the complexity of customer delight (Ali et al., Citation2018). Among the scales of customer delight measurement, Finn’s scale (Citation2005) has a high level of validity among researchers and has been widely used in hospitality and tourism studies.
2.6. Visitor satisfaction
In general, visitor satisfaction has been considered to be customer satisfaction in academic discussion and literature review and satisfying customers is the ultimate goal of every business, due to its potential impact on repeat purchasing behavior and profits (Ali et al., Citation2018; Jin et al., Citation2015; Ryu et al., Citation2012).
The definition and conceptualization of customer satisfaction vary throughout marketing literature. For example, Oliver (Citation2014, p. 8) defined customer satisfaction as “a judgment that a product, or service feature, or the product or service itself, provides a pleasurable level of consumption-related fulfillment, including levels of under or over fulfillment”. Westbrook and Oliver (Citation1991, p. 84) define it as “a post-choice evaluative judgment concerning a specific purchase selection.” A somewhat more detailed definition is provided by Oliver and Swan (Citation1989, p. 518): Satisfaction is an affective or emotional response to a specific consumption experience, with increasing satisfaction reflecting more positive affect and dissatisfaction reflecting greater negative affect(Goff, Boles, Bellenger, & Stojack, Citation1997). Although the definition and conceptualization of customer satisfaction vary throughout marketing literature; but researchers believe satisfaction is a partly cognitive and partly affective evaluation of a customer’s experience in service settings (Oliver, Citation2014; Westbrook & Oliver, Citation1991; Wirtz & Bateson, Citation1999). In addition, Oliver (Citation1997) has also supported this argument by stating that emotion is essential in understanding customers’ consumption experiences because of its co-existence alongside various cognitive judgments in producing satisfaction(Ali et al., Citation2018). Hence, in the modeling of consumer behavior in service settings, satisfaction should be considered as a cognitive and emotional component.
In this research, according to the definition of Westbrook and Oliver (Citation1991), satisfaction is defined as a post-consumption evaluative by a visitor in association with a water park service, which it is central to understanding visitors’ consumption experiences. While the measurement of the term “satisfaction” in the context of theme parks varied, some researchers have measured satisfaction using a single scale item such as “how satisfied are you that your visit to (this theme park) was worth the total cost to you and your party?” (Geissler & Rucks, Citation2011, p. 132). Others have used multiple scales to measure satisfaction. For example, Ali et al. (Citation2018) applied four items formerly proposed by Westbrook and Oliver (Citation1991) that included “satisfaction with the decision to visit the theme park, a wise choice to choose this theme park, doing the right thing to visit the theme park, and feeling that the theme park visit experience was enjoyable”(Ali et al., Citation2018, p. 7). And Jin et al. (Citation2015) introduced the dimensions of “feeling good about my decision to play” and “my choice to play…was a wise one” (Jin et al., Citation2015, p. 88).
3. Hypotheses development
3.1. Experience quality, water park image, satisfaction and perceived value
Several studies (Aydin & Özer, Citation2005; Chen & Chen, Citation2010; Cole & Illum, Citation2006; Fernandes & Cruz, Citation2016; Jin et al., Citation2015; Kao et al., Citation2008; Wu et al., Citation2016)indicate that experiential quality has been found to positively influence experiential value and experiential satisfaction. Alternatively, several studies (Başarangil, Citation2016; Jin et al., Citation2015; Kao et al., Citation2008; Wu et al., Citation2014) indicate that visitor’s perception of experiential quality is an important predictor for creating experiential value, experiential satisfaction, and image in the context of theme parks. Aydin and Ozer (Citation2005) found that image stems from all of a customer’s consumption experiences, and quality is representative of these consumption experiences. Hence, the perception of experiential quality directly affects the perception of image. Başarangil (Citation2016) showed that the experience quality directly affects on visitors’ satisfaction of the theme parks in Istanbul, and indirectly through satisfaction affects on visitors’ behavioral intentions. Findings of the research Jin et al. (Citation2015) reveal that the experience quality positively and directly affects a customer’s perceived value and water park image in two group of visitors(first- time and repeat visitors). That is, perceived experience quality seems to strengthen the perceived value and foster positive water park image. Also, the results showed that in comparison with repeat visitors, first-timers’ perception of the experience quality is a significantly greater predictor of customer satisfaction. Chen and Chen (Citation2010) have also shown that experience quality has a positive effect on perceived value. Further, both experience quality and perceived value are supported as direct determinants of satisfaction. In addition, both perceived value and satisfaction have significantly direct positive effects on behavioral intentions, while the effect of experience quality on behavioral intentions is insignificant. Nonetheless, an indirect effect of experience quality on behavioral intentions mediated by both perceived value and satisfaction is evident. To sum up, the relationship “‘experience quality/perceived value/satisfaction/behavioral intentions’” can be established. Finally, Wu et al. (Citation2014) demonstrated that not only visitors’ experiences include a relative response to management performance, but also, experiential quality directly influences on experiential satisfaction and image and indirectly affects on revisit intention. Hence, this research hypothesizes:
Hypothesis 1: Experience quality has a positive effect on water park image.
Hypothesis 2: Experience quality has a positive effect on visitor satisfaction.
Hypothesis 3: Experience quality has a positive effect on perceived value.
3.2. Water park image, perceived value, satisfaction and visitor delight
Reviewing the previous studies exhibits that park image positively influences perceived value, satisfaction, and customers delight (Cheng et al., Citation2016; Jin et al., Citation2016, Citation2015; Wu et al., Citation2014). For example, Jin et al. (2015) founded that the water park image plays an important role in shaping visitor expectations, and positive image brings high levels of visitor satisfaction. Also, Jin et al. (Citation2016) have identified the water park image as an important predictor of visitors delight. And show that the positive customer’s image has a positive effect on the customer delight, which in turn, results in customer loyalty. In a study by Cheng et al. (Citation2016), the impact of theme park image on reducing visitor’s switching behavior was investigated through perceived value and visitor satisfaction. The results revealed that improving a theme park’s image is a vital method to generate future revisits, even if a visitor was dissatisfied or had a poor experience. A positive image can suggest that the visitor’s poor experience was a rare exception. Hence, endeavors to build or improve a theme park’s image may reduce switching behavior, thus helping a theme park’s success and tourism development. Lastly, Wu et al. (Citation2014) in a research on visitor’s perception from theme parks in Taiwan showed that the positive visitor’s image of the visit from the theme park has a positive effect on experiential satisfaction and revisit intention. Thus:
Hypothesis 4: Water park image has a positive effect on perceived value.
Hypothesis 5: Water park image has a positive effect on visitor satisfaction.
Hypothesis 6: Water park image has a positive effect on visitor delight.
3.3. Perceived value, satisfaction and visitor behavioral intention
Numerous researchers have verified the significant relationship between perceived value, customer satisfaction and behavioral intention in tourism and hospitality context (Chen & Chen, Citation2010; Jin et al., Citation2015; Ryu et al., Citation2012; Wu et al., Citation2016).for example, Chen and Chen (Citation2010) revealed that experience quality appeared to be a significant predictor of perceived value and that among heritage tourists, perceived value influenced satisfaction and behavioral intention positively and directly. Results of study Jin et al. (Citation2016) demonstrate that satisfaction has a significant mediating role in the relationship between perceived value/water park image and behavioral intention. Furthermore, another important finding of study them is that perceived value is a significant predictor only for repeat visitors’ behavioral intentions. Ryu et al. (Citation2012) examined the role of customer perceived value in explaining consumer behavior in a restaurant and found that customer’s perceived value was a positive and direct antecedent of customer satisfaction. And indirectly, through customer satisfaction affects on customers’ behavioral intention. On the other hand, in the context of medical tourism, Wu et al. (Citation2016) argue that perceived value has a small impact on patient satisfaction, but this construct should not be neglected, since it plays an important role in enhancing the level of patient satisfaction in the medical tourism literature. Despite the small impact of perceived value on patient satisfaction, perceived value positively influences behavioral intentions. Finally, extant research confirms that customer perceived value has been accepted as a reliable predictor of satisfaction (Chen, Citation2008; Chen & Tsai, Citation2007; Cheng et al., Citation2016; Hallak et al., 2017; Hu et al., Citation2009; Hutchinson, Lai, & Wang, Citation2009; Oh, Citation1999; Prebensen, Kim, & Uysal, Citation2016; Ryu et al., Citation2008; Wu, Citation2014) and behavioral intentions(Chen, Citation2008; Hu et al., Citation2009; Ryu et al., Citation2008).Therefore, the following hypothesizes is proposed:
Hypothesis 7: perceived value has a positive effect on visitor satisfaction.
Hypothesis 8: perceived value has a positive effect on visitor behavioral intentions.
3.4. Visitor delight, satisfaction and visitor behavioral intention
ven though empirical studies on the relationships between delight, satisfaction, and behavioral intention are still limited. But studies show that customer delight has a positive impact on customer satisfaction and loyalty. For example, Kim et al. (2015) and Ariffin and Yahaya (Citation2013) have also observed that delight may influence the satisfaction and loyalty of customers in the hospitality industry. Ma et al. (2017) found that visitors’ satisfaction with the experience of visiting the theme parks had a positive effect on behavioral intentions, such as the revisit intention and promote word of mouth. Similarly, in a survey of visitors’ experiences of theme parks in Malaysia, the results revealed that customer satisfaction has a positive effect on satisfaction and loyalty intentions. Therefore, this research conceptualizes visitor’s delight as an emotional response during the service experience in a water park. Hence, this research hypothesizes:
Hypothesis 9: visitor delight has a positive effect on visitor satisfaction.
Hypothesis 10: visitor delight has a positive effect on visitor behavioral intentions.
3.5. Visitor satisfaction and behavioral intention
Many researchers in the various context have supported the idea that satisfaction is a significant determinant of behavioral intentions (Başarangil, Citation2016; Chen & Chen, Citation2010; Cole & Scott, Citation2004; Kao et al., Citation2008; Ryu et al., Citation2008, Citation2012; Wu et al., Citation2014, Citation2016). For example, in a theme park setting, Zhang et al. (Citation2017) found that improving visitor satisfaction level is essential to increase revisit and recommendation intentions. Jin et al. (Citation2015) also tested and confirmed the significant impact of visitor satisfaction on Visitors’ behavioral intention in water parks. Therefore, this research this research hypothesizes:
Hypothesis 11: visitor satisfaction has a positive effect on visitor behavioral intentions.
3.6. The conceptual model
Based on the hypotheses presented in the literature review of the study, the conceptual model is developed in Fig. . The factors of experience quality, water park image, perceived value, visitor satisfaction, visitor delight and behavioral intention are used to test in this model.
Figure 1. conceptual model.
4. Research methodology
4.1. Research sample
The data was derived from a sample of water park visitors in the city of Mashhad. The reasons for choosing the Mashhad as the city studied are:
Mashhad is a city of tourism and pilgrimage.
Having a large number of the water park than other cities in Iran (Five water park).
Many tourists visit Mashhad’s city during the year (Approximately 25 million people).
In this research, Cochran formula is used to determine sample size. Cochran formula for unlimited society:
For the unlimited population, the sample size required was estimated to be 384. Also, convenience sampling method was used to attract respondents. In terms of gender, the distribution of the sample was 60.2% for male and 39.8% for female. According to the Government’s latest census report, by end of 2016, the Iran population’s male and female ratio is 50.66% and 49.34%; Thus the sample appear to be representative in terms of gender. Having analyzed the demographic characteristics of water park visitors (Table ), most of them were figured out to be in the age between 25 and 34(48.7%), followed by those in the range between 24 and less than 24 (31.5%), and those in the age between 35 and 44(14.1%), and lastly those in the age 45+(5.7%); when compared with the Iran population, the spread of age group sampled is comparable with the population profile.
Table 2. Demographic Profile of Respondents
4.2. Validity and reliability
In order to estimate the validity of research instrument four types of validity were estimated; i.e. content validity, face validity, convergent validity, and discriminant validity. For estimating content validity, the number of questionnaires was administered among the experts of marketing and tourism and Professors in the field to estimate the content validity of the instrument. The aim of the questionnaire was testing the appropriateness and relevance of questions related to each variable. Finally, the content validity of the questionnaire was approved.
To confirm the face validity, 40 questionnaires were administered among the sample and the views of respondents about the research and quality of items were collected. After necessary adjustments such as providing examples to clarify some items, the final questionnaire was developed to be distributed among the whole population. In the next stage, in order to confirm the reliability of the questionnaire, its internal consistency was measured through Cronbach Alpha. The alpha reliability was 97 confirming the reliability of the questionnaire. The alpha coefficients of individual variables refer to the appropriate reliability of the instrument. Thus, it was indicated that the questions enjoy appropriate internal consistency, that is, they all measure a common construct.
4.3. Measurement
A research questionnaire was developed with two sections. The first section includes the 6 constructs, experience quality (the second-order structure consists of immersion, surprise and, fun), water park image, perceived value, visitor delight, visitor satisfaction, and behavioral intention in this study. The second section contains respondents’ demographics (gender, age, education, and income).
A 31-item scale measuring was adopted from previous studies. All English items were translated into Persian, and then back-translated by a second bilingual person to ensure meaning consistency. Respondents rated all measures on a 7-point Likert scale ranging from 1 (Completely Disagree) to 7 (Completely Agree). The reason for choosing the 7-point Likert scale is because of most studies conducted on research variables used 7-scale Likert format (Jin et al., Citation2016, Citation2015; Wu et al., Citation2014), hence, the instrument of the present study was also designed in 7-scale Likert format. The second reason for using 7-scale Likert format was the participants of this study who enjoyed the higher level of education compared to other people.
For experience quality (immersion (four items), surprise (three items), and fun (four items)) was adapted from Kao et al. (Citation2008) and Jin et al. (Citation2015). Water park image was measured with four items based on Jin et al. (Citation2016). Perceived value was measured with four items based on Jin et al. (Citation2015) and Lee et al. (Citation2014). visitor delight was measured using three items based on Kim et al. (2013).while visitor satisfaction was operationalized using the four emotion-laden items proposed by Westbrook and Oliver (Citation1991),that was adapted from Ali et al. (Citation2018). Last, the researchers adapted four items for behavioral intention from Basarangil (Citation2016); Jin et al. (Citation2015) and Wu et al. (Citation2014).
5. Data analyses
The hypotheses of this research were tested using partial least squares (PLS) analysis software SmartPLS M3 Version 2.0. The PLS method was adopted because of its suitability for exploratory studies. PLS is a multivariate analysis technique that is ideal for assessing both the psychometric properties of all scales and, subsequently, to test the structural relationships proposed in the model. PLS is relatively robust in a context of deviations from a multivariate distribution and supports both exploratory and confirmatory research (Gefen, Straub, & Boudreau, Citation2000). For this study, the researchers performed the PLS algorithm procedures to determine the significance levels of the loadings, weights and path coefficients, followed by a bootstrapping technique to determine the significance levels of the proposed hypothesis. Following the procedure suggested by Anderson and Gerbing (Citation1988), the researchers estimated the validity and goodness of fit of the measurement model before testing the structural relationships outlined in the structural model. Last, blindfolding procedures were used to determine and assess the accuracy of the tested hypothesis and to obtain .
5.1. Measurement model
In order to evaluate reflective measurement models, we examined the outer loadings, composite reliability (CR), average variance extracted (AVE = convergent validity) and discriminant validity. First, the measurement model was tested for convergent validity, which was assessed through factor loadings, composite reliability (CR) and average variance extracted (AVE)(Hair, Hult, Ringle, & Sarstedt, Citation2013). Table shows that all item loadings exceeded the recommended value of 0.6 (Chin, Peterson, & Brown, Citation2008). CR and Cronbach’s alpha values, which depict the degree to which the construct indicators indicate the latent construct, exceeded the recommended value of 0.7 except for the surprise structure (In connection with the Surprise structure, Moss et al. (1998) cited a value of 0.6 as the border of the Cronbach’s alpha coefficient) (Hair et al., Citation2013), while AVE, which reflects the overall variance in the indicators accounted for by the latent construct, exceeded the recommended value of 0.5 (Hair et al., Citation2013).
Table 3. Validity and reliability of constructs
Discriminant validity refers to the extent to which the measures are not a reflection of some other variables’ and it is indicated by low correlations between the measure of interest and the measures of other constructs. Table shows that the square root of the AVE (diagonal values) of each construct is larger than its corresponding correlation coefficients, pointing towards adequate discriminant validity (Fornell & Larcker, Citation1981).The measurement model showed an adequate convergent validity and discriminant validity.
Table 4. Discriminant validity
5.2. Structural model
This research used SmartPLS2.0 to test the structural model and hypotheses. A bootstrapping procedure was conducted, with 2000 iterations, to examine the statistical significance of the weights of sub-constructs and the path coefficients (Chin et al., Citation2008). As PLS does not generate overall goodness-of-fit indices, is the primary way to evaluate the explanatory power of the model. However, Tenenhaus, Vinzi, Chatelin, and Lauro (2005) presented another diagnostic tool to assess the model fit, known as the goodness-of-fit (GoF)index. The GoF measure uses the geometric mean of the average communality and the average
(for endogenous constructs) (Ali et al., Citation2018). Wetzels et al. (2009) reported these cut-off values for assessing the results of the GoF analysis: GoFsmall 0/01, GoFmedium 0/25, and GoFlarge 0/36. For the model used in this study, a GoF value of 0.59 was calculated, indicating good model fit.
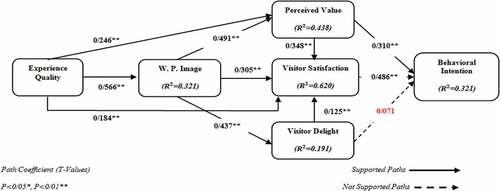
Following the measurement model and goodness of fit, the hypothesized relationships in the structural model were tested. Figure shows the results of the analysis. The corrected s in Figure refers to the explanatory power of the predictor variable(s) on the respective construct. Experience quality explains 32.1%, 43.8% and 62% of changes in water park image, perceived value and, visitor satisfaction, whereas water park image, explain 43.8%, 62% and 19.1% of changes in perceived value, visitor satisfaction and, visitor delight. Also, perceived value and visitor delight explain 62% of changes in visitor satisfaction. Last, perceived value, visitor delight and visitor satisfaction predict 59.7% of changes in behavioral intention. Regarding model validity, Chin et al. (Citation2008) classified the endogenous latent variables as substantial, moderate, or weak, based on the R2 values of 0.67, 0.33, or 0.19, respectively. Accordingly, water park image (
= 0.321), perceived value (
= 0.438), and behavioral intention (
= 0.321) are moderate. While the structure of the visitor’s satisfaction (
= 0.62) is substantial. And finally, the structure of the visitor’s delight (
= 0.191) is weak.
Figure 2. Structural model results.
Besides the size of, the researchers employed the predictive sample reuse technique (
) as a criterion for predictive relevance(Chin et al., Citation2008). Based on the blindfolding procedure,
shows how well the collected data can be reconstructed empirically with the help of the model and the PLS parameters. For this research, the researchers obtained
using cross-validated redundancy procedures, as suggested by Chin et al. (Citation2008). A
greater than 0 means the model has predictive relevance, whereas
less than 0 means the model lacks predictive relevance. As shown in Table,
for water park image, perceived value, visitor delight, visitor satisfaction and, behavioral intention are 0.191, 0.219, 0.126, 0.390 and 0.414, respectively, indicating acceptable predictive relevance.
Table 5. Results of and
Values
By performing the PLS-SEM algorithm, estimates are obtained for the structural model relationships (the path coefficients), which represent the hypothesized relationships between the constructs as shown in Table . According to Hair et al. (2011) critical t-values for a two-tailed test are 1.65 (significance level = 10%), 1.96 (significance level = 5%), and 2.58 (significance level = 1%). According to our empirical findings, H1 (EQ WPI) with path coefficient = 0.566, standard error = 0.043, and t-values = 13.15 was supported. Moreover, H2 (EQ VS) with path coefficient = 0.184, standard error = 0.039 and t-values = 4.62; H3 (EQ PV) with path coefficient = 0.246, standard error = 0.042 and t-values = 5.72; H4 (WPI PV) with path coefficient = 0.491, standard error = 0.046, and t-values = 10.57; H5 (WPI VS)) with path coefficient = 0.305, standard error = 0.058 and t-values = 5.24; H6 (WPI VD) with path coefficient = 0.437, standard error = 0.046, and t-values = 9.36; H7 (PV VS) with path coefficient = 0.348, standard error = 0.071, and t-values = 4.89; H8 (PV BI) with path coefficient = 0.310, standard error = 0.039, and t-values = 7.88 was supported. H9 (VD VS) with path coefficient = 0.125, standard error = 0.038, and t-values = 3.20 was supported. H10 (VD BI) with path coefficient = 0.071, standard error = 0.045, and t-values = 1.55 was rejected. H11 (VS BI) with path coefficient = 0.486, standard error = 0.046, and t-values = 10.52 was supported.
Table 6. Hypothesis Testing
6. Discussion
6.1. Conclusions
The purpose of this study was to establish a model of the direct and indirect effects of experience quality, image, value, delight, and satisfaction on behavioral intentions in the waterpark segment of the attractions industry. The results of an empirical test of the proposed framework demonstrate that the experience quality, waterpark image, perceived value, satisfaction, and delight has positive effects of direct and indirect on behavioral intention. While experience quality was identified as a significant determinant of waterpark visitors’ image, the hypothesized impact of delight on behavioral intentions was not significant.
The results for H1-H3 support a second-order structure for experience quality (Başarangil, Citation2016; Jin et al., Citation2015; Kao et al., Citation2008) in the theme parks industry. The presence of three dimensions of experience quality as perceived by water park visitors is supported by H1-H3. The statistical analyses indicate that quality of experience (0.566) has a stronger effect on water park image than visitor satisfaction (0.184) and perceived value (0.246). This finding is consistent with the study of Jin et al. (Citation2015) that experience quality is a better predictor of visitor intention of visiting at the water parks. Also, Aydin and Özer (Citation2005) found that image stems from all of a customer’s consumption experiences, and quality is representative of these consumption experiences.
H2 and H3 fully support the effect of experiential quality on visitor satisfaction and perceived value, respectively. This finding concurs with the contentions of Başarangil (Citation2016); Jin et al. (Citation2015) and Wu et al. (Citation2014) that experiential quality has been found to be an antecedent of visitor satisfaction and perceived in the theme park’s literature. Also, these findings are consistent with the contentions of prior service-related studies (e.g., Chen & Chen, Citation2010; Wang, 2012; Wu & Li, Citation2014) that the greatest impact on the perceived value and visitor satisfaction of tourism products and services is derived from experiential quality.
Water park image was verified to impact visitor behavioral intention through visitor perceived value and satisfaction (H4, H5). This result agrees with Cheng et al. (2016) and Jin et al. (Citation2015) who claim that improving a water park’s image is a critical method to generate future revisits, even if a visitor was dissatisfied or had a poor experience. A positive image can suggest that the visitor’s poor experience was a rare exception. Hence, endeavors to build or improve a water park’s image may increase behavioral intentions such as revisit intention and word of mouth, thus helping a water park’s success and tourism development.
H6 confirms the positive impact of the image of water park visitors on perceived delight. This result is consistent with findings by Jin et al. (Citation2016) that indicates perceptions of a waterpark, derived both from pre-existing knowledge and personal experience, significantly affect consumer value from an experiential standpoint (i.e., delight). Thus, in the context of the attractions industry, the exogenous effects of a visitor’s image of the service provider are salient throughout the consumption experience.
H7 assuming the positive effects of perceived value on visitor satisfaction are identified. This result agrees with Chen and Chen(Citation2010); Jin et al. (Citation2015); Ryu et al. (Citation2012); Wu et al. (Citation2016) who claim that perceive value plays an important role in increasing a high level of satisfaction in the tourism and hospitality industry. The positive effect of visitor perceived value on satisfaction draws on the logic that cognition triggers affect (Fishbein and Ajzen, Citation1975). Visitor perceived value is considered a cognitive construct since it is determined through a cognitive trade-off between quality and sacrifice. On the other hand, satisfaction is known as an affective construct due to its association with emotion (Oliver, Citation1997). Therefore, visitor perceived value can influence satisfaction in that the cognitive process induces affective responses.
H8 fully supports the effect of perceived value on behavioral intentions. This finding supports the contentions of several researchers (Ryu et al., Citation2012; Wu et al., Citation2016) that perceived value has been considered to be a key predictor of visitor behavioral intentions in the tourism and hospitality literature.
The results clarify the relationship between visitor delight and satisfaction, showing that visitor delight has a positive influence on visitor satisfaction (H9). This result is consistent with findings by Ali et al., (2018). Also, the results of H10 show that the delight of visitors through satisfaction and directly affects behavioral intentions. Hence, the ability of water parks to ensure visitor delight and satisfaction by developing and offering proper customer experiences can act as a competitive advantage, that can in turn lead to behavioral intentions such as revisit and word of mouth.
Finally, H11 postulating the positive effect of visitor satisfaction on behavioral intentions are confirmed. This result concurs with the results of other researchers (Başarangil, Citation2016; Chen & Chen, Citation2010; Jin et al., Citation2015) that a high level of visitor satisfaction can increase more positive evaluations and future behavior such as revisiting or word of mouth the water park.
While these results can be seen as a step forward in the increased consideration of attractions in the hospitality and tourism literature, a number of further opportunities exist in this unique research domain. In the following sections, we consider the implications of these findings.
6.2. Theoretical implications
This research presents a universal evaluation of water park visitors’ perceptions of experience quality by developing and estimating a comprehensive model. The results of this study support the use of a multidimensional approach for conceptualizing and measuring visitors’ perceptions of experience quality, like the models developed by several researchers (e.g., Başarangil, Citation2016; Jin et al., 2015; Kao et al., Citation2008). The results of the measurement model tests indicate that all measurement models for measuring experiential quality and its dimensions have a good model fit. In addition, the results of the reliability and validity tests indicate that the measurement scales for measuring experiential quality and its dimensions reveal adequate reliability and validity.
This research provides a theoretical framework for understanding the relationships among six important marketing constructs (experience quality, water park image, perceived value, satisfaction, delight, and behavioral intention). Experiential quality is empirically tested and confirmed as having a positive impact on water park image. The positive relationship identified between experiential quality and water park image may be interpreted as, the higher the experiential quality as perceived by water park visitors, the better impressions of the water park that the visitors have in their minds. In addition, this study identifies experiential quality, perceived value, and water park image as having a positive effect on visitor satisfaction in a water park context. This may be interpreted as experiential quality, perceived value, and water park image being antecedents of visitor satisfaction because of experiential quality, perceived value, and water park image play a key role in increasing visitor experiential satisfaction (e.g., Jin et al., Citation2015; Kao et al., Citation2008; Wu et al., 2018). Furthermore, both visitor satisfaction and perceived value positively influence behavioral intentions. The positive relationship identified between visitor satisfaction and behavioral intentions may be interpreted as satisfied visitors having intentions to revisit the water park after paying high prices and more time to experience high levels of quality at the water park that produces a good image in their minds. In addition, the positive relationship identified between perceived value and behavioral intentions may also be interpreted as it is likely that visitors will have the intention to revisit the water park after leaving with a good impression of the quality of water park experiences in their minds.
6.3. Practical implications
While previous studies have examined the relationships between experience quality and behavioral intention in the context theme parks (Başarangil, Citation2016; Chen & Chen, Citation2010; Jin et al., Citation2015). The present study seeks to expand the previous frameworks and also to examine the role of mediation of four essential structures in marketing literature (image, perceived value, delight, and satisfaction) in the relationship between the quality of experience and behavioral intentions in the field of water parks.
The results of this study indicate that the quality of experience at a water park has a significant and positive effect on perceived value and the water park’s image. It can be argued that the quality of perceived experience forms a positive image and enhances perceived value. Given, visitors of water parks can have pleasant experiences with a wide range of facilities and programs. These delightful experiences prompt visitors to perceive their consumption of the water park’s experiences as highly valuable when compared with their costs. Also, these pleasant experiences supported visitors’ forming positive attitudes toward the general level of service, resulting in an overall positive image for the water parks. Therefore, water parks are recommended to welcome visitors’ feedback concerning their experiences with facilities and programs and use these results to improve marketing strategies. For example, the management at the water park, having identified those facilities and event programs that do not provide positive or memorable experiences, should change or upgrade those components promptly to prevent decreased positive experience quality. At the same time, management should actively advertise popular characteristics and events in the water park to generate positive experience quality. To achieve this goal, a water park manager can use a simple survey to evaluate their visitors’ experiences by using a Smartphone application, email or home page. By the survey, the water park can improve their service or facilities by considering visitors’ needs and those prompt responses will contribute to increasing visitors’ perceived value and image of the destination in the future. Findings further show that visitors’ satisfaction is a strong determinant of behavioral intention.
Also, results reveal that visitors’ satisfaction is a strong determinant of behavioral intention. Results reveal that Visitors’ satisfaction derives from positive experience quality, perceived value, water park image, and visitor delight. And it determines the extent to which visitors intended to return and disseminate a positive expression of the experience to others. The research also confirms that satisfaction has a significant mediating role in the relationship between perceived value/water park image/visitor delight and behavioral intention. In other words, satisfaction is an essential motivator for a visitor to revisit the water park and share positive experiences with others. The results show that improving the perceptions of water park visitors through the quality of experience, perceived value, and water park image can effectively increase visitor satisfaction levels, and higher levels of satisfaction can ultimately lead to visitor behavior intention. In this regard, management should spend more efforts on providing a reliable and pleasant experience to meet the needs and aspirations of the visitor. Therefore, to increase the perceptions of water park visitors from perceived value, park management should improve the quality of interaction of staff with visitors, the physical environment, and access to services. It should also promote the emotional value of visitors to increase the perception of water park visitors by satisfaction. Hence, park managers can use a variety of unique events (such as concerts, family games, and water-related matches) on particular days (such as the Nowruz holidays) to secure a memorable experience in the minds of visitors.
The significant achievement of the present research affirms the salience of water park image in determining customer responses to the service experience. Because the image of a water park affects so many different aspects of the consumption experience, our research suggests that water park managers need to be ever mindful of their property’s position in the marketplace. Therefore, successful image management leads to the formation of positive outcomes including quality/price perceptions and visitor loyalty. To stay competitive, however, water parks must engage in an ongoing process of image development and maintenance. While this process may vary from park to park, variables such as variety and novelty are likely to be essential components of water park image in most contexts.
While experience quality and image management are essential, the results of the research show that the image that visitors form by previous evidence can have a positive effect on the delight of playing in the park. We introduced the concept of the delight of visitors to the theory of expectation-disconfirmation and stated that consumers compare their real experience from the service provider with their expectations from this experience. Returning to expectation-disconfirmation theory showed that, it is critical for managers to recognize that setting high expectations may result in negative disconfirmation between expectation and experience. Hence, to be successful, the image represented in the marketplace must set the appropriate expectations of the realized experience. Thus, in addition to managing image, managing consumers’ expectations is an equally critical component of the strategic marketing process in this area. According to our research, a water park that manages these two functions successfully is likely to reap the benefits in the form of enhanced customer loyalty.
7. Limitation and future study
This study has several limitations researchers should consider when evaluating the results. Firstly, limitation of this study is it does not evaluate pre-consumption expectations. Before service consumption, various factors may anchor post-consumption evaluations and emotions of visitors. Therefore, an exciting avenue for future research would be to examine how the difference between pre consumption expectations and post-consumption assessments shape visitor delight. Secondly, in this study, three dimensions of immersion, surprise, and fun were examined considering the literature review as dimensions of experience quality. Therefore, it cannot be argued that these three dimensions reflect all aspects of the quality of experience among water park visitors. Thus, future research recommends the use of other elements of the quality of experience, especially the dimensions introduced by Chang and Horng (Citation2010), which includes tangible factors such as the physical environment, employee interaction, and so on. Thirdly, the survey is collected only from the visitors who were leaving water parks of Mashhad city in Iran. However, the visitors’ perceptions of experience quality, perceived value, satisfaction, delight, water park image and, behavioral intentions of visitors to the water parks of Mashhad city in Iran, and may be different from visitors’ perceptions at the water parks in other regions or countries. Therefore, the findings cannot be generalized to other regions or countries. When applying the results of this study to other regions or countries, future studies should seriously consider the visitors’ perceptual differences owing to the existence of the cultural or regional issue.
Additional information
Funding
Notes on contributors
Davood Ghorbanzade
Davood Ghorbanzadeh is a Ph.D. Candidates Of Business Management-Marketing Management and graduated of MSc in Business Management-Marketing from the department of Management and Social science, Islamic Azad University Of Tehran North Branch, Iran. Her research interests include consumer behavior, tourism marketing, social media, and Branding. He is an author or co-author of some research papers which have been accepted and presented at conferences or published in national and international journals.
Hormoz Mehrani
Hormoz Mehrani is an Associate Professor in Marketing from the Department of Management, Islamic Azad University of North Tehran. His research interests include brand management, consumer behavior and social media marketing.
Atena Rahehagh
Atena Rahehagh is a Ph.D. Candidates Of Business Management-Marketing Management and graduated of MSc in Business Management-Marketing from the department of Management and Social science, Islamic Azad University Of Tehran North Branch, Iran. Her research interests include corporate social Responsibility, Cause related Marketing and Branding.
Related Research Data
References
- Ajzen, I., & Fishbein, M. (2000). Attitudes and attitude - behavior relation: Reasoned and automatic processes. European review of social psychology. 11(1),1–24.
- Alexander, M. W. (2012). Delight the customer: A predictive model for repeat purchase behavior. Journal of Relationship Marketing, 11(2), 116–123. doi:10.1080/15332667.2012.682329
- Ali, F., Kim, W. G., Li, J., & Jeon, H.-M. (2018). Make it delightful: Customers’ experience, satisfaction and loyalty in Malaysian theme parks. Journal of Destination Marketing & Management, 7, 1-11.
- Ali, F., Kim, W. G., & Ryu, K. (2016). The effect of physical environment on passenger delight and satisfaction: Moderating effect of national identity. Tourism Management, 57, 213–224. doi:10.1016/j.tourman.2016.06.004
- Anderson, J. C., & Gerbing, D. W. (1988). Structural equation modeling in practice: A review and recommended two-step approach. Psychological bulletin, 103(3), 411.
- Ariffin, A. A. M., & Yahaya, M. F. (2013). The relationship between airport image, national identity and passengers delight: A case study of the Malaysian low cost carrier terminal (LCCT). Journal of Air Transport Management, 31, 33–36.
- Aydin, S., & Özer, G. (2005). The analysis of antecedents of customer loyalty in the Turkish mobile telecommunication market. European Journal of Marketing, 39(7/8), 910–925. doi:10.1108/03090560510601833
- Ball, J., Ball, J., Barnes, D. C., & Barnes, D. C. (2017). Delight and the grateful customer: Beyond joy and surprise. Journal of Service Theory and Practice, 27(1), 250–269. doi:10.1108/JSTP-01-2016-0013
- Baloglu, S., & Brinberg, D. (1997). Affecting images of tourism destinations. Journal of travel research, 35(4),11–15.
- Barich, H. & Kotler, P. (1991). A framework for marketing image management. MIT Sloan Management Review, 32(2), 94.
- Başarangil, İ. (2016). The relationships between the factors affecting perceived service quality, satisfaction and behavioral intentions among theme park visitors. Tourism and Hospitality Research, 18(4), 415–428. 1467358416664566.
- Baker, D. A., & Crompton, J. L. (2000). Quality, satisfaction and behavioral intentions. Annals of tourism research, 27 (3), 785–804.
- Berman, B. (2005). How to delight your customers. California Management Review, 48(1),129–151.
- Bigné, J. E., Andreu, L., & Gnoth, J. (2005). The theme park experience: An analysis of pleasure, arousal and satisfaction. Tourism Management, 26(6), 833–844. doi:10.1016/j.tourman.2004.05.006
- Castro, C. B., Armario, E. M., & Ruiz, D. M. (2007). The influence of market heterogeneity on the relationship between a destination’s image and tourists’ future behaviour. Tourism Management, 28(1), 175–187. doi:10.1016/j.tourman.2005.11.013
- Chang, T. Y., & Horng, S. C. (2010). Conceptualizing and measuring experience quality: the customer's perspective. The Service industries journal, 30 (14), 2401–2419.
- Chen, C.-F. (2008). Investigating structural relationships between service quality, perceived value, satisfaction, and behavioral intentions for air passengers: Evidence from Taiwan. Transportation Research Part A: Policy and Practice, 42(4), 709–717.
- Chen, C.-F., & Chen, F.-S. (2010). Experience quality, perceived value, satisfaction and behavioral intentions for heritage tourists. Tourism Management, 31(1), 29–35. doi:10.1016/j.tourman.2009.02.008
- Chen, C.-F., & Tsai, D. (2007). How destination image and evaluative factors affect behavioral intentions? Tourism Management, 28(4), 1115–1122. doi:10.1016/j.tourman.2006.07.007
- Cheng, Q., Du, R., & Ma, Y. (2016). Factors influencing theme park visitor brand-switching behaviour as based on visitor perception. Current Issues in Tourism, 19(14), 1425–1446. doi:10.1080/13683500.2014.885497
- Chin, W. W., Peterson, R. A., & Brown, S. P. (2008). Structural equation modeling in marketing: Some practical reminders. Journal of Marketing Theory and Practice, 16(4), 287–298. doi:10.2753/MTP1069-6679160402
- Cole, S. T., & Illum, S. F. (2006). Examining the mediating role of festival visitors’ satisfaction in the relationship between service quality and behavioral intentions. Journal of Vacation Marketing, 12(2), 160–173. doi:10.1177/1356766706062156
- Cole, S. T., & Scott, D. (2004). Examining the mediating role of experience quality in a model of tourist experiences. Journal of Travel & Tourism Marketing, 16(1), 79–90. doi:10.1300/J073v16n01_08
- Crompton, J. L., & Love, L. L. (1995). The predictive validity of alternative approaches to evaluating quality of a festival. Journal of Travel Research, 34(1), 11–24. doi:10.1177/004728759503400102
- Crotts, J. C., Pan, B., & Raschid, A. E. (2008). A survey method for identifying key drivers of guest delight. International Journal of Contemporary Hospitality Management, 20(4), 462–470. doi:10.1108/09596110810873552
- Denning, S. (2011). The essential metric of customer capitalism is customer outcomes. Strategy & Leadership, 39(4), 12–18. doi:10.1108/10878571111147350
- Duman, T., & Mattila, A. S. (2005). The role of affective factors on perceived cruise vacation value. Tourism Management, 26(3), 311–323. doi:10.1016/j.tourman.2003.11.014
- Fernandes, T., & Cruz, M. (2016). Dimensions and outcomes of experience quality in tourism: The case of Port wine cellars. Journal of Retailing and Consumer Services, 31, 371–379. doi:10.1016/j.jretconser.2016.05.002
- Finn, A. (2005). Reassessing the foundations of customer delight. Journal of Service Research, 8(2), 103–116. doi:10.1177/1094670505279340
- Fishbein, M., & Ajzen, I. (1975). Intention and behavior: An introduction to theory and research.
- Fornell, C., & Larcker, D. F. (1981). Evaluating structural equation models with unobservable variables and measurement error. Journal of Marketing Research, 39–50. doi:10.1177/002224378101800104
- Füller, J., & Matzler, K. (2008). Customer delight and market segmentation: An application of the three-factor theory of customer satisfaction on life style groups. Tourism Management, 29(1), 116–126. doi:10.1016/j.tourman.2007.03.021
- Gefen, D., Straub, D., & Boudreau, M.-C. (2000). Structural equation modeling and regression: Guidelines for research practice. Communications of the Association for Information Systems, 4(1), 7. doi:10.17705/1CAIS
- Geissler, G. L., & Rucks, C. T. (2011). The overall theme park experience: A visitor satisfaction tracking study. Journal of Vacation Marketing, 17(2), 127–138. doi:10.1177/1356766710392480
- Goff, B. G., Boles, J. S., Bellenger, D. N., & Stojack, C. (1997). The influence of salesperson selling behaviors on customer satisfaction with products. Journal of Retailing, 73(2), 171–183. doi:10.1016/S0022-4359(97)90002-6
- González, M. E. A., Comesaña, L. R., & Brea, J. A. F. (2007). Assessing tourist behavioral intentions through perceived service quality and customer satisfaction. Journal of Business Research, 60(2), 153–160. doi:10.1016/j.jbusres.2006.10.014
- Hair, J. F., Ringle, C. M., & Sarstedt, M. (2011). PLS-SEM: Indeed a silver bullet. Journal of Marketing theory and practice, 19(2),139–152.
- Hair, J., Hult, G., Ringle, C., & Sarstedt, M. (2013). A Primer on Partial Least Squares Structural Equation Modeling (PLS-SEM). USA: SAGE.
- Hallak, R., Assaker, G., & El-Haddad, R. (2018). Re-examining the relationships among perceived quality, value, satisfaction, and destination loyalty: A higher-order structural model. Journal of Vacation Marketing, 24(2), 118–135. 1356766717690572.
- Han, H., Back, K. J., & Barrett, B. (2009). Influencing factors on restaurant customer's revisit intention: The roles of emotions and switching barriers. International Journal Hospitality Management. 28 (4), 563–572.
- Hirschman, E. C., & Holbrook, M. B. (1982). Hedonic consumption: Emerging concepts, methods and propositions. The Journal of Marketing, 92–101. doi:10.1177/002224298204600314
- Hu, -H.-H., Kandampully, J., & Juwaheer, T. D. (2009). Relationships and impacts of service quality, perceived value, customer satisfaction, and image: An empirical study. The Service Industries Journal, 29(2), 111–125. doi:10.1080/02642060802292932
- Hudson, S., & Shephard, G. W. (1998). Measuring service quality at tourist destinations: An application of importance-performance analysis to an alpine ski resort. Journal of Travel & Tourism Marketing, 7(3), 61–77. doi:10.1300/J073v07n03_04
- Hutchinson, J., Lai, F., & Wang, Y. (2009). Understanding the relationships of quality, value, equity, satisfaction, and behavioral intentions among golf travelers. Tourism Management, 30(2), 298–308. doi:10.1016/j.tourman.2008.07.010
- Lovelock, C. H. (2000). Service Marketing 4th edition Prentice Hall International. New Jersey.
- Jin, N., Jin, N., Line, N. D., Line, N. D., Merkebu, J., & Merkebu, J. (2016). The effects of image and price fairness: A consideration of delight and loyalty in the waterpark industry. International Journal of Contemporary Hospitality Management, 28(9), 1895–1914. doi:10.1108/IJCHM-03-2015-0094
- Jin, N. P., Lee, S., & Lee, H. (2015). The effect of experience quality on perceived value, satisfaction, image and behavioral intention of water park patrons: New versus repeat visitors. International Journal of Tourism Research, 17(1), 82–95. doi:10.1002/jtr.v17.1
- Kao, Y.-F., Huang, L.-S., & Wu, C.-H. (2008). Effects of theatrical elements on experiential quality and loyalty intentions for theme parks. Asia Pacific Journal of Tourism Research, 13(2), 163–174. doi:10.1080/10941660802048480
- Keller, K. L. (2003). Brand synthesis: The multidimensionality of brand knowledge. Journal of Consumer Research, 29(4),595–600.
- Kennedy, S. H. (1997). Nurturing corporate images. European Journal of marketing, 11(3),119–164.
- Kim, M., Vogt, C. A., & Knutson, B. J. (2015). Relationships among customer satisfaction, delight, and loyalty in the hospitality industry. Journal of Hospitality & Tourism Research, 39(2), 170–197. doi:10.1177/1096348012471376
- Kim, S.-Y. (2006). The effects of service quality on satisfaction, reviewing intentions, and recommendation of consumer of water parks. Korean Alliance for Health, Physical Education, Recreation and Dance, 45(3), 325–333.
- Kim, M., Vogt. C. A., & Knutson, B. J. (2015). Relationships among customer satisfaction, delight, and loyalty in the hospitality industry. Journal of Hospitality & Tourism Research, 39(2),170–197.
- Ko, Y. J., Zhang, j., Cattani, K., & Pastore, D. (2011). Assessment of event quality in major spectator sports. Managing Service Quality: An International Journal, 21 (3),304–322.
- Kumar, A., Olshavsky, R. W., & King, M.F. (2001). Exploring alternative antecedents of customer delight. Journal of Consumer Satisfaction, Dissatisfaction and Complaining Behavior, 14, 14.
- Kwak, H.-P., Kim, K.-S., & Lee, C.-S. (2010). Measurement scale development of waterpark service quality. The Journal of the Korea Contents Association, 10(1), 426–435. doi:10.5392/JKCA.2010.10.1.426
- Lee, S., Jin, N., & Lee, H. (2014). The moderating role of water park service quality, environment, image, and food quality on perceived value and customer loyalty: A South Korean case study. Journal of Quality Assurance in Hospitality & Tourism, 15(1), 19–43. doi:10.1080/1528008X.2014.855102
- Lian Chan, J. K., & Baum, T. (2007). Ecotourists’ perception of ecotourism experience in Lower Kinabatangan, Sabah, Malaysia. Journal of Sustainable Tourism, 15(5), 574–590. doi:10.2167/jost679.0
- Lin, C.-H., Morais, D. B., Kerstetter, D. L., & Hou, J.-S. (2007). Examining the role of cognitive and affective image in predicting choice across natural, developed, and theme-park destinations. Journal of Travel Research, 46(2), 183–194. doi:10.1177/0047287507304049
- Loureiro, S. M. (2010). Satisfying and delighting the rural tourists. Journal of Travel & Tourism Marketing, 27(4), 396–408. doi:10.1080/10548408.2010.481580
- Ma, J., Gao, J., Scott, N., & Ding, P. (2013). Customer delight from theme park experiences: The antecedents of delight based on cognitive appraisal theory. Annals of Tourism Research, 42, 359–381. doi:10.1016/j.annals.2013.02.018
- Ma, J., Scott, N., Gao, J., & Ding, P. (2017). Delighted or satisfied? Positive emotional responses derived from theme park experiences. Journal of Travel & Tourism Marketing, 34(1), 1–19. doi:10.1080/10548408.2015.1125824
- Mackay, K. J., & Crompton, J. L. (1988). A conceptual model of consumer evaluation of recreation service quality. Leisure Studies, 7(1), 40–49. doi:10.1080/02614368800390041
- Manthiou, A., Kang, J., Chiang, L., & Tang, L. (2016). Investigating the effects of memorable experiences: An extended model of script theory. Journal of Travel & Tourism Marketing, 33(3), 362–379. doi:10.1080/10548408.2015.1064055
- Milman, A. (2009). Evaluating the guest experience at theme parks: An empirical investigation of key attributes. International Journal of Tourism Research, 11(4), 373–387. doi:10.1002/jtr.v11:4
- Milman, A., & Tasci, A. D. (2018). Exploring the experiential and sociodemographic drivers of satisfaction and loyalty in the theme park context. Journal of Destination Marketing & Management, 8, 358-395.
- Moon, K. S., Kim, M., Ko, Y. J., Connaughton, D. P., & Lee., J. H. (2011). The influence of customer's event quality perception on destination image. Managing Service Quality: An International Journal, 21(3), 287–303.
- Moss, E., Rousseau, D., Parent, S., St- Laurent, D., & Saintonge, J. (1998). Correlates of attachment at school age: Maternal reported stress, mother-child interaction, and behavior problems. Child development, 69(5),1390–1405.
- Oh, H. (1999). Service quality, customer satisfaction, and customer value: A holistic perspective. International Journal of Hospitality Management, 18(1), 67–82. doi:10.1016/S0278-4319(98)00047-4
- Oliver, R. L. (1997). SatisfactionCA Behavioral Perspective on the Consumer. New York: McGraw-Hill.
- Oliver, R. L. (1980). A cognitive model of the antecedents and consequences of satisfaction decisions. Journal of marketing research, 17(4),460–469.
- Oliver, R. L. (2014). Satisfaction: A behavioral perspective on the consumer. New York, NY: Routledge.
- Oliver, R. L., & Swan, J. E. (1989). Consumer perceptions of interpersonal equity and satisfaction in transactions: a field survey approach. Journal of Marketing, 53(2),21–35.
- Olorunniwo, F., Hsu, M. K., & Udo, G. J. (2006). Service quality, customer satisfaction, and behavioral intentions in the service factory. Journal of Services Marketing, 20(1), 59–72. doi:10.1108/08876040610646581
- Otto, J. E., & Ritchie, J. B. (1996). The service experience in tourism. Tourism Management, 17(3), 165–174. doi:10.1016/0261-5177(96)00003-9
- Parasuraman, A., Zeithaml, V. A., & Berry, L. L. (1985). A conceptual model of service quality and its implications for future research. The Journal of Marketing, 41–50. doi:10.1177/002224298504900403
- Pearce, P. (1988). The Ulysses Factor: Evaluar lisitors in Tourist Settings.
- Petrick, J. F., & Backman, S. J. (2002). An examination of the construct of perceived value for the prediction of golf travelers’ intentions to revisit. Journal of Travel Research, 41(1), 38–45. doi:10.1177/004728750204100106
- Pine, B. J., & Gilmore, J. (1999). The experience economy: work is theartre and every business a stage. Boston: Harvard Business School Press.
- Plutchik, R. (1980). A general psychoevolutionary theory of emotion. Theories of Emotion, 1(3–31), 4.
- Prebensen, N. K., Kim, H., & Uysal, M. (2016). Cocreation as moderator between the experience value and satisfaction relationship. Journal of Travel Research, 55(7), 934–945. doi:10.1177/0047287515583359
- Qin, H., & Prybutok, V. R. (2009). Service quality, customer satisfaction, and behavioral intentions in fast-food restaurants. International Journal of Quality and Service Sciences, 1(1), 78–95. doi:10.1108/17566690910945886
- Ryan, C., Shih Shuo, Y., & Huan, T.-C. (2010). Theme parks and a structural equation model of determinants of visitor satisfaction—Janfusan Fancyworld, Taiwan. Journal of Vacation Marketing, 16(3), 185–199. doi:10.1177/1356766710372245
- Ryu, K., Han, H., & Kim, T.-H. (2008). The relationships among overall quick-casual restaurant image, perceived value, customer satisfaction, and behavioral intentions. International Journal of Hospitality Management, 27(3), 459–469. doi:10.1016/j.ijhm.2007.11.001
- Ryu, K., Lee, H.-R., & Gon Kim, W. (2012). The influence of the quality of the physical environment, food, and service on restaurant image, customer perceived value, customer satisfaction, and behavioral intentions. International Journal of Contemporary Hospitality Management, 24(2), 200–223. doi:10.1108/09596111211206141
- Sánchez-Fernández, R., & Iniesta-Bonillo, M. Á. (2007). The concept of perceived value: A systematic review of the research. Marketing Theory, 7(4), 427–451. doi:10.1177/1470593107083165
- Sheth, J. N., Newman, B. I., Gross, B. L. (1991). Consumption values and market choice. Cincinnati, OH: South Western Publishing.
- Tasci, A. D., & Milman, A. (2017). Exploring experiential consumption dimensions in the theme park context. Current Issues in Tourism, 19, 1–24.
- Tenenhaus, M., Vinzi, V. E., Chatelin, Y. M., & Lauro, C. (2005). PLS path modeling. Computational statistics & data analysis, 48(1),159–205.
- Titz, k. (2009). Experiential consumption: affect- emotions-hedonism. In Handbook of hospitality marketing management (pp. 346–374). Routledge.
- Torres, E. N., & Kline, S. (2006). From satisfaction to delight: a model for the hotel industry. International Journal of Contemporary Hospitality Management, 18(4),290–301.
- Torres, E. N., Fu, X., & Lehto, X. (2014). Examining key drivers of customer delight in a hotel experience: A cross-cultural perspective. International Journal of Hospitality Management, 36, 255–262. doi:10.1016/j.ijhm.2013.09.007
- Tsang, N. K., Lee, L. Y., Wong, A., & Chong, R. (2012). THEMEQUAL—Adapting the SERVQUAL scale to theme park services: A case of Hong Kong Disneyland. Journal of Travel & Tourism Marketing, 29(5), 416–429. doi:10.1080/10548408.2012.691391
- Wang, W., Chen, J. S., Fan, L., & Lu, J. (2012). Tourist experience and wetland parks: A case of Zhejiang, China. Annals of Tourism Research, 39(4),1763–1778.
- Westbrook, R. A., & Oliver, R. L. (1991). The dimensionality of consumption emotion patterns and consumer satisfaction. Journal of Consumer Research, 18(1), 84–91. doi:10.1086/jcr.1991.18.issue-1
- Wetzels, M., Odekerken-Schroder, G., & Van Oppen, C. (2009). Using PLS path modeling for assessing hierarchical construct models: Guidelines and empirical illustration. MIS quarterly, 177–195.
- Wirtz, J., & Bateson, J. E. (1999). Consumer satisfaction with services: Integrating the environment perspective in services marketing into the traditional disconfirmation paradigm. Journal of Business Research, 44(1), 55–66. doi:10.1016/S0148-2963(97)00178-1
- Wu, H.-C. (2014). The effects of customer satisfaction, perceived value, corporate image and service quality on behavioral intentions in gaming establishments. Asia Pacific Journal of Marketing and Logistics, 26(4), 540–565. doi:10.1108/APJML-03-2014-0049
- Wu, H.-C., & Ai, C.-H. (2016). Synthesizing the effects of experiential quality, excitement, equity, experiential satisfaction on experiential loyalty for the golf industry: The case of Hainan Island. Journal of Hospitality and Tourism Management, 29, 41–59. doi:10.1016/j.jhtm.2016.05.005
- Wu, H.-C., Li, M.-Y., & Li, T. (2018). A study of experiential quality, experiential value, experiential satisfaction, theme park image, and revisit intention. Journal of Hospitality & Tourism Research, 42(1), 26-73. 1096348014563396.
- Wu, H.-C., Li, T., & Li, M.-Y. (2016). A study of behavioral intentions, patient satisfaction, perceived value, patient trust and experiential quality for medical tourists. Journal of Quality Assurance in Hospitality & Tourism, 17(2), 114–150. doi:10.1080/1528008X.2015.1042621
- Yuan, Y. H. E., & Wu, C. K. (2008). Relationship among experiential marketing, experiential value, and customer satisfaction.Journal of Hospitality & Tourism Research, 32(3), 387–410.
- Zeithaml, V. A. (1988). Consumer perceptions of price, quality, and value: a means-end model and synthesis of evidence. Journal of marketing, 52(3),2–22.
- Zhang, Y., Li, X. R., Su, Q., & Hu, X. (2017). Exploring a theme park’s tourism carrying capacity: A demand-side analysis. Tourism Management, 59, 564–578. doi:10.1016/j.tourman.2016.08.019
- Zins, A. H. (2002). Consumption emotions, experience quality and satisfaction: A structural analysis for complainers versus non-complainers. Journal of Travel & Tourism Marketing, 12(2–3), 3–18. doi:10.1300/J073v12n02_02