
 ?Mathematical formulae have been encoded as MathML and are displayed in this HTML version using MathJax in order to improve their display. Uncheck the box to turn MathJax off. This feature requires Javascript. Click on a formula to zoom.
Abstract
Inventory is a significant and important asset for retailers and represents what a store has to offer its customers for instant purchase; at the same time, considerable costs are associated with holding inventory. In this study, we use inventory turnover as a measure of inventory performance. We build upon previous research and use firm-specific measures to untangle the link between inventory performance and chain affiliation as well as time trends for SMEs. We employ panel regressions on data for the 1998–2013 period for Norwegian stores affiliated with three different retail chains that operate within the industry of retail sale of hardware, paints and glass. We estimate inventory turnover both with and without controlling for explanatory variables, and we find that inventory performance over the sampling period varies but decreases over time for the examined retail chains controlling for factors known to affect relative inventory levels. We further find that retail chain affiliation affects inventory turnover at the store level when controlled for gross margin, capital intensity, growth in sales, and that inventory increases with firm size. These findings have important implications for practice.
PUBLIC INTEREST STATEMENT
Inventory is important for physical stores because it gives their customers instant access to products when they need them. On the other hand, there are considerable costs involved in holding inventory, which makes it immensely important for retailers to manage inventory levels. In this study of Norwegian firms, we examine inventory performance in small and medium-sized independent retail stores belonging to three chains selling home improvement products and tools to end users. We find that inventory performance varies between stores, retails chains, and over time. Although some of the retail stores perform better than others, they exhibit on average a deteriorating inventory performance over the period 1998–2013. This negative time trend is alarming and may contribute to partly explain the ongoing retail crisis. The findings also suggest that firm size affects inventory performance positively. This implies that smaller stores should be more attentive to inventory management to withstand competition.
1. Introduction
The ongoing crisis within traditional brick-and-mortar retail stores has received growing media attention in recent years. “High street delivers worst performance in 12 years as retail crisis deepens” (Clarke, Citation2018) is an example of a headline from such media coverage. Several factors contribute to this crisis, such as costs rising at a faster pace than revenue, high debt, and competition with online shopping (Thomas, Citation2018). Economic data for the period 2012–2017 simultaneously show that for US retail, the inventory to sales ratio has grown (US Bureau of the Census, Citation2018). This indicates that inventory performance for some retailers deteriorates, leading to additional costs that impair store earnings and thus, contribute to the crisis.
Inventory management is considered an important management practice in any retail business because of its impact on retail profits (see, e.g., Cronin, Citation1985). The most frequently used measure of inventory management performance is inventory turnover. This measure is closely monitored by senior executives in practice at both retail chain and store levels, and is the only performance measure on inventory management available to other stakeholders through publicly available financial statements. Business analysts and shareholders are showing an increased interest in this business performance measure. An example of a recent occurrence of such interest is the report of Hennes & Mauritz following its capital market day in which the analysts of Credit Suisse commented, “We remain unclear as to how H&M is going to trade out the inventory mountain without doing further damage to full price sales…” (Irwin & Pratti, Citation2018).
The early discovery of the EOQ (Economic Order Quantity) model enabled computation of the optimal number of items to order as to minimize total inventory holding costs and ordering costs (Harris, Citation1913), and has been significant to the inventory management literature. From the advent of this model, research has been growing significantly over a lengthy span of time, originally in the single entity model setting and more recently in the collaborative and across business framework (Williams & Tokar, Citation2008). Recent empirical findings indicate inventory performance to be positively related to financial performance measures, such as return on assets, return on sales, earnings before interest and taxes (Alan, Gao, & Gaur, Citation2014; Capkun, Hameri, & Weiss, Citation2009; Chen, Frank, & Wu, Citation2005, Citation2007; Eroglu & Hofer, Citation2011a; Isaksson & Seifert, Citation2014; Kesavan & Mani, Citation2013; Rumyantsev & Netessine, Citation2007a; Shockley & Turner, Citation2014), and stock value and return (Alan et al., Citation2014; Chen et al., Citation2005, Citation2007). This makes inventory turnover a popular indicator for evaluating the profitability of a firm. Moreover, time trends in inventory turnover were initially found to be improving; for manufacturing firms in particular (Chen et al., Citation2005; Rajagopalan & Malhotra, Citation2001). For wholesale and retail, there have been contradictory findings for some time, but recent research on time trends for retail firms suggests that inventor turnover deteriorates (Gaur, Fisher, & Raman, Citation2005; Kolias, Dimelis, & Filios, Citation2011).
Our study contributes to the literature on time trends in inventory turnover and is to the best of our knowledge the first study on the effect of voluntary chain affiliation on inventory turnover of independent retail stores. Research on inventory turnover has mostly been conducted using data from large American-listed retail corporations (e.g. Gaur et al., Citation2005), and the findings may thus not be valid across other geographical regions, firm sizes, or for privately owned firms. We therefore further contribute to the literature by providing findings from privately owned small and medium-sized corporations. We examine inventory turnover based on public financial data for the period 1998–2013 on businesses operating stores affiliated to either one of three voluntary cooperative retail chains belonging to the same segment of stores selling home improvement products. This period reflects rapidly increasing knowledge on efficient business management, historically unprecedented growth in computational force, increases in consumer affluence, and not least a steady rise of e-commerce in size and reach. Earlier studies on time trends in inventory turnover cover periods with quite different economic and societal conditions. There is as such a need to revisit this issue again.
Our paper reports three main findings. First, we estimate inventory turnover, both with and without controlling for explanatory variables, and we find that inventory turnover on average has deteriorated annually with a much higher percentage than comparable figures reported in the study by Gaur et al. (Citation2005). Second, we find that retail chain affiliation affects inventory turnover at the store level when controlled for gross margin, capital intensity, growth in sales, and firm size. This finding has implications for practice as it demonstrates that some retail chains outperform others on inventory management. Third, we find the firm size to affect inventory turnover. This implies that the small business owner should give inventory management more attention to withstand competition, for instance by more closely monitoring inventory levels.
The remainder of this article is organized as follows. Section two reviews the relevant literature, while section three describes the data and methods. The fourth section contains results and is followed by a conclusion section that discusses the main findings, limitations, and implications for practice.
2. Literature review
Research on inventory management has been conducted predominantly on the operations level, analysing firm-specific business data or simulations of inventory systems, models and practices. However, over the past two decades, interest in identifying issues related to inventory performance across firms and industry segments has increased. This research has been conducted in the retail, wholesale and manufacturing industries. One difference in these examinations is that retail stores and wholesale firms as a rule hold only FGI, while manufacturing firms in addition hold the discrete components of inventory as RMI and WIPI.
Rajagopalan and Malhotra (Citation2001) were among the first to examine how inventory levels evolve over time. They find that inventory levels decreased for most segments in the 1964–1984 period and further abated in approximately half of the manufacturing firms in the decade after 1984. These findings were later supported by Chen et al. (Citation2005), who use data for the 1981–2000 period to show that the inventory holding period was reduced from 96 to 81 days. This 2% annual average reduction occurred mainly through WIPI, while the FGI holding period remained unchanged. Furthermore, Chen et al. (Citation2007) find that the median wholesale inventory declined from 73 to 49 days between 1981 and 2004, while retail inventories started to decline from 1995 onwards. The results regarding retail inventories were, however, contradicted by Gaur et al. (Citation2005), who show that inventory turnover decreased (e.g. relative inventories increased) by 0.45% annually for the 1987–2000 period for listed US retail firms, whereas Kolias et al. (Citation2011) find that inventory turnover in Greek retail slowed by 3.4% annually during 2000–2005.
The presence of economies of scale with respect to inventory levels and firm size is demonstrated in several papers (Gaur & Kesavan, Citation2009; Rumyantsev & Netessine, Citation2007b). Rumyantsev and Netessine (Citation2007b) use total assets as a proxy for firm size, while Gaur and Kesavan (Citation2009) extend this model with a quadratic term to allow for non-linear impacts of firm size. The results support economies of scales, but at a decreasing rate as firm size increases.
Another approach to measuring inventory performance is the performance metric empirical leanness indicator (ELI) developed by Eroglu and Hofer (Citation2011b). The ELI measures, by industry segment, the level of inventory relative to sale and control for economies of scale. This performance indicator provides a single-value benchmark measure of firms within defined segments or industries. In measuring ELI, Eroglu and Hofer (Citation2011b) find a concave relationship for a large number of industry segments. A similar measure that can be used as an industry yardstick is the adjusted inventory turnover (AIT) metric proposed by Gaur et al. (Citation2005). This measure controls for gross margin, capital intensity and sales surprise; however, it does not include a proxy for firm size.
Levels of inventory relative to other financial metrics are important for stakeholders over the longer term. However, the ability of a firm to rapidly adapt inventory in line with demand plays a key role in inventory management. Rumyantsev and Netessine (Citation2007a) propose several different measures of such adjustment capability and responsiveness and find an association between financial performance and these measures. Responsiveness is divided into two categories. The over-responsive measure expresses that a change in sales is accompanied by a greater increase/decrease in inventory, while the under-responsive measure indicates a smaller change in inventory relative to a change in sales. More specifically, they find that over-responsiveness at the firm level is associated with lower return on assets (ROA). Shockley and Turner (Citation2014) find similar results at the firm level and for some industry segments. Recent findings by Kesavan, Kushwaha, and Gaur (Citation2016) suggest that high inventory turnover (HIT) retailers respond to shocks by adjusting their purchases, while low inventory turnover (LIT) retailers respond to shocks by adjusting prices. Their analysis implies that financial performance drops more among LIT than among HIT retailers when demand shocks occur.
A large part of the more recent literature on inventory performance metrics focuses on establishing a link between efficient inventory management and financial performance. So far, this strand of research suggests that such a link exists (Alan et al., Citation2014; Capkun et al., Citation2009; Chen et al., Citation2005, Citation2007; Eroglu & Hofer, Citation2011b; Isaksson & Seifert, Citation2014; Kesavan et al., Citation2016; Kesavan & Mani, Citation2013; Rumyantsev & Netessine, Citation2007a; Shockley & Turner, Citation2014). Of the discrete components of inventory, which are of particular interest to the manufacturer, RMI appear to have the strongest relationship with financial performance. For the retailer and wholesaler, the level of FGI is positively linked to measures of financial adeptness (Capkun et al., Citation2009; Eroglu & Hofer, Citation2011a, Citation2011b; Isaksson & Seifert, Citation2014; Kesavan et al., Citation2016; Kesavan & Mani, Citation2013; Shockley & Turner, Citation2014). Some authors have also been able to establish a relation between relative levels of inventory and the long-run value of firms. (Alan et al., Citation2014; Chen et al., Citation2005, Citation2007). Finally, several articles indicate that when firms respond to changing demand by adjusting inventories rather than prices (e.g. responsiveness), financial performance is positively impacted (Kesavan et al., Citation2016; Rumyantsev & Netessine, Citation2007a; Shockley & Turner, Citation2014).
As we have seen, research on inventory performance can be divided into two main categories. The first category treats inventory performance as a self-contained performance metric and analyses inventory performance indicators such as inventory in levels, inventory turnover, and inventory in days. This approach can be augmented by correcting the raw metric for certain macroeconomic factors, such as the interest rate, gross domestic product, or a purchase manager index (Chen et al., Citation2005, Citation2007). One can also adjust by some determinants of inventory, such as gross margin, capital intensity and sales growth (Eroglu & Hofer, Citation2011a; Gaur et al., Citation2005; Gaur & Kesavan, Citation2009; Kolias et al., Citation2011; Rumyantsev & Netessine, Citation2007b).
The second category is concerned with how inventory performance affects financial performance measures such as ROA, return on sales (ROS), earnings before interest and taxes (EBIT) and stock value (Alan et al., Citation2014; Capkun et al., Citation2009; Chen et al., Citation2005, Citation2007; Eroglu & Hofer, Citation2011a; Isaksson & Seifert, Citation2014; Kesavan & Mani, Citation2013; Rumyantsev & Netessine, Citation2007a; Shockley & Turner, Citation2014).
Several inventory management approaches are employed by businesses to control inventory. In the single business entity context, two main directions exist within inventory control models, namely fixed quantity systems and fixed period systems. First, fixed quantity systems, frequently denoted (Q,R) models, with Q representing the lot size or quantity to replenish and R the level where the order is placed. Within this category of models, EOQ, reorder point and base stock policy being the most frequently published (Williams and Tokar 2008). The second approach to control inventory is the fixed period systems, often defined (S, T) models, with S denoting the amount to order, where T is the time period between review of inventory levels. Even though popular in the industry, only a few scientific papers are published on such models (Williams and Tokar 2008).
The amount of choices in inventory control models available for implementation in businesses are significant. All such models have in common the desire to match supply and demand, and maximize inventory performance. In measuring inventory performance, we employ inventory turnover and build on previous research to control for effects known to be correlated with relative levels of inventory.
3. Data
3.1. Data sample
In this article, we analyse financial accounting statements for Norwegian firms that are equivalent to a corporation (Inc. or Corp.) in the US or a private limited company (Ltd.) in the UK. The dataset consists of yearly financial statements for all firms affiliated with one of three retail chains, namely, XL-Bygg, Byggmakker and Byggtorget. These chains operate within the industry of retail sale of hardware, paints and glass, and have similarities of the larger and more well-known retailers Bauhaus in Europe and The Home Depot in North America. We record chain affiliation as of the end of 2013, and changes in chain affiliation during the sample period are disregarded. The sample period is 1998–2013 and contains 184 firms with 2107 observations. These retail chains represent approximately 30% of the total domestic industry revenue and are all represented in the top 10 largest home improvement retail chains of Norway. Broad metrics for the remaining dominating retail chains suggest only marginal differences in measures constituting the base of this analysis. The Norwegian economy has during the same period grown steadily; consumer prices and GDP for instance increasing by 31% and 24.4%, respectively (Statistics Norway, Citation2019, Citation2018).
These stores carry a wide product assortment with product line width and merchandise depth depending on the store size, location and strategy. Although there is some variability between stores, in general, these product groups are present: lumber, roofing, masonry, stones, brick, doors and windows, hardware and tools, paint, floor covering, and cabinets. In addition, some of these stores carry products such as light fixtures, electrical fittings and plumbing. Although a product might be on display, it is not necessarily in stock and hence may need to be ordered based on the specifications of the customer. For larger construction projects, a substantial part of the materials needed is delivered directly to the building site without passing through the store. These stores are generally specialized to serve both professionals, such as carpenters, builders, and general contractors, and homeowners in both product guidance and supplies for home improvement, remodelling, new home builds, or the construction of offices and industrial facilities. The mix of customers by type of professional and homeowner varies for each store.
The selected retail store chains are in principle voluntary cooperative organizations, with each store owned and managed independent of the retail chain. The main task of the retail chain is to attend to common marketing, develop and negotiate purchase agreements and offer store management computer support technology such as accounting, sales and inventory. The fundamental differences between the retail chains are primarily that Byggtorget has the most stores but also the smallest ones, located in the most rural and least populated areas. In comparison, XL-Bygg and Byggmakker outlets are located in municipalities with larger populations and increased centrality; however, XL-Bygg stores are smaller than Byggmakker stores.
Table shows the frequency of the number of observations on financial statements and the number of firms in total and for each of the retail store chains. With regard to the number of firms and years, Byggtorget is the largest of the retail chains measured in a number of stores with 84, compared to 47 and 53 for Byggmakker and XL-Bygg, respectively. The table also indicates that approximately 65% of the observations represents the full-time dimension of 15 years.
Table 1. Frequency table showing number of years of financial statements in data (1998–2013)
There may be several reasons why some firms have fewer than 15 years of accounting statements available. Some businesses might have started up during the sampling period or been affected by mergers and acquisitions. Furthermore, missing observations due to a lack of reported financial statements or calculation of variables may also influence frequency. The next section contains an enhanced description of handling missing observations.
The use of full-year financial accounting data safeguards the registration quality because all Norwegian firms are obligated to perform a yearly audit. A shorter time increment, and hence lack of an audit, might weaken the quality of the data. We note that beginning in May 2011, Norwegian legislation deregulated the mandatory yearly audit for the smallest firms, but this change affects a marginal number of the firms in our sample. Because very few firms would satisfy the criterion of the new regulation by choosing not to perform a yearly audit, we take no action in our analysis to account for this change.
3.2. Methods
We design the following variables, as shown in Table , to support this analysis.
Table 2. Definition of variables
Inventory turnover, , is calculated as the ratio of the cost of goods sold (
) relative to the mean inventory level (
.
denotes gross margin and is defined as the difference between sales (
) and
divided by sales.
denotes capital intensity and is the ratio of gross fixed assets (
) to
and
. The variable
represents sales growth. Sales
is the current year total revenue, and
is its quadratic coincide. Finally, the subscript
identifies the firm, while
embodies the period of time, i.e. the financial accounting year. In addition, the indicator variable
is used to group firms by industry code at the 2-digit level and based on the standard of industrial classification (Statistics Norway, Citation2008). This sample of firms is confirmed to be affiliated with one of three retail chains: Byggmakker, XL-Bygg or Byggtorget. The status of the retail chain affiliation is registered at the end of 2013, while
is registered at the beginning of 2015 and is by this time-invariant.
Table shows that the mean inventory turnover is 5.61 for the entire sample, while Byggtorget on average has 6.34, in contrast to 4.88 and 5.27 for Byggmakker and XL-Bygg, respectively. Furthermore, the table reports gross margin measures to be 30% for the full sample with little deviation for the different retail chains. The relative measure of mean capital intensity is estimated to be 27%, varying in range for the included retailers from 22% to 31%. Growth in sales averages 1.19 but varies from 1.16 to 1.23 among the three retailers. Finally, sales on average vary from 14.5 million NOK for Byggtorget to 84.4 million NOK for the retailer with the largest stores, Byggmakker, averaging 43.6 million NOK in total.
Table 3. Descriptive statistics
In Table , correlations between the constructed variables for the N = 2107 observations are reported.
Table 4. Correlation matrix
For this analysis, we specify two models. The first model is similar to that of (Gaur et al., Citation2005) but is enhanced to unveil the effects of firm size on inventory performance, with the modification that our model uses the growth in sales variable rather than sales surprise.
Model 1 is stated as follows:
Inventory turnover represents the dependent variable, and the model includes the independent variables gross margin (
), capital intensity (
) and growth in sales (
), followed by the variable sales (
) and its squared version
to address potential non-linear effects regarding economies of scale. Furthermore, the model inherits industry segment
and a time trend variable
. In addition to the previously defined variables, common to all models, the explanatory
coefficient represents the parameter to be estimated, while
represents the remaining error term.
Based on previous research and the argument for choosing the independent variables included in the design of both models, gross margin () is negatively correlated with inventory turnover in several studies (Gaur et al., Citation2005; Kolias et al., Citation2011; Shockley & Turner, Citation2014). This empirical research similarly reveals a positive relationship between capital intensity (
) and inventory turnover (
). Further growth in sales (
) is shown to be positively associated with inventory turnover (
by Kolias et al., Citation2011. Finally, sales (
), as previously stated, acts as a proxy for size and is assumed to address economies of scale.
We design the second model to uncover the effects of chain affiliation and its time component. In examining differences in inventory performance between the three retail chains, model 1 is extended with variables to capture such effects. Model 2 examines retail chains fixed and time trend effects:
The dummy variable represents firms affiliated with the retail store chains of Byggmakker, XL-Bygg and Byggtorget, respectively. To capture differences in time trends for each retail chain, an interaction variable is constructed between C
and
.
As previously indicated, all variables except ,
and
are transformed by the natural logarithm. This implies that the
coefficient represents the elasticity of inventory turnover with respect to the associated dependent variable, while for the variable representing
, C
and the interaction between
and
are log-linear coefficients.
Several model specifications have been applied and tested; however, the constructed models and estimations techniques reported in the following sections this paper are the most consistent.
We test for serial correlation using the Wooldridge test (Drukker, Citation2003) and find evidence of an AR(1) structure in the data.
We employ a Prais-Winsten estimator (a special case of the feasible generalized least squares, FGLS), controlling for a panel-specific first-order autocorrelation because we have a relatively long time dimension in our data and thus assume varying serial correlations within firms. We further assume that the disturbance is heteroscedastic and contemporaneously correlated across panels. Because our data are unbalanced with no common time periods for all panels, calculation of the covariance is based on the pairwise estimation of observations present in the panels. In addition, the applied estimator return panel corrected standard errors (Stata: xtpcse) found to be less optimistic than that of the traditional FGLS estimator (Beck & Katz, Citation1995; Katz, Citation2016).
The initial dataset consists of 192 firms with 2448 observations. We delete observations for only three reasons. First, by computing the variables, the first year of data is lost in the transformation process due to the calculation of variables by use of prior year values, such as for inventory turnover. All observations that are missing due to these calculations are deleted, as well as observations missing for other reasons. Furthermore, observations equal to zero drop out due to log transformation, as the natural logarithm is defined only for positive values. Second, because this is an unbalanced dataset, the number of time periods is not the same across all individuals
. This difference indicates that the data are unequally spaced and that different firms may have observations in different periods. In addition, these observations might include firms with non-consecutive runs; data belonging to one given firm might be missing and constitute a gap in the time dimension, implying that one year might be missing in the middle section, resulting in two consecutive runs. For firms with non-consecutive runs, only the sections within each firm containing the most observations are retained. Third, we delete observations with values exceeding 75 for inventory turnover and 100 for growth in sales because a few observations contain values that severely influence the analysis. In addition, firms with only one remaining observation, owing to the fact that they do not contribute to adding information to the construct, are dropped. No further deletion of observations is performed, as we trust the model specifications to handle such deviations. These deletions result in a final dataset that consists of 184 firms with 2107 years of financial statements.
Retailers use several different methods for valuation of inventory, namely, first in, first out (FIFO), weighted average and last in, first out (LIFO). The first two mentioned are the most common, although other approaches may be practised. Since 2003, Norwegian accounting standards have not approved of the LIFO method. The choice of and change in the valuation method in this sample may affect inventory valuation but is not inherent in this dataset. Furthermore, as for most accounting data collected, this panel might suffer survival bias because only firms affiliated with a retail store chain at a given time constitute a part of the data; hence, firms filing for and going bankrupt during the sample period are not present in this sample. Finally, even though this analysis tests several different model specifications, more complex models that are not considered may potentially fit our data even better.
4. Results and discussion
We find when estimating the models previously defined, as reported in Table , that gross margin, capital intensity and sales growth contribute to explain variance in inventory turnover as reported, for model 1 as well as for model 2. The results imply that gross margin is negatively associated with inventory turnover, while capital intensity and growth in sales are positively related to it. These estimates are significant (p < 0.01) and return the anticipated signs that are similar to those found by previous research (Gaur et al., Citation2005; Kolias et al., Citation2011).
Table 5. Regression estimates
Estimates of firm size reported for both models return a positive and significant (p < 0.01) coefficient of 0.11 for model 1, shifting to 0.93 for model 2. This finding must be evaluated in light of changing signs for
between models 1 and 2 (significant at p < 0.05 and p < .01, respectively). This finding suggests that inventory turnover increases with firm size but that there is diminishing return to scale with an increase in firm size. These results are in line with the notion of economies of scale and are similar to those found previously (Ballou, Citation2005; Gaur & Kesavan, Citation2009).
Furthermore, both models 1 and 2 control for the official registered industry code. Estimates indicate that inventory levels vary significantly depending on what segment the business operates within, from −0.75 to 0.52 and −0.62 to 0.63 for models 1 and 2, respectively. This variance in data may stem from the fact that even though firms operate a store outlet within the store format and marketing concept of the affiliated retail chain, they may simultaneously have operations in other areas, such as being a builder or running a sawmill, which may naturally influence the results.
The time trend variable included in model 1 returns significant estimates at the p < 0.01 level, with a coefficient of −0.026. This finding implies that on average over the 15 years analysed, inventory turnover annually decreases by 2.6%. Table further shows (model 2) that the time trend differs among the three retail chains, with XL-Bygg having the least decline in inventory performance, measuring −1.7% annually, followed by Byggmakker with −2.3% and finally Byggtorget with −5.9%; all estimates are significant at p < 0.01. A Wald test confirms that the chain-specific time trend of Byggtorget is significantly different from that of Byggmakker and XL-Bygg (p < 0.01), but no significant statistic difference exists between the latter two. These results indicate large differences between the analysed retail chains; however, over time, some of them perform better than the others do. This negative time trend is generally a matter of concern, particularly in the case of stores affiliated with Byggtorget, because an increase in relative inventory levels constitutes an increase in cost. To maintain an unchanged level of earnings, this finding indicates that cost reductions must be obtained from other parts of firm operations. An alternative to reducing costs could be to increase gross profit margins to uphold earnings or a combination of these two managerial efforts.
Finally, Table shows that intercepts for each retail chain vary and return significant coefficients (p < 0.01). Whereas estimates for Byggmakker and XL-Bygg differ only slightly (−4.97 vs. −4.93), the intercept for Byggtorget is lower at −4.19. Tests of equality (Wald) imply at the p < 0.01 significance level that the estimate for Byggtorget is significantly different from those for Byggmakker and XL-Bygg, but there is no significant difference between the latter two estimates. As previously described, the time trend for Byggtorget is significantly more negative than that for the other chains. However, the chain intercept estimate implies that Byggtorget had a head start on its competitors and to some extent improved the overall competitive setting for these stores.
Although estimations return signs in accordance with recent research controlled for gross margin, capital intensity and growth in sales and firm size, these indicate a downward-sloping inventory turnover during the past one and a half decades. The reasons for this reduction in inventory efficiency are not provided by our models; however, research suggests that an increase in product variety is one of several reasons, making forecasting sales more challenging and therefore increasing inventory levels (Rajagopalan, Citation2013; Randall & Ulrich, Citation2012). Effects of a continued long-run negative trend will ultimately cause an additional rise in cost, eventually making positive profits impossible.
While estimates in Table give adjusted measures of inventory turnover, similarly unadjusted changes in the inventory turnover and other key variables are of interest. We implement a linear growth model using OLS and fixed firm effects estimations. These estimations return the results reported in Table . The log specification of the dependent variable implies an exponential growth model. The full sample shows that inventory turnover is negative by 2.3% annually. Furthermore, that gross profit margin has increased by 0.7% annually, while capital intensity and growth have decreased annually by approximately 2.1% and 0.8%, respectively; all estimates are at significant levels. For each chain of retailers, similar estimations are executed, revealing differences in estimates, however not significant. The exception is the time trend in inventory turnover for Byggtorget, which is notably more negative than the other two.
Table 6. Time trends in IT, GM, CI and S
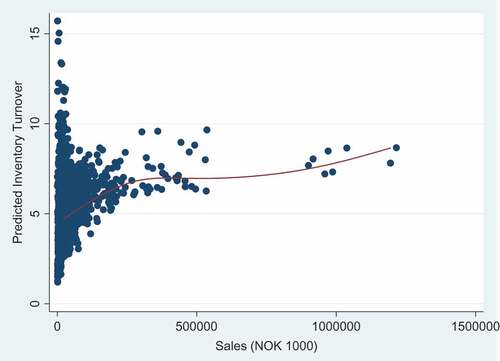
Figure shows a scatterplot of predicted inventory turnover values using model 2 relative to firm size. The figure clearly indicates economies of scale, however, in a non-linear fashion, by the median spline based on a polynomial function.
Figure 1. Firm size effects on inventory turnover.
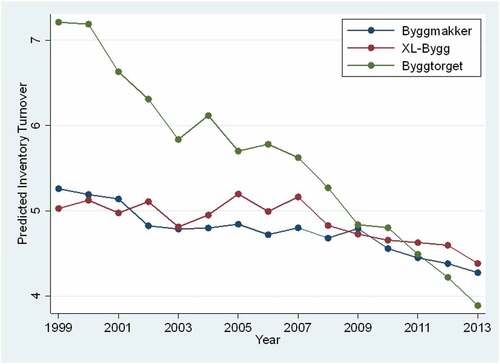
Based on the regression estimates in Table (model 2), we calculate and find that the stores connected to the retail chain of Byggmakker return a 23.4% lower inventory turnover than those of Byggtorget. Furthermore, XL-Bygg stores, on average, have 15.3% less inventory turns than Byggtorget stores. As Figure shows, predicted average inventory turns (based on model 2) for all three retail chains in our analysis indicate a decrease over the sampling period. Although stores of Byggtorget on average perform better than their competitors, this decrease in inventory turns is predominantly more significant for this retail chain relative to both XL-Bygg and Byggmakker. At the same time, and as previously stated, the stores of Byggtorget have the greatest improvement in gross profit margin, which to some extent may compensate for an increase in costs in holding higher levels of inventory.
Figure 2. Development in inventory performance: 1999–2013.
5. Conclusions
In the current research, we examine time trend effects on inventory turnover for the period of 1998–2013 in Norwegian retail. We find a yearly decline in inventory performance in the range of 1.9% to 5.9%, depending on chain affiliation. Controlled for gross margin, capital intensity and growth in sales, we find inventory turnover to deteriorate annually with −2.6% on average. These findings add further insights on the development in inventory performance over time, not only for the individual retail chain at hand, but also in general. The results in this study stand in contrast to comparable findings by Gaur et al. (Citation2005), who report for an annual deterioration of 0.45% in inventory turnover for US retail (the period 1987–2000). Our study point to a much higher decline in inventory performance, which may reflect differences in economic and societal conditions between the two studies. Recent findings from Greek retail, although measured for a shorter time duration than in our study (Kolias et al., Citation2011), find inventory turnover to drop at an annual rate of 3.4%. Thus, there seems to be a downward curve in inventory performance occurring despite continuous developments in technology, management and operations. Some retailers may perform better than others perform, but as our study demonstrates, even the retail chain with the strongest time trend has experienced a negative curve in inventory performance. This may suggest that there is a general negative trend in inventory performance among traditional bricks-and-mortar retailers, and in light of previous literature, even from an international perspective.
Possible explanations of this negative time trend may be increased competition in general, particularly with online sales, different pricing strategies, extent of service, as well as increases in assortment, product variety, and safety stocks; all to better meet customer wants and needs.
Moreover, similar to previous research in this area we find economies of scale to exist for inventory turnover (see for instance Gaur & Kesavan, Citation2009). As firm size increases, so does inventory performance, although at a diminishing rate. Economies of scale related to relative inventory levels may be linked to several circumstances, such as better inventory management, including inventory operations, expertise and software to support it.
Our findings further support earlier studies that have revealed a strong negative association between inventory turnover and gross margin (Gaur et al., Citation2005; Kolias et al., Citation2011), and those reporting a positive correlation between capital intensity, sales growth and sales (Gaur et al., Citation2005; Rumyantsev & Netessine, Citation2007b; Gaur & Kesavan, Citation2009; Kolias et al., Citation2011; Eroglu & Hofer, Citation2011b). Furthermore, we find inventory turnover to be dependent on and vary between industry segments and support previous research (Gaur et al., Citation2005).
This study contributes to the literature on time trends in inventory turnover (Gaur et al., Citation2005; Kolias et al., Citation2011), and is to the best of our knowledge the first study on the effect of voluntary chain affiliation on inventory turnover of independent retail stores. Since this stream of literature is based on findings from large American listed retail corporations, we further contribute to the literature by providing findings from privately owned small and medium-sized corporations.
5.1. Limitations and future research
Although this study contributes to examining chain affiliation and time trend effects on inventory turnover performance, it has some limitations. As our data do not offer measures on specific types of inventories, while at the same time include firms in industry segments likely to hold both RMI and WIPI, generalizations may not prove consistent in the time dimension. Even though we argue that inventory turnover performance depends on chain affiliation and diminish over time for all retail chains involved in our study, it may have been influenced by the actions and performance of the remaining businesses representing about 70% of the industry revenue.
Access to time-variant information on firm chain affiliation, industry code, data on firms closing, bankruptcy, change of industry segment, and switching retail chain affiliation, would also bring more dynamics into the data and potentially provide further insights into this topic.
In addition to the limitations described above, there is overwhelming potential for further research on this issue. Access to business data, such as the ratio of sales to professionals versus regular customers, or the degree of wholesale versus retail distribution, may contribute to explain inventory turnover beyond what can be determined through metrics used in this study. In addition, it is known that lead time significantly affects inventory turnover, and a study that includes store location can potentially be of help in understanding this important metric from the microeconomic perspective. Furthermore, different approaches are available to access information on efficiency or productivity, such as stochastic frontiers or data envelopment analysis. This approach aims to define the frontier of the most efficient firms, thereby identifying those firms that are not efficient, and may potentially provide insight into inventory productivity.
5.2. Managerial implications
Because firm size affects inventory turnover, owners of small businesses should give inventory management more attention to withstand competition. We recommend in particular that small firms monitor inventory levels more closely. Moreover, we advise small firms to train their key personnel to manage and develop further important inventory tasks within the business, as inventory is key to what the firm has to offer its customers. At the same time, holding inventory carry considerable costs and thus, has to be managed well. If not, the firm risk contributing to the rising negative trend in inventory performance that may contribute to partly explain the ongoing retail crisis.
Acknowledgements
The author thanks Ph.D. Torun Fretheim, Ph.D. Nils Magne Larsen and the anonymous reviewers for valuable feedback on this work. Thanks to Anders Arntzen for the contribution on the data collection. The publication charges for this article have been funded by a grant from the publication fund of UiT The Arctic University of Norway.
Disclosure Statement
I have no conflicts of interest to disclose.
Additional information
Funding
Notes on contributors
Jørgen Breivik
Jørgen Breivik is a research fellow at UiT-The Arctic University of Norway. He has for more than 20 years served in corporate and public management positions, principally as a finance director. He has further served on the executive board of more than a dozen SMBs in Norway. Jørgen’s research interest include performance evaluation & analysis, inventory management, consumer behaviour analysis and applied econometrics.
References
- Alan, Y., Gao, G. P., & Gaur, V. (2014). Does inventory productivity predict future stock returns? A retailing industry perspective. Management Science, 60(10), 2416–17. doi:10.1287/mnsc.2014.1897
- Ballou, R. H. (2005). Expressing inventory control policy in the turnover curve. Journal of Business Logistics, 26(2), 143–164. doi:10.1002/j.2158-1592.2005.tb00209.x
- Beck, N., & Katz, J. N. (1995). What to do (and not to do) with time-series cross-section data. American Political Science Review, 89(3), 634–647. doi:10.2307/2082979
- Capkun, V., Hameri, A. P., & Weiss, L. A. (2009). On the relationship between inventory and financial performance in manufacturing companies. International Journal of Operations & Production Management, 29(8), 789–806. doi:10.1108/01443570910977698
- Chen, H., Frank, M. Z., & Wu, O. Q. (2005). What actually happened to the inventories of american companies between 1981 and 2000? Management Science, 51(7), 1015–1031. doi:10.1287/mnsc.1050.0368
- Chen, H., Frank, M. Z., & Wu, O. Q. (2007). U.S. retail and wholesale inventory performance from 1981 to 2004. Manufacturing & Service Operations Management, 9(4), 430–456. doi:10.1287/msom.1060.0129
- Clarke, J. (2018, June 8). High street delivers worst performance in 12 years as retail crisis deepens. The Independent. Retrieved from https://www.independent.co.uk/news/business/news/high-street-sales-fall-royal-wedding-warm-weather-bdo-tracker-a8388391.html
- Cronin, J. J. (1985). Determinants of retail profit performance: A consideration of retail marketing strategies. Journal of the Academy of Marketing Science, 13(4), 40–53. doi:10.1007/BF02737198
- Drukker, D. M. (2003). Testing for serial correlation in linear panel-data models. Stata Journal, 3(2), 168–177. doi:10.1177/1536867X0300300206
- Eroglu, C., & Hofer, C. (2011a). Inventory types and firm performance: Vector autoregressive and vector error correction models. Journal of Business Logistics, 32(3), 227–239. doi:10.1111/j.2158-1592.2011.01019.x
- Eroglu, C., & Hofer, C. (2011b). Lean, leaner, too lean? The inventory-performance link revisited. Journal of Operations Management, 29(4), 356–369. doi:10.1016/j.jom.2010.05.002
- Gaur, V., & Kesavan, S. (2009). “Retail supply chain management.” In retail supply chain management. In N. Agrawal & S. A. Smith (Eds.), International series in operations research & management science (pp. 122:25–52). Boston, MA: Springer US. doi:10.1007/978-0-387-78902-6
- Gaur, V., Fisher, M. L., & Raman, A. (2005). An econometric analysis of inventory turnover performance in retail services. Management Science, 51(2), 181–194. doi:10.1287/mnsc.1040.0298
- Harris, F. (1913). How many parts to make at once. The Magazine of Management, 10(2), 135–136.
- Irwin, S., & Pratti, P. (2018). Research bulletin 15 February 2018. Retrieved from https://plus.credit-suisse.com/rpc4/ravDocView?docid=V7bThy2AF-YBJv
- Isaksson, O. H. D., & Seifert, R. W. (2014). Inventory leanness and the financial performance of firms. Production Planning & Control, 25(12), 999–1014. doi:10.1080/09537287.2013.797123
- Katz, J. N. (2016). What to Do (and Not to Do) with time-series cross-section data Author (S): Nathaniel Beck and Jonathan N. Katz source. The American Political Science Review, 89(3), 634–647. (Sep ., 1995), Published by : American Political Science doi:10.2307/2082979
- Kesavan, S., Kushwaha, T., & Gaur, V. (2016). Do high and low inventory turnover retailers respond differently to demand shocks? Manufacturing & Service Operations Management, August(January), msom.2015.0571. doi:10.1287/msom.2015.0571
- Kesavan, S., & Mani, V. (2013). The relationship between abnormal inventory growth and future earnings for U.S. Public retailers. Manufacturing & Service Operations Management, 15(1), 6–23. doi:10.1287/msom.1120.0389
- Kolias, G. D., Dimelis, S. P., & Filios, V. P. (2011). An empirical analysis of inventory turnover behaviour in greek retail sector: 20002005. International Journal of Production Economics, 133(1), 143–153. doi:10.1016/j.ijpe.2010.04.026
- Rajagopalan, S. (2013). Impact of variety and distribution system characteristics on inventory levels at U.S. retailers. Manufacturing & Service Operations Management, 15(2), 191–204. doi:10.1287/msom.1120.0407
- Rajagopalan, S., & Malhotra, A. (2001). Have U. S. Manufacturing inventories really decreased? An empirical study. Manufacturing & Service Operations Management, 3(1), 14–24. doi:10.1287/msom.3.1.14.9995
- Randall, T., & Ulrich, K. (2012). Product variety, supply chain structure, and firm performance: Analysis of the U.S bicycle industry. Management, 47(12), 1588–1604.
- Rumyantsev, S., & Netessine, S. (2007a). Should inventory policy be lean or responsive? Evidence for US public companies. SSRN Electronic Journal. doi:10.2139/ssrn.2319834
- Rumyantsev, S., & Netessine, S. (2007b). What can be learned from classical inventory models? A cross-industry exploratory investigation. Manufacturing & Service Operations Management. doi:10.1287/msom.1070.0166
- Shockley, J., & Turner, T. (2014). Linking inventory efficiency, productivity and responsiveness to retail firm outperformance: Empirical insights from US retailing segments. Production Planning & Control, 26(5), 1–14. doi:10.1080/09537287.2014.906680
- Statistics Norway. (2008). Standard industrial classification. Official Statistics of Norway. https://www.ssb.no/a/publikasjoner/pdf/nos_d383/nos_d383.pdf.
- Statistics Norway. (2018). GDP per capita, price level adjusted. GDP per Capita, Price Level Adjusted. https://www.ssb.no/en/priser-og-prisindekser/statistikker/ppp.
- Statistics Norway. (2019). Consumer price index. Consumer Price Index. https://www.ssb.no/en/kpi.
- Thomas, D. (2018, March 1). Six reasons behind the High Street crisis. BBC News. Retrieved from https://www.bbc.co.uk/news/business–43240996
- U.S. Bureau of the Census. (2018). Retailers: Inventories to Sales Ratio [RETAILIRSA]. Retrieved August 1, 2018, from https://fred.stlouisfed.org/series/RETAILIRSA
- Williams, B. D., & Tokar, T. (2008). A review of inventory management research in major logistics journals: Themes and future directions. The International Journal of Logistics Management, 19(2), 212–232. doi:10.1108/09574090810895960