
Abstract
The increasing penetration rate of the internet and technology in the world is quickly promoting online shopping. This has been fueled by growing innovations in the telecommunication and financial sector in an attempt to depeen financial inclusion. Innovations such as mobile money payments systems by mobile telephony companies have contributed to the continuous growth in online shopping amidst and the new generation of consumers who desire richer experiences. This study sought to identify the determinants of online shopping behaviour among tertiary students through the lens of the Technology Acceptance Model (TAM). The study proposed a revised TAM that integrated perceived cost and perceived risk to investigate what determined students online shopping intention and actual use. The survey involved a sample of 580 undergraduate students. The statistical technique used was Structural Equation Modelling-Partial Least Squares (SEM-PLS). The results showed that effect of ease of use on usefulness was very significant as same has been predicted by the Technology Acceptance Model. Among the independent variables, perceived cost (PC) was found to be the most significant factor affecting actual use (AU) of online shopping among students, nonetheless, perceived cost (PC) had no significant effect on purchase intention (PI). Perceived risk (PR) had no significant effect on actual use (AU) however, had a significant effect on purchase intention (PI). The study recommends online sellers to make online shopping efficient and less costive with assured safety and security of transactions as well as the product itself. A set of shopping platform could even be created specifically to give discounts and other offers to students. It also recommends future studies to employ additional determining factors such as the type of product/service, convenience and personal/demographic and geographic factors as influential to students’ online purchasing behaviour.
PUBLIC INTEREST STATEMENT
In this 21st century, shopping has become an inevitable aspect in one’s life as human needs are insatiable and it may be done either in the form of the traditional/retail shopping or via online shopping. Both platforms come with different benefits, but the essence of saving time has induced customers, especially the youth, to prefer online shopping to go around physical shops to meet their needs. Online shopping generally grants sellers and buyers (consumers) a common platform to exchange goods and services at a relatively lower price. In developing economies like Ghana, the increasingly high penetration rate of the internet is quickly promoting online shopping. The increased innovations such as mobile money payments systems by mobile telephony companies have also contributed to the continuous growth in online shopping and this has been fuelled by the new generation of consumers who desire richer experiences, much convenience, value for money and better product options.
1. Introduction
In this 21st century, shopping has become an inevitable aspect in one’s life as human needs are insatiable, and it may be done either in the form of the traditional/retail shopping or via online shopping. Both platforms come with different benefits, but the essence of saving time has induced customers, especially the youth, to prefer online shopping to “brick and mortar” shopping. Online shopping has become a fast-growing trend in the world (Kumar, Anand, & Mutha, Citation2016; Priyanka & Ramya, Citation2016) and has witnessed massive growth basically due to the presence of ICT, advanced technology and widespread internet access (Johnson, Citation2015). Gadgets such as smartphones, laptops and tablets have made online shopping convenient and cost-effective. Online shopping generally grants sellers and buyers (consumers) a common platform (mobile applications or websites) to exchange goods and services at a price (Beauchamp & Ponder, Citation2010; Kumar et al., Citation2016). In developing countries like Ghana, the increasingly high penetration rate of the internet is quickly promoting online shopping through mobile commerce as a vital application for participants (consumers and sellers). Technology has also improved the continuous growth in online shopping, and this has been fuelled by the new generation of consumers who desire richer experiences, much convenience, value for money and better options (Sox, Kline, & Crews, Citation2014). Online shopping has created significant opportunities in allowing consumers to shop all the time and everywhere in a truly global online marketplace.
The new generation, especially those in tertiary institutions are usually exposed to technology, hence make regular use of the internet in their everyday activities. As a result, they are inclined to spend more quickly as compared to older folks (Mandhlazi, Dhurup, & Mafini, Citation2013; Parment, Citation2013). Online shopping allows these students to do their shopping activities at the comfort of their homes and hostels while saving time and energy (Deneen & Yu, Citation2018). The use of different payment avenues such as debit cards, credit cards, gift cards, cash on delivery, bank transfers, mobile money, among others has also made online shopping most desirable (Johnson, Citation2015) among this age group. The world internet usage clearly depicts Africa as fast growing in the usage of internet in 2018.
Undoubtedly, Africa has seen the fastest growth rates, with the number of internet users across the continent increasing by more than 20% year-on-year (Stevens, Citation2018). Figure shows the distribution of active internet usage by regions. Ghana has witnessed growth in internet usage mostly coming from the younger generation. The country with a population of 29,463,643 (Ghana Population, Citation2018) and a land area of 238,538 sq km has 10,110,000 internet users. Figure shows that about 35% of the population are using internet.
Increased access and affordbility of internet connectivity has made it easier for most Ghanaians to seek and find information on issues around the globe in real time since the inception of the internet. Research conducted on the growth and usage of internet in Ghana showed that 25–40.6% of Ghanaians depend on the internet as a means of communicating and gathering information on products and services (Kasule, Citation2013). Thus, information retrieval has become easier with the use of search engines, company websites and social networks. And this has given rise to online shopping and purchases as it is one of the most convenient ways of making a purchase. Although the concept is new in Ghana, it is catching up very fast as more people, especially this new generation can now, with a click of a button, make a purchase. Popular online shopping websites such as Jumia, Kikuu, AliExpress, MyEbayGhana among others provide Ghanaians with new shopping experience. As a result, small businesses who cannot afford the costs associated with websites have taken advantage of social media platforms such as Facebook, Whatsapp, Instagram, Twitter, Snapchat among others to showcase the range of products and services to consumers.
Nonetheless, online shopping does not only refer to the medium of shopping but also to the study of the processes or stages an individual or a group goes through in order to purchase, use or dispose products, services, experiences or ideas over the internet. (Jagtap, Citation2013; Priyanka & Ramya, Citation2016). Thus, consumers consider several factors prior to purchasing online, and some of these factors have been found to include perceived usefulness, price, trust and perceived ease of use, gender, marital status, social influence, performance expectancy, habit and facilitating condition (Delafrooz, Paim, & Khatibi, Citation2010; Deneen & Yu, Citation2018; Priyanka & Ramya, Citation2016). Explicitly (Delafrooz et al., Citation2010) stressed that these factors affect consumer’s attitudes towards online shopping and provide an avenue for understanding why consumers prefer to shop online to retail shopping. Despite the presence of literature on online shopping behaviour among consumers (Chawla, Khan, & Pandey, Citation2015; Priyanka & Ramya, Citation2016; Rajan, Varadaraj, & Mathi, Citation2016; Weerasinghe & Peramunugamage, Citation2014), limited research has been conducted to analyse the determinants of online shopping behaviour of tertiary students in Ghana. This study was also developed out of the future directions of studies by (Agrebi & Jallais, Citation2015). Their study was limited to only the antecedents of the technology acceptance model (TAM). They, therefore, argued that it would be useful to identify other antecedents such as “perceived risk” which was extensively used to explain one's intention to use the Web (Chellappa & Pavlou, Citation2002; Featherman, Valacich, & Wells, Citation2006). Previous studies including (Wu & Wang, Citation2005) and (Chen, Citation2008) argued that a risk-free environment is a big challenge for the acceptance of mobile commerce. It is therefore against this background that the study sought to assess the determinants of online shopping behaviour among tertiary students in Ghana through the lens of an Extended Technology Acceptance. In view of this, the study developed the following specific objectives:
to identify the determinants of online shopping behaviour among students
to analyse the effect of these determinants on purchase intentions and actual use
This study was organized into five sections including introduction. In the second section, we conduct a literature review and conceptual framework. The third section describes the research methods and results. The fourth section presents the discussion of the results. Finally, we present conclusion and recommendations, highlighting the main findings and their implications for business strategies and public policy.
2. Literature review and conceptual framework
2.1. Technology acceptance model (TAM)
A lot of theoretical perspectives have been used to understand how consumers make decisions to use technology applications. The most dominant theory used to understand the behaviour of consumers or users of technology is the Technology Acceptance Model (TAM) by (Davis, Citation1989). This study adapted Davis’ TAM (Davis, Citation1989). TAM is rooted on the Theory of Reasoned Action (TRA) and was used to evaluate a user’s computer acceptance, and this is then measured by their intention and the influence on their attitudes, perceived usefulness, perceived ease of use toward the intention to use (Davis, Bagozzi, & Warshaw, Citation1989). TAM originally explained perceived usefulness and usage intention in terms of its social influence and cognitive instrumental processes. The model was later extended to TAM2, which included additional theoretical constructs and cognitive instrumental processes (Venkatesh & Davis, Citation2000). The result from the new TAM2 showed that perceived usefulness and perceived ease of use were determinants of intention to use a technology. Extant literature also supported this result (Heijden, Verhagen, & Creemers, Citation2003; Kim & Hong, Citation2010; Kim & Song, Citation2010; Liu, Chen, Huang, & Yang, Citation2013). Further, (Venkatesh & Bala, Citation2008) later combined TAM2 (Venkatesh & Davis, Citation2000) and the model of the determinants of perceived ease of use (Venkatesh, Citation2000) and developed an integrated model of technology acceptance called TAM3. The TAM3 had the perceived ease of use to perceived usefulness, computer anxiety to perceived ease of use and perceived ease of use to behavioural intention all being moderated by experiences.
Due to these modifications, however, Bagozzi (Citation2007) urged that the TAM model must be used with caution as perceived usefulness and perceived ease of use might not properly examine usage behaviour. In a study by Chuttur (Citation2009), he suggested that future research should investigate and develop new models that focus on the strengths of the TAM (the original and modified) while minimising its weaknesses. The current study, therefore, included perceived costs and perceived risks to the conceptual framework because of this shortcoming that was found in the TAM. Similarly, it is believed that customers in the face of perceived risks of online shopping will also consider the total cost of buying an item online as against getting same from the traditional (retail) or brick and mortar way of shopping and also, risks and costs of online shopping have been found to influence intentions to engage in online shopping in developing countries (Ovčjak, Heričko, & Polančič, Citation2015; Sanakulov & Karjaluoto, Citation2015).
2.2. Online shopping determinants
2.2.1. Perceived usefulness
(Davis, Citation1989) suggested that the power to attract and retain online shoppers rely mostly on the usability and usefulness of the technology. Perceived usefulness of the applications or tools for shopping online can also influence online shoppers to continue to shop over the internet or rely on the conventional methods. Davis emphasized that perceived usefulness is an important predictor of one’s intention of using a new technology (Venkatesh, Morris, Davis, & Davis, Citation2003). With online shopping, perceived usefulness deals with the degree to which a person believes that involving in online transactions would improve his/her performance (Park & Kim, Citation2003). Extant literature (Shuhaiber & Mashal, Citation2019) (Alalwan, Baabdullah, Rana, Tamilmani, & Dwivedi, Citation2018; Gong, Stump, & Maddox, Citation2013; Lian & Yen, Citation2014; Weerasinghe & Peramunugamage, Citation2014) have clearly suggested the significant influence of perceived usefulness on intention to use e-commerce. On the contrary, a study by (Chen & Mei, Citation2017) on college students’ perception and evaluation of mobile Internet advertising showed that the impact of perceived usefulness is not significant on actual use.
Hence, it was hypothesised:
H1: Perceived usefulness has a significant relationship to purchase intention
H2: Perceived usefulness has a significant relationship to actual use of online shopping
2.2.2. Perceived ease of use
According to (Davis, Citation1989), perceived ease of use deals with the degree to which a person believes that using a given system will be less costly in terms of effort or that the activity will be free of effort. Although it is undeniable that online shopping has been surmised to several beneficial outcomes, the need to use interactive website or applications could prove to be very daunting for some consumers. However, if this negative perception associated with the process falls below its perceived benefits of online purchasing, then potential online shoppers are likely to join existing online shoppers and thus stop using conventional channels. Many factors influence consumers of an electronic or digital product or service. As Davis rightly puts it, among the multidimensional factors described in his model, emphasis is put on the perceptions of ease of use having a strong influence on perceived usefulness; an important predictor of one’s intention of using a new technology (Venkatesh et al., Citation2003). Simply put, perceived ease of use influences perceived usefulness which eventually influences the consumer’s intention to use online shopping. Online shoppers perceive online shopping as easy to use if it provides enough product information, aids comparability of products/services, easy to learn and use applications, have sites which are easy to use and flexible to interact with (Choudhury & Dey, Citation2014; Wang, Lin, & Luarn, Citation2006; Zaman & Arslan, Citation2014). Studies including (Dutot, Bhatiasevi, & Bellallahom, Citation2019; Li, Chung, & Fiore, Citation2017; Shuhaiber & Mashal, Citation2019;) and (Siregar, Puspokusumo, & Rahayu, Citation2017) all found a significant relationship between perceived ease of use and perceived usefulness in their study of mobile commerce. However, (Wu & Wang, Citation2005) and (Alalwan et al., Citation2018) found no significant relationship between perceived ease of use and intention.
Hence, it was hypothesised:
H3: Perceived ease of use has a significant relationship to purchase intention.
H4: Perceived ease of use has a significant relationship to actual use of online shopping.
H10: Perceived ease of use has a significant relationship to perceived usefulness.
2.2.3. Perceived risk
Perceived risk has been defined as an assessment of uncertainties or a lack of knowledge about the occurrence of potential outcomes (March, Citation1978) and how one cannot control the outcome (Vlek & Stallen, Citation1980). Hence, it is regarded an important concept of consumer behaviour and it is mostly used to explain both perception of risks and risk reduction approaches implemented by consumers (McOmish & Quester, Citation2005). (King & He, Citation2006) defined perceived risk as a user’s subjective expectation of suffering a loss in relation to the expected outcome. It can also be defined as the degree to which an individual expresses uncertainty about a product or service (Dai, Forsythe, & Kwon, Citation2014). According to (Li & Zhang, Citation2002), perceived risk has two (2) major elements which are involved in determining consumers’ behaviour during online shopping. The first element has to do with financial risk, product risk, time risk while the other element involves e-transactions including security and privacy. In Ghana, most of the online shopping payments made by students use mobile money as a medium of payment; hence, e-transactions security and privacy among students are not widespread. However, students consider the financial, product and time risk of doing online shopping as compared to retail shopping. It is evident, moving through pages on online shopping for them conveys no risk because they even save up time and energy on shopping at the comfort of their halls and hostels.
A study by (Wu & Wang, Citation2005) suggested a striking positive significant relationship between perceived risk and intention of mobile commerce drivers. Other contemporary literature (Dai et al., Citation2014; Gozukara, Ozyer, & Kocoglu, Citation2014; Kumar & Dange, Citation2014; Mizanur & Sloan, Citation2017; Samadi & Yaghoob-Nejadi, Citation2009) have argued that perceived risk such as financial risk, time risk, privacy risk, social risk, personal risk, product risk and information risk has significant difference on consumers’ online shopping behaviour. Hence, it was hypothesised:
H5: Perceived risk has a significant relationship to purchase intention
H6: Perceived risk has a significant relationship to actual use of online shopping
2.2.4. Perceived cost
According to (Choudhury & Dey, Citation2014), cost deals with possible expenses incurred in using online shopping applications and other costs such as access costs, transaction fees and equipment costs as compared to retail shopping. (Wu, Chen, Chen, & Cheng, Citation2014) added that perceived costs associated with online transactions generally arise from information asymmetry and investment in specific assets which may hinder consumers from engaging in relational exchanges. Thus, perceived costs of online shopping include transportation, price comparisons and product searches done easily online; however, time-consuming when retail shopping is done. Online shoppers generally assess the costs and benefits of shopping online before committing to it (Chang & Wang, Citation2011; Chiou & Droge, Citation2006; Chiou, Citation2010; Wu et al., Citation2014). This situation is no different from students, as they consider the cost of moving from one shop to the next in search of their need high as compared to surfing online for their needs and in comfort. Hence, (Gao, Citation2015) and (Aragoncillo & Orus, Citation2018) stressed that most online shoppers perceive cost factors such as cost involved in searching for needs, prices of online goods and transportation cost prior to buying online. However, a current study by (Mizanur & Sloan, Citation2017) found perceived cost to have a negative influence on intention. It is evident perceived cost plays an important role on the intention to do an online shopping and shopping online as compared to the cost of engaging in retail shopping. Hence, it was hypothesised:
H7: Perceived cost has a significant relationship to purchase intention.
H8: Perceived cost has a significant relationship to actual use of online shopping.
2.2.5. Purchase intention
(Fishbein & Ajzen, Citation1975) defined a purchase intention as an actual behaviour that determines a person’s behavioural intention in the sense that attitudes clearly reflect beliefs, intentions accurately reflect attitudes and behaviour accurately reflect intentions. Purchase/behavioural intention is also defined as “the degree to which a person has formulated conscious plans to perform, or not perform, some specified future behaviour” (Davis, Citation1989). (Hsu, Yen, Chiu, & Chang, Citation2006) stressed that purchase intention has a strong causal relationship with actual behaviour. The intention of online shopping deals with the user’s likelihood to engage in online transactions in the future (Wu, Yeh, & Hsiao, Citation2011). It is evident that an increase in purchase intention reflects an increase in the chance of making actual purchase. Anytime a consumer has a positive purchase intention, then a positive brand engagement will promote the actual usage. In relation to the context of online shopping, one needs to consider purchase intention as the desire of consumers to make a purchase through an online application (Chen, Hsu, & Lin, Citation2010).
Hence, it was hypothesised:
H9: Purchase intention has a significant relationship to actual use of online shopping.
2.2.6. Actual usage
According to (Ariff, Yan, Zakuan, Bahari, & Jusoh, Citation2013), actual usage is the frequency of shopping online and the approximate number of times a user shop within a given time period. According to (Muda, Mohd, & Hassan, Citation2016) there are three (3) major factors influencing actual usage of online shopping tools and they include brand image, self-efficacy and social brand communication (which involves perceived ease of use, risk, cost among others). These factors were adopted from other scholars (Aghekyan-Simonian, Forsythe, Kwon, & Chattaraman, Citation2012; Keller, Citation1993; Kwon & Lennon, Citation2009).
It is evident from the reviews that several factors have been approved to influence online purchasing behaviour among youths especially students in various universities across the globe. Perceived risks, as a major factor, have been found to negatively influence consumers’ online purchase intention (Gozukara et al., Citation2014; Mizanur & Sloan, Citation2017), whereas the other factors such as perceived usefulness, attitude, behavioural intentions, perceived ease of use, actual usage and perceived cost have positive and significant influence on consumers’ online purchase intention.
2.3. Conceptual framework
The study developed a conceptual framework based on existing literature. Based on extant literature, factors perceived to influence online purchasing behaviour among students include perceived usefulness, perceived risk, purchase intention to online shopping, perceived ease of use, actual usefulness and perceived cost (Chiou & Pan, Citation2009; Choudhury & Dey, Citation2014; Davis, Citation1989; Hsieh & Liao, Citation2011; Li & Zhang, Citation2002). The coneptual framework is shown in Figure .
3. Research methods and results
3.1. Data source and data collection
The population for the study comprised all regular students in the University during the 2018/2019 academic year. With a population proportion of 50%, alpha level of 0.05 and a confidence level of 95%, the sample size from (Krejcie & Morgan, Citation1970) table was 377 given a population of 20,400 regular students. This sampling table provides a scientific justification for choosing the sample size of the study. However, with a non-response rate of 65%, the final sample size was 580 to cater for non-response as proposed by scholars in marketing research (Baruch & Holtom, Citation2008). The convenience sampling technique was used to select the respondents for the study. The data analysis technique is flexible and makes no assumptions about the underlying data (i.e it is non-parametric), nevertheless, larger sample size increases the precision of PLS-SEM estimates (Hair, Ringle, & Sarstedt, Citation2011).
The data for the study were primary. It was collected through self-administered questionnaires. The questionnaire included questions on the variables: perceived usefulness, perceives ease of use, perceived risk, perceived costs, attitude towards behaviour, behavioural intention, costs and actual usage. The items in the questionnaire were originally derived from (Chiou & Pan, Citation2009; Choudhury & Dey, Citation2014; Davis, Citation1989; Hsieh & Liao, Citation2011) and (Li & Zhang, Citation2002). Respondents were asked to rate on a scale of 1–5 from weak agreement to strong agreement. First, the questionnaires were entered in SPSS version 24 and all data cleaning techniques applied. A total of 580 questionnaires were issued, 506 were returned but 473 were fully responded to and thus were used for the analysis in this chapter. Therefore, the response rate was 82%. The returned questionnaires were 506. Since the returned questionnaires were still more than the minimum sample size required, cases with missing data were deleted using the listwise deletion because according to (Little Roderick & Rubin Donald, Citation1987) and (Roth, Citation1994) if the proportion of cases with missing data is small, for example, 5% or less, listwise deletion may be acceptable.
3.2. Data analysis and results
Partial Least Squares Structural Equation modelling (PLS-SEM) was used to test the hypothesised relationships using SmartPLS 3 (Ringle, Wende, & Becker, Citation2015). The measurement models were assessed to evaluate the individual loadings of each item, composite reliability, average variance extracted (AVE), and discriminant validity. The structural model was then evaluated to determine the significance of the causal paths corresponding to the hypotheses. The structural model in SEM-PLS depicts the relationships among the latent variables based on the theoretical framework. The latent variable estimates are linear aggregates of their observed indicators, whose weights are obtained via the PLS estimation procedure as specified by the inner and outer models.
3.2.1. Socio-demographic characteristics of respondents
The results from Table A depicts majority (243) of the respondents were males. This represents about 51.4%. Thus, (230) respondents were female, representing 48.6%. Three hundred and thirty-seven (337) of the respondents had age distribution of 20 to 25 years, denoting about (71.2%) of the respondents, followed by those below 20 years (88) representing (18.6%). This was followed by those in the age group 26 to 30 years, these were thirty-six (36) representing 7.6%. Those above 30 years were twelve (12) representing 2.5%.
3.2.2. Reliability and validity assessment of the measurement model
Reflective measurement models are assessed on their internal consistency reliability and validity. The structural model estimates are examined only after reliability and validity of constructs have been established. In this study, an examination of item loadings, composite reliability, convergent and discriminant validity was carried out. Since PLS SEM includes factor analysis in its estimation, each indicators’ loadings are displayed on the measurement model, so that indicators that have values below the standardized loading of 0.7 usually is deleted (Hair et al., Citation2011). Table shows the results of the various measures of reliability tests. The average variance extracted was also presented. Other advanced tests such as Fornell-Larcker criterion, cross-loadings and Heterotrait–Monotrait Ratio were also carried out.
The traditional criterion for internal consistency reliability is Cronbach’s Alpha, which has been found to be sensitive to number of items in the scale. Besides, according to (Hair, Sarstedt, Ringle, & Gudergan, Citation2017), Cronbach alpha assumes that all the indicators have equal outer loadings on the construct which is not the case. From Table , composite reliability loadings are all above 0.7, showing higher levels of reliability (Hair et al., Citation2017).
3.2.3. Construct validity tests
Two main tests are examined: convergent and discriminant validity tests. Convergent validity test measures the relatedness of indicators to its constructs or latent variables. In other words, convergent validity assesses whether indicators measure only the underlying constructs and nothing else. In measuring convergent validity, each measurement item should have loadings above 0.708 and average variance extracted (AVE) of 0.50 or higher (Hair et al., Citation2011). From Table A, the inspection of the AVE showed that all the constructs had more than 50% of the variance explained by their corresponding indicators. Further, the cross-loading approach (see Table A) to discriminant validity, according to (Henseler et al., Citation2014) is determined when a construct indicator shows weak correlation with all other constructs except the one to which it is theoretically associated. Results from Table A confirm the presence of discriminant validity.
Examination of the cross-loadings in Table A shows high loadings of indicators to their underlying constructs and lower loadings on other constructs, thus an indication of discriminant validity. In addition to the correlations presented, Table A also presents another test of discriminant validity as proposed by Fornell Larcker (Fornell & Larcker, Citation1981). With the Fornell Larcker criteria, the square root of the AVE should be higher than the highest correlation between the underlying construct and other constructs. From the table square root of the AVE is higher for all constructs again showing the presence of discriminant validity, and hence the quality of the measurement model.
From Table A, there are significant correlations among the independent variables. However, the magnitude is not enough to cause multicollinearity. According to (Farrar & Glauber, Citation1967) and (Alin, Citation2010) multicollinearity is not likely to occur where correlation coefficient is below 0.8. In this study, the highest correlation reported was .716 (p < 0.01), between perceived ease of use and actual use. However, overtime cross-loadings and Fornell-Lacker criterion for discriminant validity assessment has been found to produce misleading results when multicollinearity is present. A remedy suggested by (Henseler, Ringle, & Sarstedt, Citation2015) is to evaluate the Heterotrait–Monotrait ratio of the correlations. This is presented in Table A.
(Alin, Citation2010) suggests that HTMT value above 0.9 indicates an absence of discriminant validity. From Table A, all values are below 0.9, an indication of discriminant validity.
3.3. Assessment of the structural model
Assessment of the structural model involves the model’s ability to predict the endogenous variables or constructs. Assessment of the structural model follows a procedure suggested by (Hair et al., Citation2017). In the first stage, the structural model is assessed for collinearity issues. Next is establishing the significance of the path coefficients. Examining the predictive power of the model (coefficient of determination, R2), followed by the assessment of the effect size (f2), the predictive relevance (Q2) and finally, the effect size (q2).
3.3.1. Collinearity statistics
Following the structural model assessment procedure, there is a need to check the model for collinearity. Multicollinearity is observed when there are several correlations of sufficient magnitude which together would predict a large percentage of the variance in the dependent variable. The inner VIF values checked for collinearity issues. Specifically, the following constructs were assessed for collinearity: first, perceived costs, perceived EOU, perceived risk, perceived usefulness and purchase intention as predictors of actual use, and second perceived costs, perceived EOU, perceived risk, perceived usefulness as predictors of purchase intention. All the VIF values are below the threshold level of 5 (see Table A). This means that collinearity is not an issue in the structural model.
3.3.2. Testing the significance of the path model
In structural equation modelling, the bootstrapping procedure is a resampling technique used to establish statistical significance. Based on the original sample, it works by drawing many subsamples and estimating models for each subsample. Estimates from all the subsamples are then combined, providing not only the “best” estimated coefficients (e.g., means of each estimated coefficient across all the subsample models), but their expected variability and thus their likelihood of differing from zero, that is, are the estimated coefficients statistically different from zero or not?
This approach does not rely on statistical assumptions about the population to assess statistical significance, but instead makes its assessment based solely on the sample data. In SmartPls (Ringle et al., Citation2015), the bootstrap results are displayed on the path model. At 95% significance (two tail), any value above 1.96 is statistically significant. In marketing, studies have usually assumed significance level of 5% (Hair et al., Citation2017). However, in some consumer studies, 1% is used when experiments are involved. The results of the path modelling are depicted in Figure A.
Table A shows results of the hypothesised relationships among constructs. The path coefficients have standardised values approximately between −1 and +1. The closer the estimated path coefficient to 1, the stronger the predicted relationship. On the other hand, the closer the estimated coefficients are to 0, the weaker are the relationships. Observation of the coefficient shows positive relationships among all the construct though the magnitude of the effect differs across. The bootstrapping procedure was used to test the significance of the path coefficients. The path coefficients show the effect of the independent variables on the dependent variables.
3.4. Presentation of hypothesised results
The results showed that out of the 10 hypotheses, three null hypotheses: H2 (0.084, p > .05), H6 (0.017, p > 0.05) and H7 (0.074, p > .05) were not rejected. Effect of ease of use on usefulness was very significant as same has been predicted by the Technology Acceptance Model. Perceived ease of use refers to the degree to which the prospective user expects the target system to be free of effort. With the increasing e-literacy rate among the youth, coupled with general mandatory ICT and computer literacy training in all tertiary education in Ghana, one expects most of the respondents are becoming ICT inclined with usage of electronic commerce and its related platforms. Perceived usefulness has been defined as the prospective user’s subjective probability that using a specific application system will increase his or her job performance. In this context, performance could be looked at from the perspective of quality and ease with which less time is spent on acquiring items through online shopping.
According to (Davis et al., Citation1989) improvements in ease of use contributes to increased performance. Effort saved due to improved ease of use may be re-channelled to other activities, enabling a person to accomplish more work for the same amount of effort. The relationship was also confirmed by the effect size (0.886, p < .05). In the same fashion, there was a significant positive relationship between Perceived usefulness and purchase intention (3.349, p < .05). Thus, time savings through online shopping influenced the willingness of a customer to buy a certain product or a certain service. The relationship between Perceived ease of use and purchase intention was also found to be positive and significant (6.278, p < .05). Similar relation was reported between Perceived ease of use and actual use (5.329, p < .05)
Further, perceived cost highly influenced online shopping adoption. One key benefit online shopping provides over “brick and mortar” is pairwise comparison of prices with just a click of a mouse. Examination of the path coefficient confirms that there is a significant positive relationship between perceived costs and actual use (H8) than was found between perceived costs and purchase intention (H7). This implies that the lower prices usually offered by online shops could influence someone to buy on impulse without necessarily having the intention to buy.
Again, perceived risk was another factor that was looked at in this study. Perceived risk basically looked at the level of exposure, security of transactions and payment and privacy. Questions asked respondents on their perception of risk included:
It is less risky to do online shopping than retailing shopping in terms of purchase transactions
Online shopping is less risky because its applications and mode of transactions are well secured
From Table A, rejection of H5 (5.449, p < .05) proved that lower levels of Perceived risk significantly and positively associated with purchase intentions.
3.4.1. Adjusted R-square
The coefficient of determination (R2) measures the predictive power of the regression model. The Adj. R2 shows the amount of variance in the endogenous construct explained by the exogenous constructs. In Table A, the adj. R2 of 0.621 (p < .05) showed that perceived cost, perceived risk, perceived ease of use, perceived usefulness and purchase intention jointly explain 62.1% of the variance in the dependent variable (actual usage of online shopping). Again, the model also tested the effect of perceived cost, perceived risk, perceived ease of use and perceived usefulness on Purchase intention, and the adj. R2 of 0.538 (p < .05) was significant. Table A shows the results of bootstrapping which tests the null hypothesis of the effect of the independent variables.
3.4.2. Effect size (f2)
In addition to evaluating the predictive power of the model, the change in R2 values when a specified exogenous construct has been omitted can be used to assess whether the omitted construct has a substantive impact on the endogenous construct. This measure is called the effect size (f2)
3.4.3. Effect size (F-square)
(Cohen, Citation1992) provides a guideline for assessing f2. Below 0.02* is considered no effect. From 0.02 to 0.14** is considered small, 0.15 to 0.34*** is medium and 0.35**** and above is large. From Table A, perceived cost has a medium effect on actual use. Perceived cost has no effect on purchase intentions. Perceived ease of use (EOU) has weak effect on actual use and purchase intentions. Perceived risk has no effect on actual use; however, it recorded weak effect on purchase intentions. Perceived usefulness has no effect on actual use, and weak effect on purchase intentions. Finally, purchase intentions recorded a weak effect on actual usage. Thus overall, costs are a key determinant of the usage of online shopping.
3.4.4. Predictive relevance
The blindfolding procedure was used to examine the predictive relevance of the model.
The Q2 values for all the three endogenous constructs are above zero. (Cohen, Citation1992) provides a guideline for assessing Q2. From 0.02 to 0.14 is considered weak, 0.15 to 0.34 is moderate and 0.35 and above is a strong effect. From the model, actual use has a strong effect. Whiles perceived usefulness and purchase intention achieved a moderate effect. This provides support for the model’s predictive relevance (Akter, D’Ambra, & Ray, Citation2011).
4. Discussion
The study sought to assess the determinants of online shopping behaviour among tertiary students at the University of Cape Coast. It proposed a revised TAM that integrated perceived cost and perceived risk to investigate what determined students online shopping intention and actual use. Among the independent variables, perceived cost (PC) was found to be the most significant factor affecting actual use (AU) of online shopping among students. This is predictable as most students depend on the parents or guardians for upkeeps especially in terms of pocket money. It is therefore not a surprise that students will consider the online cost of the products, searching for their needs online, and savings (in terms of transportation cost) on products as compared to retail shopping before making the utmost decision of actual usage. Supporting findings of previous research include (Chang & Wang, Citation2011; Chiou & Droge, Citation2006; Chiou, Citation2010; Wu et al., Citation2014). Nonetheless, perceived cost (PC) had no significant effect on perceived intention (PI). This is arguably caused by the indifferent attitude of students on the intention to use and actual usage of online shopping and cost had no bearing on the thought process of behavioural intention.
Perceived ease of use (PEOU) had a significant though weak effect on both actual use and purchase intention but had a strong significant effect on perceived usefulness. This finding is in support of Davis, as he clearly stipulated that among the multidimensional factors described in his model, emphasis is placed on the perceptions of ease of use having a strong influence on perceived usefulness; an important predictor of one’s intention of using a new technology (Venkatesh et al., Citation2003). This confirms that the ease and flexibility of using and getting enough product information online and comparing products in online shopping aids students in making prompt purchase decisions. It is reasonable that perceived ease of use influences perceived usefulness which eventually influences the consumer’s intention to use and actual usage of online shopping. Supported literature includes (Alalwan et al., Citation2018; Choudhury & Dey, Citation2014; Dutot et al., Citation2019; ; Li et al., Citation2017; Shuhaiber & Mashal, Citation2019; Wang et al., Citation2006; Wu & Wang, Citation2005; Zaman & Arslan, Citation2014).
Similarly, perceived usefulness had a significant though the weak relationship with purchase intention but no effect on actual use. As stated earlier, Davis emphasized that perceived usefulness is an important predictor of one’s intention of using a new technology (Venkatesh et al., Citation2003). The import is that, perceived usefulness deals with the degree to which a person believes that involving in online transactions would improve his/her performance (Park & Kim, Citation2003) and students perceive that this aids their productivity online and purchase intention. Supporting literature includes (Agrebi & Jallais, Citation2015; Alalwan et al., Citation2018; Lian & Yen, Citation2014; Shuhaiber & Mashal, Citation2019) and (Gong et al., Citation2013). These studies have clearly suggested the significant influence of perceived usefulness on intention. Additionally, a study by (Chen & Mei, Citation2017) on college students’ perception and evaluation of mobile Internet advertising showed that the impact of perceived usefulness is not significant on actual use. Thus, the perceived usefulness of the application does not ultimately translate into the frequent use of the application.
In the same way, perceived risk had a significant though weak relationship with purchase intention but no effect on actual use. This finding is supported by (Wu & Wang, Citation2005) who found a striking positive significant relationship between perceived risk and intention on mobile commerce drivers. However, it goes contrary to current literature (Dai et al., Citation2014; Gozukara et al., Citation2014; Kumar & Dange, Citation2014; Mizanur & Sloan, Citation2017; Samadi & Yaghoob-Nejadi, Citation2009) which measured risk in terms of privacy, social, personal, product risk and information risk. Obviously, the risks compared between online shopping and retail shopping, does not affect the students’ ability to use the online shopping application frequently with ease, neither does it have any effect on the actual usage of the product as well. Finally, purchase intention had a significant relationship with actual use. As rightly put by (Hsu et al., Citation2006), purchase intention has a strong causal relationship with actual behaviour. Thus, students’ willingness to spend more time and money in shopping online as well as the intention to recommend such online shopping sites to friends and family actually affects the satisfaction of the usage of the product acquired. The few studies done on the purchase intention and actual use also support this finding (Chen et al., Citation2010; Wu et al., Citation2011).
5. Conclusion and recommendations
The internet has become a powerful tool for those who are able to manage and use it effectively. Online shopping is the fastest growing market and hence businesses are obliged to move in that direction since consumers no longer prefer long hours of moving from one retail shop to the next for a product. Although all the conventional indicators of TAM predicted actual usage, path analyses results from this study confirm that consumers consider cost as the strongest determinant of the actual use of online shopping but not necessarily the risk. It is therefore prudent for online sellers to make online shopping efficient, less costive as well as secured transactions and products. Evidently, online shopping does away with physical customer service and a lot of physical inconveniences experienced in “brick and mortar” shopping. Sellers need to make consumers have an experiential uniqueness which will make them have a rebuy. The shopping websites should be easy to navigate by anyone not necessarily demanding special skills and a platform for shopping specifically for students can be created to give discounts and other competitive deals to students. This radical change in shopping is here to stay as internet usage growth and access to information keeps soaring especially in Africa as it makes life in the shopping world more convenient.
5.1. Limitations and future studies
While this study provided stimulating acumens into the determinants of online shopping among tertiary students, it has some limitations. First, this study did not determine students’ reactions to these online shopping over time (post review). Also, although online shopping is an emerging market especially among students, the types of applications available in Ghana are limited hence students were only restricted to the available ones. This provides an insufficient information about online shopping among students as they are restricted by choice. The framework also revealed the study’s limitations in terms of the factors employed, although they were quite significant. The study recommends other factors such as the type of product, convenience and personal/demographic factors and even geographical factors as influential to students’ online purchasing behaviour.
Declaration of Interest statement
Authors declare the absence of conflict of interest in this study.
Additional information
Funding
Notes on contributors
Daniel Ofori
Daniel Ofori is a lecturer in procurement and supply chain in the Department of Marketing and Supply Chain Management, University of Cape Coast. He is a second-year PhD (Business Administration) student in the School of Business, University of Cape Coast. He is also a full professional member of the Chartered Institute of Procurement and Supply, (MCIPS, UK). His research interest includes supply chain of electronic and electrical equipment, electronic business, procurement management, sustainable consumption and production in supply chains.
Christina Appiah-Nimo
Christina Appiah-Nimo is currently a Ph.D. student at Tomas Bata University in Zlin, Czech Republic. She holds a Master of Commerce in Marketing and Bachelor of Management Studies, all from the University of Cape Coast, Ghana. Christina is open to research areas including Marketing and innovation, entrepreneurship development and sustainability, and Small and Medium Enterprises Development.
Related Research Data
References
- Aghekyan-Simonian, M., Forsythe, S., Kwon, W. S., & Chattaraman, V. (2012). The role of product brand and online store image on perceived risks and online purchase intentions for apparel. Journal of Retailing and Consumer Services, 19(3), 325–20. doi:10.1016/j.jretconser.2012.03.006
- Agrebi, S., & Jallais, J. (2015). Explain the intention to use smartphones for mobile shopping. Journal of Retailing and Consumer Services, 22, 16–23. doi:10.1016/j.jretconser.2014.09.003
- Akter, S., D’Ambra, J., & Ray, P. (2011). An evaluation of PLS based complex models: The roles of power analysis, predictive relevance and GOF index. AMCIS 2011 Proceedings - All Submissions, 151. Retreived from http://aisel.aisnet.org/amcis2011_submissions/151
- Alalwan, A. A., Baabdullah, A. M., Rana, N. P., Tamilmani, K., & Dwivedi, Y. K. (2018). Examining adoption of mobile internet in Saudi Arabia: Extending TAM with perceived enjoyment. Innovativeness and Trust. Technology in Society, 55, 100–110. doi:10.1016/j.techsoc.2018.06.007
- Alin, A. (2010). Multicollinearity. Wiley Interdisciplinary Reviews: Computational Statistics, 2(3), 370–374. doi:10.1002/wics.84
- Aragoncillo, L., & Orus, C. (2018). Impulse buying behaviour: An online-offline comparative and the impact of social media. Spanish Journal of Marketing - ESIC, 22(1), 42–62. doi:10.1108/SJME-03-2018-007
- Ariff, M. S. M., Yan, N. S., Zakuan, N., Bahari, A. Z., & Jusoh, A. (2013). Web-based factors affecting online purchasing behaviour. IOP Conference Series: Materials Science and Engineering, 46(1), 012038. IOP Publishing. doi:10.1088/1757-899X/46/1/012038
- Bagozzi, R. P. (2007). The legacy of the technology acceptance model and a proposal for a paradigm shift. Journal of the Association for Information Systems, 8(4), 3. doi:10.17705/1jais.00122
- Baruch, Y., & Holtom, B. C. (2008). Survey response rate levels and trends in organizational research. Human Relations, 61(8), 1139–1160. doi:10.1177/0018726708094863
- Beauchamp, M. B., & Ponder, N. (2010). Perceptions of retail convenience for in-store and online shoppers. The Marketing Management Journal, 20(01), 49–65.
- Chang, H., & Wang, H. W. (2011). The moderating effect of customer perceived value on online shopping behaviour. Online Information Review, 35(3), 333–359. doi:10.1108/14684521111151414
- Chawla, M., Khan, M. N., & Pandey, A. (2015). Internet usage and online shopping: Differences based on gender of students. International Journal of Engineering Technology, Management and Applied Sciences, 3(1), 75–81.
- Chellappa, R. K., & Pavlou, P. A. (2002). Perceived information security, financial liability and consumer trust in electronic commerce transactions. Logistics Information Management, 15(5/6), 358–368. doi:10.1108/09576050210447046
- Chen, G., & Mei, F. Research on the Willingness to Accept Mobile Internet Advertising Based on Customer Perception-A Case of College Students. In WHICEB, (2017, May), 12.
- Chen, L. D. (2008). A model of consumer acceptance of mobile payment. International Journal of Mobile Communications, 6(1), 32–52. doi:10.1504/IJMC.2008.015997
- Chen, Y. H., Hsu, I. C., & Lin, C. C. (2010). Website attributes that increase consumer purchase intention: A conjoint analysis. Journal of Business Research, 63, 1007–1014. doi:10.1016/j.jbusres.2009.01.023
- Chiou, J. S. (2010). Strategic marketing analysis: Framework and practical application (3rd ed.). Taipei, Taiwan: Bestwise Co. Ltd.
- Chiou, J. S., & Droge, C. (2006). Service quality, trust, specific asset investment, and expertise: Direct and indirect effects in a satisfaction-loyalty framework. Journal of the Academy of Marketing Science, 34(4), 613–627. doi:10.1177/0092070306286934
- Chiou, J. S., & Pan, L. Y. (2009). Antecedents of internet retailing loyalty: Differences between heavy versus light shoppers. Journal of Business and Psychology, 24(3), 327. doi:10.1007/s10869-009-9111-7
- Choudhury, D., & Dey, A. (2014). Online shopping attitude among the youth: A study on University students. International Journal of Entrepreneurship and Development Studies, 2(1), 23–32.
- Chuttur, M. Y. (2009). Overview of the technology acceptance model: Origins, developments and future directions. Working Papers on Information Systems, 9(37), 9–37.
- Cohen, J. (1992). A power primer. Psychological Bulletin, 112(1), 155. doi:10.1037/0033-2909.112.1.155
- Dai, B., Forsythe, S., & Kwon, W. S. (2014). The impact of online shopping experience on risk perceptions and online purchase intentions: Does product category matter? Journal of Electronic Commerce Research, 15(1), 13–24.
- Davis, F. D. (1989). Perceived usefulness, perceived ease of use, and user acceptance of information technology. MIS Quarterly, 13, 3, 318–340. doi:10.2307/249008
- Davis, F. D., Bagozzi, R. P., & Warshaw, P. R. (1989). User acceptance of computer technology: A comparison of two theoretical models. Management Science, 35(8), 982–1003. doi:10.1287/mnsc.35.8.982
- Delafrooz, N., Paim, H. L., & Khatibi, A. (2010). Students’ online shopping behavior: An empirical study. Journal of American Science, 6(1), 137–147.
- Deneen, K., & Yu, D. (2018, March 17). Online shopping is making many customers antagonistic. Gallup. Retrieved from https://news.gallup.com/businessjournal/182006/online-shopping-making-customers-antagonistic.aspx
- Dutot, V., Bhatiasevi, V., & Bellallahom, N. (2019). Applying the technology acceptance model in a three-countries study of smartwatch adoption. The Journal of High Technology Management Research, 30, 1–14. doi:10.1016/j.hitech.2019.02.001
- Farrar, D. E., & Glauber, R. R. (1967). Multicollinearity in regression analysis: The problem revisited. The Review of Economic and Statistics, 92–107.
- Featherman, M. S., Valacich, J. S., & Wells, J. D. (2006). Is that authentic or artificial? Understanding consumer perceptions of risk in e‐service encounters. Information Systems Journal, 16(2), 107–134. doi:10.1111/isj.2006.16.issue-2
- Fishbein, M., & Ajzen, I. (1975). Belief, attitude, intention, and behavior: An introduction to theory and research. Reading, Mass: Addison-Wesley Pub. Co.
- Fornell, C., & Larcker, D. F. (1981). Evaluating structural equation models with unobservable variables and measurement error. Journal of Marketing Research, 18(1), 39–50. doi:10.1177/002224378101800104
- Gao, L. (2015). Understanding consumer online shopping behaviour from the perspective of transaction costs (Doctoral dissertation). University of Tasmania.
- Ghana Population. (2018). Retrieved from http://worldpopulationreview.com/countries/ghana/
- Gong, W., Stump, R. L., & Maddox, L. M. (2013). Factors influencing consumers’ online shopping in China. Journal of Asia Business Studies, 7(3), 214–230. doi:10.1108/JABS-02-2013-0006
- Gozukara, E., Ozyer, Y., & Kocoglu, I. (2014). The moderating effects of perceived use and perceived risk in online shopping. Journal of Global Strategic Management, 16, 67–81. doi:10.20460/JGSM.2014815643
- Hair, J., Jr, Sarstedt, F., Ringle, M. C. M., & Gudergan, S. P. (2017). Advanced issues in partial least squares structural equation modeling. Thousand Oaks, CA: Sage Publications.
- Hair, J. F., Ringle, C. M., & Sarstedt, M. (2011). PLS-SEM: Indeed a silver bullet. Journal of Marketing Theory and Practice, 19(2), 139–152. doi:10.2753/MTP1069-6679190202
- Heijden, H. V. D., Verhagen, T., & Creemers, M. (2003). Understanding online purchase intentions: Contributions from technology and trust perspectives. European Journal of Information Systems, 12(1), 41–48. doi:10.1057/palgrave.ejis.3000445
- Henseler, J., Dijkstra, T. K., Sarstedt, M., Ringle, C. M., Diamantopoulos, A., Straub, D. W., … Calantone, R. J. (2014). Common beliefs and reality about partial least squares: Comments on Rönkkö & Evermann. Organizational Research Methods, 17(2), 182–209. 2013. doi:10.1177/1094428114526928
- Henseler, J., Ringle, C. M., & Sarstedt, M. (2015). A new criterion for assessing discriminant validity in variance-based structural equation modeling. Journal of the Academy of Marketing Science, 43(1), 115–135. doi:10.1007/s11747-014-0403-8
- Hsieh, J. Y., & Liao, P. W. (2011). Antecedents and moderators of online shopping behavior in undergraduate students. Social Behavior and Personality: an International Journal, 39(9), 1271–1280. doi:10.2224/sbp.2011.39.9.1271
- Hsu, M. H., Yen, C. H., Chiu, C. M., & Chang, C. M. (2006). A longitudinal investigation of continued online shopping behavior: An extension of the theory of planned behavior. International Journal of Human-Computer Studies, 64(9), 889–904. doi:10.1016/j.ijhcs.2006.04.004
- Jagtap, K. N. (2013). E-banking-An overview. Tactful Management Research Journal, 1(4), 1–4.
- Johnson, D. G. (2015). Technology with no human responsibility? Journal of Business Ethics, 127(4), 707–715. doi:10.1007/s10551-014-2180-1
- Kasule, M. Y. Increase of internet usage in Ghana and its implications. Business Ghana News, (2013).
- Keller, K. L. (1993). Conceptualizing, measuring, and managing customer-based brand equity. Journal of Marketing, 57(1), 1–22. doi:10.1177/002224299305700101
- Kim, E., & Hong, T. (2010). Segmentation customers in online stores from factors that affect the customer’s intention to purchase. In 2010 International Conference on Information Society (pp. 383–388). IEEE.
- Kim, H., & Song, J. (2010). The quality of word-of mouth in the online shopping mall. Journal of Research in Interactive Marketing, 4(4), 376–390. doi:10.1108/17505931011092844
- King, W. R., & He, J. (2006). A meta-analysis of the technology acceptance model. Information and Management, 43(6), 740–755. doi:10.1016/j.im.2006.05.003
- Krejcie, R. V., & Morgan, D. W. (1970). Educational and psychological measurement. Danville, IL: Interstate Printers and Publishers.
- Kumar, V., Anand, P., & Mutha, D. (2016, February 12). A study on trust in online shopping in Pune: A comparative study between male and female shoppers. Prerna and Mutha, Devendra.
- Kumar, V., & Dange, U. (2014). A study on perceived risk in online shopping of youth in Pune: A factor analysis. Available at SSRN: https://ssrn.com/abstract=2518293 or http://dx.doi.org/10.2139/ssrn.2518293
- Kwon, W., & Lennon, S. (2009). What induces online loyalty? Online versus offline brand images. Journal of Business Research, 62(1), 557–564. doi:10.1016/j.jbusres.2008.06.015
- Li, N., & Zhang, P. (2002). Consumer online shopping attitudes and behaviour: An assessment of research. In Proceedings of the Americas Conference on Information Systems (AMCIS’2002), (pp. 9–11).
- Li, R., Chung, T. L. D., & Fiore, A. M. (2017). Factors affecting current users’ attitude towards e-auctions in China: An extended TAM study. Journal of Retailing and Consumer Services, 34, 19–29. doi:10.1016/j.jretconser.2016.09.003
- Lian, J. W., & Yen, D. C. (2014). Online shopping drivers and barriers for older adults: Age and gender differences. Computers in Human Behavior, 37, 133–143. doi:10.1016/j.chb.2014.04.028
- Little Roderick, J. A., & Rubin Donald, B. (1987). Statistical analysis with missing data. Hoboken, NJ: Wiley.
- Liu, T. K., Chen, J. R., Huang, C. C., & Yang, C. H. (2013). E-commerce, R&D, and productivity: Firm-level evidence from Taiwan. Information Economics and Policy, 25(4), 272–283. doi:10.1016/j.infoecopol.2013.07.001
- Mandhlazi, L., Dhurup, M., & Mafini, C. (2013). Generation Y consumer shopping styles: Evidence from South Africa. Mediterranean Journal of Social Sciences, 4(14), 153.
- March, J. G. (1978). Bounded rationality, ambiguity, and the engineering of choice. Bell Journal of Economics, 9, 587–608. doi:10.2307/3003600
- McOmish, M. A., & Quester, P. (2005). Perceived risk and services cape: The importance of managing the physical evidence in services marketing. SERVSIG Research Conference 2005, Singapore, 2-4 June, 2005. Singapore: National University of Singapore and American Marketing Association.
- Mizanur, R. M., & Sloan, T. R. (2017). User adoption of mobile commerce in Bangladesh: Integrating perceived risk, perceived cost and personal awareness with TAM. International Technology Management Review, 6(3), 103–124. doi:10.2991/itmr.2017.6.3.4
- Muda, M., Mohd, R., & Hassan, S. (2016). Online purchase behavior of generation Y in Malaysia. Procedia Economics and Finance, 37, 292–298. doi:10.1016/S2212-5671(16)30127-7
- Ovčjak, B., Heričko, M., & Polančič, G. (2015). Factors impacting the acceptance of mobile data services–A systematic literature review. Computers in Human Behavior, 53, 24–47. doi:10.1016/j.chb.2015.06.013
- Park, C. H., & Kim, Y. G. (2003). Identifying key factors affecting consumer purchase behaviour in an online shopping context. International Journal of Retail & Distribution Management, 31(1), 16–29. doi:10.1108/09590550310457818
- Parment, A. (2013). Generation Y vs. Baby Boomers: Shopping behavior, buyer involvement and implications for retailing. Journal of Retailing and Consumer Services, 20, 2, 189–199. doi:10.1016/j.jretconser.2012.12.001
- Priyanka, G. P., & Ramya, K. (2016). Usage of online shopping among college students. Imperial Journal of Interdisciplinary Research, 2, 8.
- Rajan, E. P. T., Varadaraj, A., & Mathi, K. (2016). A study on the relationship among trust, satisfaction and repurchase intention towards E-shopping. International Journal of Management, IT and Engineering, 6(2), 27–36.
- Ringle, C. M., Wende, S., & Becker, J. M. (2015). SmartPLS 3. Boenningstedt: SmartPLS GmbH. Retrieved from http://www.smartpls.com
- Roth, P. L. (1994). Missing data: A conceptual review for applied psychologists. Personnel Psychology, 47(3), 537–560. doi:10.1111/peps.1994.47.issue-3
- Samadi, M., & Yaghoob-Nejadi, A. (2009). A survey of the effect of consumers’ perceived risk on purchase intention in e-shopping. Business Intelligence Journal, 2(2), 261–275.
- Sanakulov, N., & Karjaluoto, H. (2015). Consumer adoption of mobile technologies: A literature review. International Journal of Mobile Communications, 13, 244. doi:10.1504/IJMC.2015.069120
- Shuhaiber, A., & Mashal, I. (2019). Understanding users’ acceptance of smart homes. Technology in Society. doi:10.1016/j.techsoc.2019.01.003
- Siregar, J. J., Puspokusumo, R. A. W., & Rahayu, A. (2017). Analysis of affecting factors technology acceptance model in the application of knowledge management for small medium enterprises in industry creative. Procedia Computer Science, 116, 500–508. doi:10.1016/j.procs.2017.10.075
- Sox, C. B., Kline, S. F., & Crews, T. B. (2014). Identifying best practices. Opportunities and Barriers in Meeting Planning for Generation Y. International Journal of Hospitality Management, 36, 244–254.
- Stevens, J. (2018, Dec 17). Internet stats & facts for 2019. Retrieved from https://hostingfacts.com/internet-facts-stats/
- Venkatesh, V. (2000). Determinants of perceived ease of use: Integrating control, intrinsic motivation, and emotion into the technology acceptance model. Information Systems Research, 11(4), 342–365. doi:10.1287/isre.11.4.342.11872
- Venkatesh, V., & Bala, H. (2008). Technology acceptance model 3 and a research agenda on interventions. Decision Sciences, 39(2), 273–315. doi:10.1111/j.1540-5915.2008.00192.x
- Venkatesh, V., & Davis, F. D. (2000). A theoretical extension of the technology acceptance model: Four longitudinal field studies. Management Science, 46(2), 186–204. doi:10.1287/mnsc.46.2.186.11926
- Venkatesh, V., Morris, M. G., Davis, G. B., & Davis, F. D. (2003). User acceptance of information technology: A unified view. MIS Quarterly, 27(3), 425–478. doi:10.2307/30036540
- Vlek, C., & Stallen, P. J. (1980). Rational and personal aspects of risk. Acta Psychologica, 5, 273–300. doi:10.1016/0001-6918(80)90038-4
- Wang, Y. S., Lin, H. H., & Luarn, P. (2006). Predicting consumer intention to use mobile service. Information Systems Journal, 16(2), 157–179. doi:10.1111/j.1365-2575.2006.00213.x
- Weerasinghe, W. R. M., & Peramunugamage, A. (2014). Online shopping behaviour of young adults in higher education sector: How brand matters. In KDU International Research Symposium Proceedings (pp. 254–259). General Sir John Kotelawala Defence University. Retrieved from http://ir.kdu.ac.lk/handle/345/1622%09
- Wu, J. H., & Wang, S. C. (2005). What drives mobile commerce? An empirical evaluation of the revised technology acceptance model. Information & Management, 42(5), 719–729. doi:10.1016/j.im.2004.07.001
- Wu, L. Y., Chen, K. Y., Chen, P. Y., & Cheng, S. L. (2014). Perceived value, transaction cost, and repurchase intention in online shopping: A relational exchange perspective. Journal of Business Research, 67(1), 2768–2776. doi:10.1016/j.jbusres.2012.09.007
- Wu, P. C., Yeh, G. Y. Y., & Hsiao, C. R. (2011). The effect of store image and service quality on brand image and purchase intention for private label brands. Australasian Marketing Journal (AMJ), 19(1), 30–39. doi:10.1016/j.ausmj.2010.11.001
- Zaman, R., & Arslan, M. (2014). Effects of pre-announced product characteristics on customer’s purchase intention. European Journal of Business and Management. ISSN: 2222–1905.
Appendices
Figure A1. Internet Users in the World by Regions
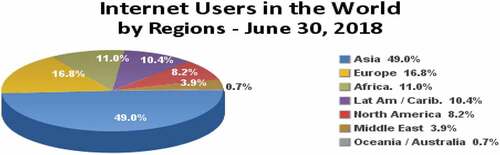
Figure A2. Ghana’s Digital Statistical Indicators
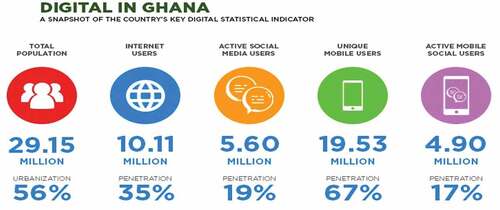
Figure A3. Conceptual Framework
Figure A4. Structural and Measurement Model
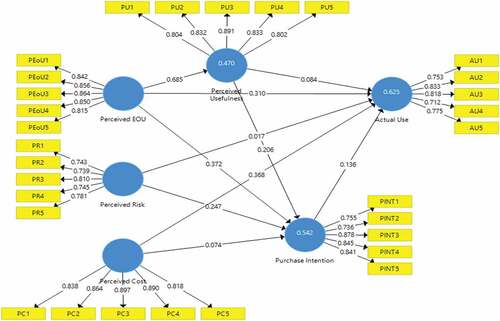
Table A1. Socio-demographic characteristics of respondents
Table A2. Reliability tests
Table A3. Cross loadings
Table A4. Fornell–Larcker test of discriminant validity
Table A5. Heterotrait–Monotrait ratio (HTMT)
Table A6. Collinearity statistic (VIF)
Table A7. Path coefficients
Table A8. Adjusted R-square
Table A9. F-square
Table A10. Construct cross-validated redundancy