
Abstract
Little attention has been paid to an issue of entrepreneurial retirement planning. The purpose of this research paper is to investigate the relationship between entrepreneurial financial attainment capacity and expected retirement income. More explicitly, the following research questions were proposed. 1) What factors determine entrepreneurial financial attainment capacity? 2) What influences anticipated net income after retirement? And 3) how entrepreneurial financial attainment capacity and anticipated net income after retirement are related? Both direct and online questionnaires were used to obtain data from 240 entrepreneurs from different geographical areas in Thailand. Structural Equation Modeling (SEM) was utilized to test the hypothesized relationships among various financial variables. The SEM analyses revealed that entrepreneurial financial attainment capacity positively influence targeted retirement income. Moreover, the results demonstrated that entrepreneurial financial attainment capacity was positively determined by an entrepreneur’s investment in financial asset, employment income, business net worth, business income and negatively determined by personal annual expenses and business expenses. On one hand, the research findings indicated that targeted retirement income was positively determined by expected earnings after retirement but negatively elucidated by expected spending after retirement. These results validated and expanded the previous research on entrepreneurial activities and financial planning.
PUBLIC INTEREST STATEMENT
Based on political and economic structure in Thailand, most entrepreneurs have been neglected from a number of public retirement saving schemes and inevitably forced to manage their own retirement funds. Essentially, entrepreneurs and public policy makers should be motivated to learn and comprehend how entrepreneurs could enhance their financial attainment capacity and generate sustainable retirement income. The novelty in this paper is the formation of a structural relationship that explains entrepreneurial manners regarding wealth creation and retirement saving.
1. Introduction
When an entrepreneur acquires their passion during their startup days, the effect can be enormous in terms of new business creation. The same goes for starting a new company which gives the same feeling of a riveting roller-coaster filled with tremendous highs and difficult lows. An entrepreneur can be defined as an individual who works as an employee, runs a small business and stands a better chance of a given business enterprise, as well as being responsible for the ideas, merchandise, or services offered. In other words, an entrepreneur is commonly seen as a business leader and innovator of new ideas and business processes (Alaili, Citation2015). Entrepreneurs play an important role in society. Their activities are critical determinants of the level of success, growth, opportunity and prosperity of an economy (Karoly & Zissimopoulos, Citation2004). The most dynamic societies in Thailand and around the world are the ones that have the most entrepreneurs and the supportive economic and legal structure that provoke entrepreneurs towards greater activities (Tracy, Citation2005). Entrepreneurship is becoming one of the most interesting occupations for many people, especially among Generation Y (those born between 1982 and 1993) and Z (those born between 1994 and 2010) who are using the social network as a new form of communication for suppliers and customers (Papulová & Papula, Citation2015). The improvement of technology, such as communication technology is the most significant reason for the increase in the number of those in self-employed businesses (Solomon, Citation2006). Being a business owner enables oneself to set one’s own schedules, create own rules and plan for further successes. Most individuals do not want to work for a company, but instead, wish to earn more than just a basic salary because if they are self-employed, they receive all the income with the responsibility of spending and budgeting for their own finances (Hamilton, Citation2000).
Since some entrepreneurs do not have pension funds, it becomes their own responsibility to determine what type of retirement plan best suits their particular requirements (Sappleton & Lourenco, Citation2015). An entrepreneur ought to be mindful regarding their future by saving. Apparently, entrepreneurs owning a business think that they do not need to worry about life after retirement (Detianne, Citation2008). Although entrepreneurs’ careers do not offer pensions like other careers do, making sure that the business will continue and endure long into the future is important (Forster-Holt, Citation2011). In western countries, there are possible retirement plans available for entrepreneurs, for instance, investing a portion of income in a mutual fund and investing in an Individual Pension Plan (IPP). It was found that more and more entrepreneurs are investing in Individual Pension Plans and Insured Retirement Plan (IRP) (Leroy, Manigart, & Manleman, Citation2008). IPP and IRP are retirement plans that give an entrepreneur a guaranteed stream of income throughout ages 60–85. Even at death, the loan is repaid from the tax-free proceeds of the Death Benefit; the residual amount is paid to the beneficiary.
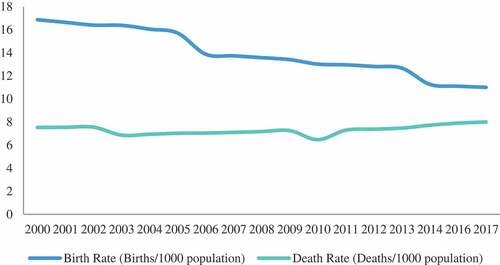
Thailand is now considered an aging society. In 2007, the information provided by the United Nations World Population on Aging shows that in Thailand, the number of elderly citizens was twice that of young children (InFRE, Citation2007). According to Trading Economics report (2007), Thailand was considered a low-fertility country since it exhibited an aging society and people were living longer than ever (InFRE, Citation2007). Figure confirms that from 2000 to 2017 the death rates as per 1,000 citizens have moved in a narrow gap with an unidentifiable trend whereas the birth rates as per 1,000 citizens have exhibited the precise downtrend and are expected to further decrease in the future. It was predicted that the aggregate household saving will reduce because the working-age population incurs financial obligations to support their old-age relatives (Prompakdee, Citation2016). Therefore, retirement income assurance is an essential key for financial wellbeing for workers after retirement (Ketkaew, Van Wouwe, & Vichitthamaros, Citation2019). Almost all individuals in Thailand need a retirement plan; not only office workers but also entrepreneurs. In addition, there is a myriad of kinds of savings such as, investment in stocks, long-term bank deposits or even properties. However, being self-employed, one must exert more effort than those working under companies (Solomon, Citation2006). It was found that Thais tend to begin their retirement plan at the age of 42. This is in contrast to other countries like those in Europe and the US where the average age for retirement planning outset is in the region of 30 years (Chansarn, Citation2013). Thailand, also, is a slow and late partaker of a retirement plan: that is to say that only 19% of Thailand’s population saves for retirement. Meanwhile, other countries like the Netherlands, U.S.A, Singapore, Malaysia and Hong Kong, display significant saving populations of almost twice that in Thailand.
Figure 1. Birth rate VS death rate trends as per 1,000 citizens.
As claimed by the Office of Small and Medium Enterprises, at the end of 2015 there were 2,773,625 enterprises in Thailand (Office of Small and Medium Enterprises of Thailand, Citation2015). Essentially, 2,765,986 were small and medium enterprises which represent 99.72% of the total number of enterprises. They were augmented by 1.07% when compared to SMEs in the past year. The ratio is the highest of all compared to the total of 99.26% of the whole country’ enterprises and 99.53% of the country’s total number of SMEs. Unavoidably, a very large number of Thai entrepreneurs are obligated to financially plan for their later lives.
Given the essence of establishing an understanding of how an entrepreneur in Thailand financially plans for his/her retirement income, this study poses the following research questions. First, what factors determine entrepreneurial financial attainment capacity? Second, what influences anticipated net income after retirement? And third, how entrepreneurial financial attainment capacity and anticipated net income after retirement are related? To answer the first and second research questions, we adapted a relevant concept of net income from profit/loss statement according to the accounting principles. The statistical model was formulated and tested using the Structural Equation Modeling (SEM) approach with a sample from several provinces in Thailand.
2. Review of literature
Retirement planning is also known as a motivation method to reform more successful retirement. Research has always shown that people plan for their retirement and express worries before they retire. When they have more experience in retirement planning, they enjoy being in retirement than those failing to plan (DeTienne & Wennberg, Citation2015; Figueira, Modos, Haddad, Gvozd, & Pissinati, Citation2017; Hinden, Citation2012; Osborne, Citation2012). A lot of research are related to understanding some factors, such as age, gender, education and income, which will encourage or interrupt financial planning for retirement. Results from these plenty of studies have provided thus: passion of being older (Fadila & Alam, Citation2016; Kim, Kwon, & Anderson, Citation2005); being male (Noone, Fiona, & Christine, Citation2010; Petkoska and Joanne Citation2009); being more educated (Joo & Grable, Citation2005; Ntalianis & Wise, Citation2011; Olsen & Whitman, Citation2007); and earning a higher income (Clark, d’Ambrosio, McDermed, & Sawant, Citation2006; Jean, Bailey, & Scott, Citation1994). Also, there are greater financial planning for persons who have strong demographic personality as they are assumed to engage in greater planning due to opportunity structures (Wang, Citation2013). It is likely that an older male with high education and considerable income would have sound retirement planning.
The demographics can be divided into three groups. First, education: higher education has been associated with better outcomes of retirement (Kim & Feldman, Citation2000). A prior study conducted in Malaysia (Murugiah, Citation2016) indicated that an overwhelming majority of respondents had basic financial knowledge and roughly half of them were highly educated at an advanced level. We should note that the results were contradictory to the arguments (Lusardi, Christelis, & Scheresberg, Citation2016) that many entrepreneurs in the US do not possess sound with financial knowledge regarding the stock market and compound interest, for instance. Second, sex: the study from Pinquart and Schindler (Citation2007) found the women were more likely to be part of the group of unsuccessful retirees (Pinquart & Schindler, Citation2007). Women have also been found to show a greater increase in depressive symptoms than men (Noone et al., Citation2010). Men and women seem to differ in respect of what matters in the retirement transition: former job-related factors and income were found to have a greater influence on men’s well-being than on that of their counterpart (Noone et al., Citation2010) and marital quality had a greater influence on women’s well-being. The effect of joint retirement was found to be less long-lasting for women than for men (Kim & Feldman, Citation2000), plausibly because most women were more likely forced to retire so as to take over the caregiver role. Results may change in the future due to women’s changing social roles. Third, age at retirement: People retiring at an older age are often found to experience better well-being outcomes in retirement (InFRE, Citation2007). Nevertheless, retiring after the usual retirement age does not necessarily offer any advantages (Hershey, Jacob-Lawson, & Neukam, Citation2003). Social norms about the appropriate age to retire might play a role (Zissimopoulos & Karoly, Citation2007).
Retirement satisfaction has been presented in the academic arena in various ways. A strong correlation was found between planned retirement age, income and saving regularly (Hsu & Leech, Citation2010). Likewise, Bender and Jivan (Citation2005) intensified the standpoint that having a guaranteed pension income has a statistically significant impact on retirement satisfaction (Bender & Jivan, Citation2005). Panis initially intended to measure the role of annuities and wealth with the 2000 HRS on retirement satisfaction. Even though the determinants are limited and the study does not control for other elements of the source of post-retirement income, there were two findings (Panis, Citation2004): annuities from pensions significantly increase satisfaction and most retirees reported higher levels of retirement satisfaction when they had guaranteed income streams, as measured by data from defined benefit pension plans (DB plans). Sundali, Westerman, and Stedham (Citation2008) highlighted the significance of annuitized income streams and how life satisfaction would be enhanced if annuitized income streams existed (Sundali et al., Citation2008). To probe into retiree behavior, an unequivocal income resource was postulated. A prior study (Talaga & Beehr, Citation1995) stated that retirement income satisfaction could be used as a controlled variable, based on the finding that perceptions of financial security have a positive relationship with retirement status. However, in another study (Matthews & Fisher, Citation2012), retirement income satisfaction was composed of three sources: employer-sponsored retirement accounts, social security, and personal investments and saving.
A lack of research about how business owners retire impacts practitioners and policymakers who direct retirement education to those who are on their radar screen:wage and salaried workers on a traditional retirement path. Practitioners, including business brokers and business valuation experts plus the popular press do the heavy lifting of disseminating information about entrepreneurial retirement (Leroy et al., Citation2008). Unfortunately, practitioners can do little but assist with the mechanics of retirement unless they are involved early in the process, when there may be a chance of a thoughtful consideration of retirement options.
2.1. Stages of retirement planning for entrepreneurs
Every entrepreneur needs to plan their retirement; the investment in a retirement fund is as important as their business operations. There are three stages of retirement planning depending on how long the entrepreneurs are self-employed (Moss, Citation2014).
2.1.1. Stage 1: early stage of self-employment
The early stage of self-employment is one of the popular, especially when an entrepreneur left their previous job in the workforce to start their own business or becoming self-employed. There is no right or wrong time to start a business.
2.1.2. Stage 2: mid-stage of self-employment
Although an entrepreneur was the owner of the business and have been self-employed for more than 10 to 15 years, they should at least have saved money for their retirement. There are many people who still do not have a money account for their retirement.
2.1.3. Stage 3: late stage of self-employment
The late stage of self-employment is the time we could not imagine and expect how our life would be like in the future. If an entrepreneur wants to sell his/her business or give a business to somebody in the family or lover, the choice may be overwhelming. Many people think that selling their business will gain profits enough for their retirement, but that will not always be the case. Before now, an entrepreneur could be in a position where he/she might possibly reduce his/her personal debt and could start calculating how much is needed to retire before it is too late to proceed.
3. Research model and hypotheses
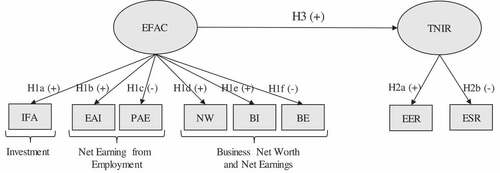
This section proposes a conceptual research model with a suitable set of hypotheses that are in line with how entrepreneurs plan for their retirement income (See Figure ). This model involves two main constructs which are 1) Entrepreneurial Financial Attainment Capacity (EFAC) and 2) Anticipated Net Income after Retirement (ANIR), given EFAC as an independent variable and ANIR as a dependent variable.
3.1. Entrepreneurial financial attainment capacity
To achieve a successful financial situation, one must coordinate various components through an organized plan. Financial resources can be obtained from investment, employment, or ownership of a business (Kapoor, Dlabay, & Hughes, Citation2012). In many circumstances, employees could be business owners at the same time. Therefore, it is useful and interesting to monitor employment and business income of an individual at the same time. As for investment, those interested in current income select investments that pay regular dividends or interest. In contrast, investors who desire long-term growth choose stocks, mutual funds, real estate and other investments with potentials for increased value in the future. Additionally, planned spending through budgeting is the key to achieving goals and future financial security. Financial difficulties could be created if people shop compulsively. Hence, spending less than earning is the only way to achieve long-term financial security (Kapoor et al., Citation2012). In doing business, the current financial position of a firm is identified by net worth. This is the value of business assets less the amount owed (Barrow, Citation2006). Additionally, an income statement can also help to explain financial wellbeing of a business. The income statement reveals what has happened during the accounting period with regards to the revenues (income) and expenditures (expenses) of the business (Adelman & Marks, Citation2014). The normal accounting period is 1 year. Accordingly, the following hypotheses were proposed.
3.1.1. Investment
H1a: Investment in Financial Assets (IFA) can positively describe Entrepreneurial Financial Attainment Capacity (EFAC).
3.2. Net earnings from employment
H1b: Employment Annual Income (EAI) can positively describe EFAC.
H1c: Personal Annual Expenses (PAE) can negatively describe EFAC.
3.3. Business net worth and net earnings
H1d: Net Worth (NW) can positively describe EFAC
H1e: Business Income (BI) can positively describe EFAC
H1f: Business Expenses (BE) can negatively describe EFAC
3.4. Targeted net income after retirement
A retiree’s financial well-being can be defined as the extent to which the person feels satisfied with his/her financial status and is able to maintain effective financial functioning, e.g. receiving stable income that will fully cover his/her expenses (Wang, Citation2013). An important individual attribute influencing financial well-being in retirement is how clear a person takes his/her financial goals after retirement into account. Not surprisingly, engagement in pre-retirement financial planning has been repeatedly documented to lead to a better financial well-being condition in retirement. This is especially because financial planning is associated with increased saving for retirement, improved budgeting and established long-term investment plan (Hershey et al., Citation2003). All in all, net income after retirement consists of the following items (Chieffe & Rakes, Citation1999): pension income, social security income, business income, health care expense, daily expense and debt payment. The hypotheses regarding targeted net income after retirement can be proposed as follows (Figure ).
H2a: Expected Earning after Retirement (EER) can positively describe Targeted Net Income after Retirement (TNIR).
H2b: Expected Spending after Retirement (ESR) can negatively describe TNIR.
H3: EFAC positively influences TNIR (the authors’ own hypothesis)
Figure 2. Conceptual framework and hypotheses.
4. Methods
4.1. Survey items and measurement
The survey items employed to measure the constructs were adapted from the existing literature. The final questionnaire in the context of entrepreneurial retirement planning was created based on a positive epistemology perspective to explore how individuals understand their own thinking process through measurable/quantifiable schemes (Johnson & Cassell, Citation2001). Each questionnaire item used a 7-point Likert-type scale that ranged from 1 (lowest) to 7 (highest). IFA, EAI, NW, BI and EER were coded using positive numbers but PAE, BE and ESR, which are expenses, were coded as negative numbers. The English questionnaire was created, then translated into Thai, and finally converted back to English to ensure no loss of meaning happened in the Thai version after translation (Douglas & Samuel Craig, Citation2007). The questionnaire contains the financial information presented in nominal scale format—see the annexure section at the end of this paper.
4.2. Sampling and data collection
The target population in this study includes any Thai entrepreneurs. Purposive sampling was employed as the sample selection process based on the researcher’s decision. Selecting a specific sample requires knowledge, expertise and research experiences in the subject (Trochim & Donnelly, Citation2007). The total of 680,269 active firms registered as juristic persons as of 2018 in Thailand were used as the population in this research (“Juristic Person Statistics as of 2018” Citationn.d.). Due to time and budget constraints, the decision was to collect primary data from 240 business owners around Thailand employing the purposive sampling approach. Purposive sampling is a non-probability sampling method occurring when a researcher knows and believes that they can obtain a representative sample. Therefore, all of these help to save money and time (Singh & Masuku, Citation2014). Additionally, based on the SEM analysis, a minimum sample size of 200 is suggested (Kline, Citation2005; Weston and Gore Jr Citation2006). With the assistance from Department of Business Development (DBD), we were able to collect the data from 134 business owners in urbanized cities such as Khon Kaen, Chiang Rai and Bangkok. Of the 134 respondents, 74 questionnaires were collected in a Khon Kaen business exhibition. Fourteen questionnaires were gathered from an exhibition in Chiang Rai and 46 questionnaires were from a Bangkok exhibition. Additionally, 106 questionnaires were from business owners who received our online requests. Prior to filling-in the questionnaires, respondents were informed of the confidentiality agreement and the purposes of this research.
Based on our survey, the results revealed that most business owners had graduated with a bachelor’s degree (77%). Furthermore, 65% of business owners already had a retirement plan in place, though 35% did not. Reasons given for this were, they were young (under 35 years of age) and some had only just opened their businesses. In terms of the percentage of money income saved, only 8% of respondents put aside 30–40% of their monthly income. Besides that, some gave the reason for requiring finances to invest in their business in order to promote further income. This would illustrate why some business owners chose not to hold their money in a bank because they believe that they were unable to obtain any profit from dealing with a bank.
4.3. Data analysis
The study’s data analysis was based on the Structural Equation Modeling (SEM) approach. SEM encompasses such diverse statistical techniques as path analysis, confirmatory factor analysis, causal modeling with latent variables, and even analysis of variance and multiple linear regression. The SEM approach was applied to examine the model’s estimation in two steps (Anderson & Gerbing, Citation1988), p. 1) to validate the outer (CFA) model in order to measure the relationship between each indicator and its variable, whether it is valid and reliable; 2) to examine the inner structural model in order to measure whether the full structure is reliable. The results of the analysis are discussed in detail as below.
5. Results and discussion
5.1. Step 1: assessment of measurement model
The analysis of the value of descriptive statistics of observed variables aims to examine a univariate normal distribution which is a primary requirement before the data analysis using SEM. This analysis will help researchers know the characteristic of normal distributions. The analyzed data were presented using descriptive statistics including mean, standard deviation, skewness and kurtosis in order to summarize the normal distributions of each variable (Cain, Zhang, & Yuan, Citation2017).
Table shows the analysis of the value of descriptive statistics of observed variables. We found that the mean of each observed variable was between −1.98 and 4.86. When the overall skewness and asymmetrical distribution were considered, the skewness values were between −0.72 and 0.61. This rage satisfied the rule of thumb for acceptable value of skewness—between −1.00 and 1.00 (Joanes & Gill, Citation1998). Moreover, the kurtosis values were between −1.50 and 0.38, which lied within its acceptable range—between −2.00 and 2.00 (George & Mallery, Citation2010). When the values of the skewness and kurtosis were considered together, these values were slightly different from zero, but close to zero. Therefore, it could be mentioned that the observed variables have normal distributions, thus suitable for further SEM analysis.
Table 1. The value of descriptive statistics for variables (n = 120)
Next, the researchers analyzed the correlation coefficient among observed variables by considering the Pearson’s product moment correlation (see Table ). The researchers then derived the correlation matrix among observed variables in order to identify multicollinearity problems. We employed two statistical values, including the Kaiser-Mayer-Olkin (KMO) measure of sampling adequacy and Bartlett’s test of sphericity to test whether the whole observed variables were an identity matrix or not (Taherdoost, Sahibuddin, & Jalaliyoon, Citation2014). From Table , the analysis of the Pearson product-moment correlation coefficient among observed variables found that the values of correlation coefficient among variables were positive and negative between −0.821 and 0.821 with the statistical significance at 0.01 level. For the overall observed variable pairs, majority of the correlation coefficient values were not greater than 0.80 which is the suggested threshold for multicolinearity check (Franke, Citation2010). However, there were only two pairs of observed variables with the values greater than 0.80, which were 1) BE and BI and 2) NW and IFA. Explicitly considering these two pairs of observed variables, BI (business annual income) was estimated from annual sales revenue and BE (business annual expenses) was estimated from cost of goods sold, interest expenses and tax paid, both of which were derived separately from business profit/loss statement. Moreover, NW (business net worth) is derived from business total assets less total liability and reported in the business balance sheet, whereas IFA (an individual’s investment in financial assets such as stocks, bonds and mutual funds) is recorded in his/her investment account. Nevertheless, some predictor variables that are highly correlated among themselves may not obstruct one’s ability to obtain goodness of fit nor predictions of new observations (Neter, Kutner, Nachtsheim, & Wasserman, Citation1996). Table also illustrated that the observed variable values were not so high for having a multicollinearity problem, and all the observed variables were joint compositions which were suitable for the analysis of the structural equation model.
Table 2. The Pearson product-moment correlation coefficient among observed variables
When Bartlett’s test of sphericity statistics was considered, it found that the Chi-square value was 829.606 (p = 0.000), so the correlation coefficient matrix was not an identity matrix with statistical significance at 0.01. The variables had enough relationship for analyzing the compositions which were consistent with the analytical result of Kaiser-Mayer-Olkin (KMO) for which the value was nearly 1 (0.792). This result showed that the data were suitable for the confirmatory factor analysis (CFA).
The researchers analyzed the CFA as the first step to test the structural equation modeling to ensure the internal consistency of the model. To do so, the following selected fit indices should pass the designated thresholds as follows (Hair, Black, Babin, Anderson, & Tatham, Citation1998): CFI > 0.90; GFI > 0.90; NFI > 0.90; IFI > 0.90. According to Table , the index CFI is 0.945 which is higher than 0.90. The index GFI is 0.913 which is higher than 0.90. Moreover, the index NFI is 0.938 which is higher than 0.90, and the IFI is 0.946 which is greater than 0.90. Additionally, Table shows that all the regression weights (betas) load significantly to the measurement model with the significance level of 0.01 (** from T score). In addition, an internal consistency check within each construct was presented by Convergent Validity using the attributes of Average Variance Extracted (AVE) and Composite Reliability (CR). To assess Convergent Validity, AVE and CR were tested against the designated thresholds of greater than 0.50 (Fornell & Larcker, Citation1981) and greater than 0.70 (Bacon, Sauer, & Young, Citation1995) respectively. Table demonstrates that, for construct EFAC and TNIR, all the calculated AVEs and CRs were well above the designated threshold values, suggesting appropriate reliability and convergent validity. Consequently, it can be summarized that the measurement model is proper for the structural model.
Table 3. The confirmatory factor analysis of the measurement model
5.2. Step 2: assessment of structural model and hypothesis testing
At this stage, the relationship between construct EFAC and TNIR and the relationship among indicators based on the proposed hypotheses were tasted using structural model. The results revealed that the structural model attained an adequate model fit. When assessing the structural model’s goodness of fit, all the fit indices passed the thresholds CFI > 0.90; GFI > 0.90; NFI > 0.90; IFI > 0.90 consisting of p-value = 0.000, CFI = 0.945, GFI = 0.913, NFI = 0.938 and IFI = 0.946. Therefore, it could be concluded that the structural equation model (SEM) was appropriate and fit with the empirical data.
However, when considering Modification Indices from the analysis output, it was suggested that PAE should covariate with ESR. Then, we decided that a two-headed arrow was used to connect these two observed variables together resulting in improved goodness of fit indices involving p-value = 0.000, CFI = 0.974, GFI = 0.948, NFI = 0.967 and IFI = 0.975 (see Figure ). The newly adjusted structural equation model explaining entrepreneurial financial planning behavior is revealed in Figure .
Figure 3. Adjusted structural model and hypothesis test results.
According to Figure and Table , the hypothesis tests of the structural model were all supported. Hence, it can be concluded that entrepreneurial financial attainment capacity (EFAC) positively influences targeted net income after retirement (TNIR) which supported H3 (the authors’ own hypothesis). We believe that present economic behavior could psychologically influence an individual’s expected economic outcomes which may occur in the future. This relationship was demonstrated by a positive regression weight of 0.678 (significant at 0.01). As for the constructs, entrepreneurial financial attainment capacity could be determined by and positively correlated with an individual’s investment in financial assets (IFA), an individual’s employment annual income (EIA), business net worth (NW) (Barrow, Citation2006), and business annual income (BI), but negatively correlated with personal annual expenses (PAE) and business annual expenses (BE). All the hypotheses in EFAC construct were supported at 0.01 significance level. These results were in line with the priori financial literature and theories established by Kapoor et al. (Citation2012), Barrow (Citation2006) and Adelman and Marks (Citation2014). Among other positively correlated indicators, business income (BI) played the most crucial role in determining entrepreneurial financial attainment capacity with the highest regression weight of 0.88. Precisely, an entrepreneur primarily earns from his/her business income. Hence, the higher business income, the better capacity an entrepreneur may enhance their financial attainment, and therefore the better ability he/she could set goals for retirement income. On the other hand, the test results revealed that both personal expenses (PAE) and business expenses (BE) played discouraging roles in negatively impacting entrepreneurial financial attainment capacity. Hence, trying to control and manage personal and business expenses would allow an entrepreneur to maximize his/her financial attainment capacity.
Table 4. Hypothesis test results of the adjusted structural model
The hypothesis test results also confirmed that targeted net income after retirement (TNIR) was determined by expected earnings after retirement (EER) and expected spending after retirement (ESR). EER was positively correlated with TNIR at 0.01 significance level and ESR was negatively correlated with TNIR at 0.01 significance level. The results were consistent with a research article by Chieffe and Rakes (Citation1999). An entrepreneur’s targeted net income is a summation of expected pension income, social security income, business income and less anticipated health care expense, daily expense and debt payment after retirement. Expected earnings after retirement plays a very powerful role in dictating an entrepreneur’s targeted net income after retirement indicated by the regression weight of 0.929. Partly, expected earnings after retirement is influenced by entrepreneurial financial attainment capacity which is a result of an individual’s investment, employment income and business income as well as net worth. However, business income is still considered the most influential variable that determines an entrepreneur’s financial attainment capacity. In addition, we found a strong error covariance between PAE and ESR. This implies that an individual’s current spending pattern relates to his/her expected spending pattern in the future. More explicitly, if an individual spends low amount of money at present, psychologically he/she will have a tendency to spend low amount after retirement. This is also true for the opposite case when an individual spends a lot today.
6. Conclusion and recommendations
This article proposed a model to explain the relationship between entrepreneurial financial attainment capacity and targeted net earnings after retirement. The research results suggested that entrepreneurial financial attainment capacity positively influence targeted retirement income. It was found that entrepreneurial financial attainment capacity was positively determined by an entrepreneur’s investment in financial asset, employment income, business net worth, business income and negatively determined by personal annual expenses and business expenses. Moreover, this paper also found that targeted retirement income was determined by expected earnings after retirement less expected spending after retirement. Notably, business income plays the most crucial role in determining entrepreneurial financial attainment capacity which in turn has a significant impact on expected retirement income of an entrepreneur. The researching findings attentively suggested practical implications as follows.
Although an entrepreneur may perceive the retirement process as a period of uncertainty and crisis for them, understanding entrepreneurial financial attainment capacity and how it relates to targeted retirement income can be useful in many ways. Other than attaining business income, having knowledge of financial planning can change an entrepreneur’s spending behavior, due to impulse buying, which is a major cause of the financial disasters. Saving and investment are crucial factors creating an effective financial plan and risk reduction. Additionally, it was suggested that individuals should prepare enough money as their emergency fund when facing with health problems especially after retirement. Being aware of financial management does not only benefit individuals in term of managing contingency but also help them achieve their long-term retirement goals. If one wants to become wealthy after the later life, they should make a good plan. If they do not plan well, this modeling shall not be in effect.
7. Limitations and future research
One limitation of the present study is the fact that only a few variables are included in the model. The results from this study must be considered with caution. First, the study comprised of a small number of entrepreneurs in Thailand based on the purposive sampling approach. Any generalization of the result should take entrepreneurs’ characteristics and their context into consideration. Some of the entrepreneurs are not from the same area (other geographical regions) and may have the different financial knowledge, attitude toward retirement and saving behaviors which may affect the results in the questionnaire and data analysis. Additionally, participants in the current study could be described as in Thailand’s context only. It could be possible that they need to be investigated in broader and bigger sample group. However, this issue remains to be investigated in the future.
The findings from the present study suggest potential ideas for future study which can benefit future direction for the investigator to develop more holistic models related to retirement planning behavior of entrepreneurs. It may need a multidisciplinary approach to integrate the work of psychologists, economists, demographers, sociologists and financial service professionals.
Acknowledgements
This work was financially supported by Khon Kaen University in collaboration with the National Research Council of Thailand.
Declarations of interest: none
Additional information
Funding
Notes on contributors
Chavis Ketkaew
Chavis Ketkaew is a Ph.D. student in Applied Economics, the Faculty of Business and Economics, University of Antwerp, Belgium. As a full-time lecturer of the International College, Khon Kaen University, Thailand, he also holds the position of Assistant Professor of management. His research interests include behavioral finance and consumer behavior.
Martine Van Wouwe
Martine Van Wouwe is the Emeritus Professor, Faculty of Business and Economics, University of Antwerp, Antwerp, Belgium.
Preecha Vichitthammaros
Preecha Vichitthamaros is the Assistant Professor at the Faculty of Applied Statistics, National Institute of Development Administration, Bangkok, Thailand
Related Research Data
References
- Adelman, P. J., & Marks, A. M. (2014). Entrepreneurial finance. Pearson College Division.
- Alaili, A. (2015, March 4). What is an entrepreneur ? [Entrepreneur Post]. Retrieved from http://www.entrepreneurpost.com/2015/03/04/what-is-an-entrepreneur/.
- Anderson, J. C., & Gerbing, D. W. (1988). Structural equation modeling in practice: A review and recommended two-step approach. Psychological Bulletin, 103(3), 411. doi:10.1037/0033-2909.103.3.411
- Bacon, D. R., Sauer, P. L., & Young, M. (1995). Composite reliability in structural equations modeling. Educational and Psychological Measurement, 55(3), 394–15. doi:10.1177/0013164495055003003
- Barrow, C. (2006). Financial management for the small business. London, UK: Kogan Page.
- Bender, K. A., & Jivan, N. A. (2005). What makes retirees happy? (Vol. 28). Massachusetts, USA: Center for Retirement Research at Boston College.
- Cain, M. K., Zhang, Z., & Yuan, K.-H. (2017). Univariate and multivariate skewness and kurtosis for measuring nonnormality: Prevalence, influence and estimation. Behavior Research Methods, 49(5), 1716–1735. doi:10.3758/s13428-016-0814-1
- Chansarn, S. (2013). Economic preparation for retirement of population aged 50–59 years old in Thailand. Procedia-Social and Behavioral Sciences, 91, 640–647. doi:10.1016/j.sbspro.2013.08.464
- Chieffe, N., & Rakes, G. K. (1999). An integrated model for financial planning. Financial Services Review, 8(4), 261–268. doi:10.1016/S1057-0810(00)00044-5
- Clark, R. L., d’Ambrosio, M. B., McDermed, A. A., & Sawant, K. (2006). Retirement plans and saving decisions: The role of information and education. Journal of Pension Economics and Finance, 5(1), 45–67. doi:10.1017/S1474747205002271
- Detianne, D. R. (2008). Entrepreneurial exit as an critical component of revising the definition of old age to reflect future changes in life table probabilities. Canadian Journal of Aging, 21(3), 349–356.
- DeTienne, D. R., & Wennberg, K. (2015). Research handbook of entrepreneurial exit. Cheltenham, UK: Edward Elgar Publishing. http://www.elgaronline.com/view/9781782546962.xml
- Douglas, S. P., & Samuel Craig, C. (2007). Collaborative and iterative translation: An alternative approach to back translation. Journal of International Marketing, 15(1), 30–43. doi:10.1509/jimk.15.1.030
- Fadila, D. E. S., & Alam, R. R. (2016). Factors affecting adjustment to retirement among retirees’ elderly persons. Journal of Education and Practice, 6(8), 112.
- Figueira, D., Modos, A., Haddad, M. D. C. L., Gvozd, R., & Pissinati, P. D. S. C. (2017). Retirement decision-making influenced by family and work relationships. Revista Brasileira De Geriatria E Gerontologia, 20(2), 206–213. doi:10.1590/1981-22562017020.160127
- Fornell, C., & Larcker, D. F. (1981). Evaluating structural equation models with unobservable variables and measurement error. Journal of Marketing Research, 18, 39–50. doi:10.1177/002224378101800104
- Forster-Holt, N. (2011). Entrepreneur as “end” repreneur: The intention to retire. Maine, USA: The University of Maine.
- Franke, G. R. (2010). Multicollinearity. In Wiley international encyclopedia of marketing. New Jersey, USA: John Wiley and Sons, Ltd.
- George, D., & Mallery, P. (2010). SPSS for windows step by step. A simple study guide and reference (10. Baski). Boston, MA: Pearson Education, Inc.
- Hair, J. F., Black, W. C., Babin, B. J., Anderson, R. E., & Tatham, R. L. (1998). Multivariate data analysis (Vol. 5. 3). Upper Saddle River, NJ: Prentice hall.
- Hamilton, B. H. (2000). Does entrepreneurship pay? An empirical analysis of the returns to self-employment. Journal of Political Economy, 108(3), 604–631. doi:10.1086/262131
- Hershey, D. A., Jacob-Lawson, & Neukam, K. N. (2003). An experimental comparison of retirement planning intervention seminars. Education Gerontology, 29, 339–359. doi:10.1080/713844333
- Hinden, S. (2012). How to retire happy [[S.I.]: McGraw-Hill Education]. Retrieved from http://api.overdrive.com/v1/collections/v1L1BAgIAAA2H/products/212c0ab8-f3b9-4224-b2d5-adf04beae0bd.
- Hsu, C., & Leech, I. E. (2010). Retirement income satisfaction of american retired workers. Retrieved from http://Www. Fermascholar. Org/Wpcontent/Uploads/2013/09/P6_retirement-Income-Satisfaction_Hsu.Pdf.
- InFRE. (2007). InFRE General population report on retirement readiness survey, conducted with Greenwald, M. and Associates, viewed 14 March 2012. Retrieved from www.infre.org/Forms/InFREGenPopReport4-16FINALGREENWald.pdf.
- Jean, T. M., Bailey, W. C., & Scott, J. P. (1994). Factors influencing attitude toward retirement and retirement planning among midlife university employees. Journal of Applied Gerontology, 13(2), 143–156. doi:10.1177/073346489401300203
- Joanes, D. N., & Gill, C. A. (1998). Comparing measures of sample Skewness and Kurtosis. Journal of the Royal Statistical Society: Series D (the Statistician), 47(1), 183–189.
- Johnson, P., & Cassell, C. (2001). Epistemology and work psychology: New agendas. Journal of Occupational and Organizational Psychology, 74(2), 125–143. doi:10.1348/096317901167280
- Joo, S.-H., & Grable, J. E. (2005). Employee education and the likelihood of having a retirement savings program. Journal of Financial Counseling and Planning, 16, 37–49.
- Juristic Person Statistics as of 2018. (n.d.) Department of business development. Retrieved from https://www.dbd.go.th/dbdweb56/news_view.php?nid=469407271
- Kapoor, J., Dlabay, L., & Hughes, R. J. (2012). Focus on personal finance. New York, NY: McGraw-Hill Higher Education.
- Karoly, L. A., & Zissimopoulos, J. (2004). Self-employment among older U.S. Workers. Monthly Labor Review, 127, 24–47.
- Ketkaew, C., Van Wouwe, M., & Vichitthamaros, P. (2019). Perceptions of working versus becoming a societal burden after retirement: demographic analyses of industrial workers in Thailand. Organizational Cultures: An International Journal, 19(1), 23–42. doi:10.18848/2327-8013/CGP/v19i01/23-42
- Kim, J., Kwon, J., & Anderson, E. A. (2005). Factors related to retirement confidence: Retirement preparation and workplace financial education. Financial Counseling and Planning, 16(2), 77–89.
- Kim, S., & Feldman, D. C. (2000). Working in retirement: The antencedents of bridge employment and its consequences for quality of life in retirement. Academy of Management Journal, 43, 1195–1210.
- Kline, R. B. (2005). Methodology in the social sciences. Principles and practice of structural equation modeling (2nd ed.). New York: Guilford Press.
- Leroy, H., Manigart, S., & Manleman, M., 2008, “The planned decision to transfer and entrepreneurial company”, Paper presented at the 2008 Academy of Management Conference,, USA.
- Lusardi, A., Christelis, D., & Scheresberg, C., “Entrepreneurship among baby boomers: Recent evidence from the health and retirement study”, GFIEG working paper series; WP2016-4, September 2016.
- Matthews, R. A., & Fisher, G. G. (2012). Family, work, and the retirement process: A review and new. In M. Wang (Ed.)The oxford handbook of retirement (pp. 354). New York, NY: Oxford University Press.
- Moss, W. (2014). You can retire sooner than you think: The 5 money secrets of the happiest retirees. New York: McGraw-Hill Education.
- Murugiah, L. (2016). The level of understanding and strategies to enhance financial literacy among Malaysian. International Journal of Economics and Financial Issues, 6(3S), 130–139.
- Neter, J., Kutner, M. H., Nachtsheim, C. J., & Wasserman, W. (1996). Applied linear statistical models (Vol. 4). New York, NY: McGraw-Hill..
- Noone, J., Fiona, A., & Christine, S. (2010). Do men and women differ in their retirement planning? Testing a theoretical model of gendered pathways to retirement preparation. Research on Aging, 32(6), 715–738. doi:10.1177/0164027510383531
- Ntalianis, M., & Wise, V. (2011). The role of financial education in retirement planning. Australasian Accounting, Business and Finance Journal, 5(2), 23–37.
- Office of Small and Medium Enterprises of Thailand, 2015, “SMEs White Papers 2015”, Chapter 4,.
- Olsen, A., & Whitman, K. (2007). Effective retirement savings programs: Design features and financial education. Social Security Bull, 67, 53.
- Osborne, J. W. (2012). Psychological effects of the transition to retirement. Canadian Journal of Counselling and Psychotherapy, 46(1), 45–58.
- Panis, C. W. A. (2004). Annuities and retirement well-being. In Pension design and structure: new lessons from behavioral finance (pp. 259–274). New York, NY: Oxford University Press.
- Papulová, Z., & Papula, J. (2015). Entrepreneurship in the eyes of the young generation. Procedia Economics and Finance, 34, 514–520. doi:10.1016/S2212-5671(15)01662-7
- Petkoska, J., & Earl, J. K. (2009). Understanding the influence of demographic and psychological variables on retirement planning. Psychology and Aging, 24(1), 245. doi:10.1037/a0014096
- Pinquart, M., & Schindler, I. (2007). Changes of life satisfaction in the transition to retirement: A latent-class approach. Psychology and Aging, 22(3), 442. doi:10.1037/0882-7974.22.3.442
- Prompakdee, C. (2016). Aging society in Thailand. Retrieved from http://library.senate.go.th/document/Ext6078/6078440_0002.PDF
- Sappleton, N., & Lourenco, F. (2015). Entrepreneurship, self-employment and retirement. Retrieved from http://public.eblib.com/choice/publicfullrecord.aspx?p=4330815
- Singh, A. S., & Masuku, M. B. (2014). Sampling techniques & determination of sample size in applied statistics research: An overview. International Journal of Economics, Commerce and Management, 2(11), 1–22.
- Solomon, G. 2006, “Are we teaching small business management to entrepreneurs and entrepreneurship to small business managers?”, USASBE White Paper. Accessed from http://usasbe.org/knowledge/whitepaper
- Sundali, J., Westerman, J. W., & Stedham, Y. (2008). The importance of stable income sources in retirement: An exploratory study. Journal of Behavioral and Applied Management, 10(1), 18.
- Taherdoost, H. A. M. E. D., Sahibuddin, S. H. A. M. S. U. L., & Jalaliyoon, N. E. D. A. (2014). Exploratory factor analysis; concepts and theory. In Advances in applied and pure mathematics (pp. 375382). The 2nd International Conference on Mathematical, Computational and Statistical Science, Gdansk, Poland.
- Talaga, J. A., & Beehr, T. A. (1995). Are there gender differences in predicting retirement decisions? Journal of Applied Psychology, 80(1), 16. doi:10.1037/0021-9010.80.1.16
- Thailand - Population - Historical Data Graphs per Year. (n.d.). Retrieved from https://www.indexmundi.com/g/g.aspx?v=21&c=th&l=en
- Tracy, B. (2005, June 20). The role of the entrepreneur [Entrepreneur]. Retrieved from https://www.entrepreneur.com/article/78478.
- Trochim, W. M. K., & Donnelly, J. P. (2007). Research methods knowledge base. Mason, Ohio: Thomson Custom Pub.
- Wang, M. (2013). The Oxford handbook of retirement. Oxford: Oxford University Press.
- Weston, R., & Gore, P. A., Jr. (2006). A brief guide to structural equation modeling. The Counseling Psychologist, 34(5), 719–751. doi:10.1177/0011000006286345
- Zissimopoulos, J. M., & Karoly, L. A. (2007). Transitions to self-employment at older ages: The role of wealth, health, health insurance and other factors. Labor Economics, 14, 69–295. doi:10.1016/j.labeco.2005.08.002.
Annexure
Questionnaire
General Information
Sex: 1) Male, 2) Female
Age: 1) 20 years or below, 2) 21–25, 3) 26–30, 4) 31–40, 5) 41–50, 6) 51–60, 7) Above 60
Education Level:1) High School or lower, 2) Bachelor degree, 3) Master’s degree, 4) Doctoral degree
Do you have a retirement plan? 1) Yes, 2) No
How much do you save per month? 1) 0-5% of monthly income, 2) 6–10, 3) 10–20, 4) 20–30, 5) 30–40, 6) 40–50, 7) More than 50%
Entrepreneurial Financial Attainment Capacity (EFAC) Construct
IFA: How much is your approximate investment in financial assets? (For instance, stocks, bonds, mutual funds gold, land and properties, saving insurance, long-term savings)
1) 0–50,000 baht, 2) 50,001–200,000, 3) 200,001–500,000, 4) 500,001–1,000,000, 5) 1,000,001–2,000,000, 6) 2,000,001–5,000,000, 7) More than 5,000,000
EIA: How much is your employment annual income?
1) 0–100,000 baht, 2) 100,001–200,000, 3) 200,001–600,000, 4) 600,001–1,000,000, 5) 1,000,001–1,500,000, 6) 1,500,000–2,000,000, 7) More than 2,000,000
PAE: How much is your personal annual expenses? (For instance, daily expenses including food, clothes, rents, transportation; debt payment including mortgage and auto-leasing)
1) 0–100,000 baht, 2) 100,001–200,000, 3) 200,001–600,000, 4) 600,001–1,000,000, 5) 1,000,001–1,500,000, 6) 1,500,000–2,000,000, 7) More than 2,000,000
NW: How much is your business net worth? (Total assets less total liability)
1) 0–500,000 baht, 2) 500,001–1,000,000, 3) 1,000,001–2,000,000, 4) 2,000,001–5,000,000, 5) 5,000,001–10,000,000, 6) 10,000,001–20,000,000, 7) More than 20,000,000
BI: How much is your annual business income? (Sale revenue)
1) 0–500,000 baht, 2) 500,001–1,000,000, 3) 1,000,001–2,000,000, 4) 2,000,001–5,000,000, 5) 5,000,001–10,000,000, 6) 10,000,001–20,000,000, 7) More than 20,000,000
BE: How much is your business annual expenses?
1) 0–500,000 baht, 2) 500,001–1,000,000, 3) 1,000,001–2,000,000, 4) 2,000,001–5,000,000, 5) 5,000,001–10,000,000, 6) 10,000,001–20,000,000, 7) More than 20,000,000
Targeted Net Income after Retirement (TNIR) Construct
EER: How much is your annual expected earnings after retirement?
1) 0–500,000 baht, 2) 500,001–1,000,000, 3) 1,000,001–2,000,000, 4) 2,000,001–5,000,000, 5) 5,000,001–10,000,000, 6) 10,000,001–20,000,000, 7) More than 20,000,000
ESR: How much is your annual expected spending after retirement?
1) 0–500,000 baht, 2) 500,001–1,000,000, 3) 1,000,001–2,000,000, 4) 2,000,001–5,000,000, 5) 5,000,001–10,000,000, 6) 10,000,001–20,000,000, 7) More than 20,000,000