
Abstract
Modelling investor behaviour in the South African context is important for investment companies to profile their clients. Various factors can influence the risk tolerance of investors. For the purpose of this research article, the emphasis was placed on demographics, life satisfaction and how risk-taking behaviour and perception in several life domains influences risk tolerance. An electronic questionnaire was distributed to over 4 000 investors throughout South Africa. The final sample size was 1 065. Age and gender were found to significantly influence investor risk tolerance. A negative relationship was found between age and risk tolerance, indicative that risk tolerance decreases with age. Life satisfaction did also significantly contribute to predicting investor risk tolerance. The development of this risk tolerance structural equation model is unique in its existence, as it is the first model to incorporate demographics, life satisfaction, risk-taking behaviour and perception, and risk tolerance level in the South African context. As a result, these findings will make a significant contribution to the way financial investment companies profile their clients.
PUBLIC INTEREST STATEMENT
The modelling of investor behaviour is important for investment companies in order to profile their clients. For the purpose of this research article, the emphasis was placed on demographics, life satisfaction and how risk-taking behaviour and perception in several life domains influences risk tolerance. Age and gender were found to significantly influence investor risk tolerance. A negative relationship was found between age and risk tolerance, indicative that risk tolerance decreases with age. Life satisfaction did also significantly contribute to predicting investor risk tolerance. The development of this risk tolerance structural equation model is unique in its existence, as it is the first model to incorporate demographics, life satisfaction, risk-taking behaviour and perception, and risk tolerance level in the South African context.
1. Introduction
In constant changing economic conditions, investors are constantly faced with complex investment and financial decisions (Filbeck et al., Citation2005). The complexity of investment decisions can be attributed to investors’ inability to grasp the concept of risk. In its simplest form, risk is known as uncertainty (Head, Citation1967). In literature, a disagreement on the definition of risk exists, as researchers argue about the measurement thereof and what exactly this concept entails (Blume, Citation1971). According to Grable (Citation2008), risk involves certain actions individuals dare to take. Moreover, these actions taken are dependent on the availability of freedom individuals possess to make such decisions. The amount of risk an individual is willing to tolerate defines the understanding of risk for an individual. Personal financial decisions are influenced by the risk tolerance factor (Snelbecker et al., Citation1990). Grable (Citation2016) contend that risk tolerance is the amount of uncertainty an investor is willing to bear in terms of their investment decisions. Moreover, Hanna and Lindamood (Citation2007) assert that financial risk tolerance is a principal determinant of choice behaviour throughout investments. Investors are typically categorised according to their level of financial risk they are willing to tolerate. These levels of risk can be categorised as either risk-seeking or risk-averse (Paulsen et al., Citation2012). Risk seeking behaviour refers to investors who prefer riskier investment options with great returns, rather than safe investment options with a lower return (Paulsen et al., Citation2012). Whereas, risk-averse investors are investors who rather steer away from taking risks in general (Paulsen et al., Citation2012).
Various factors influence financial risk tolerance for investors, these can typically include risk-taking behaviour and perception, life satisfaction, as well as demographic factors. Investor risk-taking behaviour can be measured by classifying the domain-specific risk-taking and perception into five main domains namely (i) ethical, (ii) financial, (iii) health/safety, (iv) recreational, and (v) social (Blais & Weber, Citation2006). Another factor influencing financial risk tolerance is the investor’s life satisfaction. Investor life satisfaction refers to an individual’s global assessment of his or her own life (Diener et al., Citation1985). Saris et al. (Citation1996) were of the opinion that the investor’s life satisfaction refers to an overall assessment of their quality of life. Furthermore, demographic factors refer to the investor’s characteristics in terms of their age, gender, marital status, annual income and the highest level of education (Kolb, Citation2008). For the purpose of this research article, the emphasis was placed on demographics, life satisfaction and how risk-taking behaviour and perception in several life domains influences risk tolerance.
The primary objective of this research article was to construct an investor behaviour profiling model by establishing a relationship between the level of risk tolerance through the survey of consumer finances (SCF); satisfaction with life scale (SWL); domain-specific risk-taking scale (DOSPERT). The central problem statement of the study is formulated against the framework of the preceding introduction and rationale. Conventional research treats investors as rational due to their measurement instrument that mainly incorporates risk tolerance and but exclude other relevant endogenous factors such as demographic variables and life satisfaction. Generalised risk-taking questions in conventional risk profiles also do not distinguish between domain-specific risk-taking, and do not consider that an investor might have different risk tolerance levels across their life domains (being social, health, financial, investment and recreational). The measurements used by South African investment companies are compiled based on the institutional intellect in terms of rational investor behaviour (Di Dottorato, Citation2013). As a result, investment companies make no provision for testing irrational behaviour by profiling various other endogenous factors. Moreover, investors are irrational complex beings as per behavioural finance evidence and this component should be included in the measurements to get an accurate profile for the potential investor. This will make a significant contribution to the existing body of knowledge as limited studies have included other endogenous factors as possible influencers on financial risk tolerance.
2. Literature review
An individual’s risk tolerance can be influenced by various factors which typically include the factors based on the current situation of the individual and factors based on the individual’s risk-taking behaviour and perception (Cooper, Citation2003). According to Cooper (Citation2003), the decisions that an individual make under certain circumstances can be determined by an individual’s risk-taking behaviour and perception characteristics. Moreover, risk-taking behaviour and perception also refer to an individual’s inclination to consistently make different decisions under contradictory circumstances (Cooper, Citation2003). The type of risk-taking behaviour and perception an investor holds can have an influence on the level of risk an investor is willing to tolerate. It is vital to investigate the effects that risk-taking behaviour and perception have on investors’ decision-making processes and financial behaviour (Weller & Tikir, Citation2010); as this may explain why investors have different levels of risk tolerance.
Risk tolerance can be defined as an individual’s willingness to take on risks when making financial decisions involving saving and investing (Grable, Citation2008, Citation2017). Investors face important financial choices regarding asset allocation, fund accumulation strategies, and investments; and these choices all involve a certain level of risk tolerance (Dickason, Citation2017). As such, it is important to investigate demographic factors such as age, income, gender, and education that have an influence on investors’ risk tolerance levels (Diener et al., Citation1991).
Age as a factor in investor risk tolerance has been widely examined due to its relation to an investor’s risk-taking behaviour and perception and overall risk tolerance level (Dickason, Citation2017). Some of the first researchers to analyse the relationship between age and risk tolerance were Wallach and Kogan (Citation1961). These researchers found younger individuals to be more risk-tolerant than older individuals. J. Grable and Joo (Citation2000), as well as Van de Venter et al. (Citation2012), found that older investors tend to be reluctant and more cautious to take financial risks in their decision making. On the other hand, younger investors tend to have risk aggressive personalities and are highly risk-tolerant. It can be assumed that these young investors are comfortable with aggressive investments since they have more years to recover from financial losses resulting from their risky financial behaviour (Grable et al., Citation2009). Several internationally published research papers concluded that the relationship between age and risk tolerance is negative which indicates that risk tolerance decreases as individuals’ age (Bajtelsmit & VanDerhei, Citation1997; Brooks et al., Citation2018; Brown, Citation1990; Coleman, Citation2003; Dickason & Ferreira, Citation2018; Grable, Citation1997; Halek & Eisenhauer, Citation2001; Hallahan et al., Citation2003; Irwin, Citation1993; Larkin et al., Citation2013; Mabalane, Citation2015; McInish, Citation1982; Morin & Suarez, Citation1983; Palsson, Citation1996; Santacruz, Citation2009; Van den Bergh, Citation2018; Van Schalkwyk, Citation2012; Wallach & Kogan, Citation1961; Yao et al., Citation2004, Citation2011).
Gender is also considered an important factor which may influence investor risk tolerance, life satisfaction, and risk-taking behaviour and perception (Dickason, Citation2017). Compared to female investors, it was found that male investors tend to have an increased level of life satisfaction and overall aggressive behaviour of investment behaviour and risk tolerance (Shirazi & Khan, Citation2013). In a study conducted by Slovic (Citation1966), confirmed that it is a general belief that males undertake more risk than females. As a result, males are regarded as more risk-tolerant than females when making an investment decision (Grable & Lytton, Citation1999; Grable et al., Citation2009). Roszkwoski et al. (Citation1993) argue that males tend to be risk-tolerant due to having risk-taking behaviour and perception characteristic that classifies males as adventurous and sensation-seekers. On the other hand, females are regarded as less risk-tolerant due to their engagement in less risky behaviour and risk-averse characteristic in most facets of life (Eckel & Grossman, Citation2002).
Life satisfaction is one of the domains of subjective well-being (Diener et al., Citation1985). Life satisfaction is a broad concept that refers to the judgemental factors pertaining to an individual’s life (Dickason, Citation2019). Investors tend to experience life satisfaction when they feel good about their investment endeavours (Diener, Citation2000). Merkle et al. (Citation2015) found that investors tend to be happy when they achieve investment success through active decision making rather than passive decision making. Diener and Ryan (Citation2009) state that individuals compare themselves with others to establish whether or not their lives are satisfactory. Thus, an investor’s life satisfaction can be derived from relative comparison amongst other investors. Additionally, if an investor experiences any deviation between the current level of life satisfaction and the desired level of life satisfaction, there is potential that investment decisions may be influenced (Dickason, Citation2019). Therefore, investors should take into consideration the potential consequences that life satisfaction could have on their investment decisions and level of risk tolerance.
Ultimately, investor risk-taking behaviour and perception, life satisfaction, and demographics all contribute towards establishing an investor’s risk tolerance and overall financial behaviour (Dickason, Citation2017; Diener & Ryan, Citation2009; J. Grable & Joo, Citation2000; Merkle et al., Citation2015; Vanguard, Citation2019). Therefore, it is important for investors and investment companies to be aware of these factors and how risk tolerance can influence investors’ financial endeavours.
3. Methodology
3.1. Research purpose and design
The primary objective for this research article was to develop a model against which investment companies could profile their clients more accurately by adding other endogenous factors to existing measures of risk tolerance. This study implemented a quantitative research approach by means of a self-structured questionnaire using validated risk tolerance scales. Furthermore, a positivistic research paradigm was followed since the study aimed to challenge the traditional notion of “the absolute truth of knowledge” (Henning et al., Citation2004) to get a clear reflecting of investors behaviour.
3.2. Study area and sample
The research population for this paper included all investors in South Africa, whereas the sample frame constituted of investors from a single investment company. For this study non-probability, purposeful sampling (snowball sampling) was used to filter those individuals who meet the exclusion criteria of the sample. The questionnaire was distributed to all of the participants of an investment company to achieve a response of 1 065 participants. Demographic questions relating to geographic location, gender, race, language and age were included in the questionnaire to filter those individuals who met the inclusion criteria. This assisted to determine the degree to which the sample was representative of the target population and, accordingly, the extent to which the discoveries of this article might be generalised to the population. In inclusion criteria required participants to be older than 16 years of age, earning any source of income, and taking part in investment activities using an investment firm.
3.3. Survey design and procedure method
The survey was sent electronically to the clients of the investment firm. Section A of the survey included the demographic information of the sample where participants had to give details of their gender, age, race, income, education and geographic location. Section B consisted of the risk tolerance scale, the survey of consumer finance (SCF). The SCF does not fully incorporate all of the variables of financial risk tolerance (four-item scale) but is a comprehensive measure for investment choice attitudes and experience (Grable & Lytton, Citation2001). The single risk tolerance scale consists of the following question: Which of the following statements comes closest to the amount of financial risk that you and your (husband/wife/partner) are willing to take when you save or make investments?
1. Take substantial financial risks expecting to earn substantial returns.
2. Take above-average financial risks expecting to earn above-average returns.
3. Take average financial risks expecting to earn average returns.
4. Not willing to take any financial risks.
Section C of the survey consisted of questions pertaining to the life satisfaction of the participants. A seven-point Likert scale was used for respondents to rate the questions of life satisfaction (SWL). The scale ranged from 1 (strongly agree) to 7 (strongly disagree). The SWL scale also included judgemental and emotional components. The five-factor SWL scale (derived from 48 items) focused on emotional as well as judgemental aspects. The statements for the satisfaction of life scale is mentioned below:
Section D focussed on risk-taking behaviour and perception within certain domains within an individual’s life. This scale assesses different components of risk attitudes such as risk-taking, risk perception and perceived expected benefits. This involves six domains, namely social, recreational, investment, gambling, health and/or safety and ethical domains (Weller et al., Citation2015). The scale includes 28 items were three or more items were used under each domain.
3.4. Reliability of scales
To validate the internal reliability consistency of this scale, Cronbach alpha values for the validated scales were confirmed within this context. According to Cronbach (Citation1951), the reliability of a scale is dependent on the number of items in a scale, hence value around 0.7 is acceptable in terms of internal reliability consistency for continuous variables. Since this was a self-constructed survey based on literature, the internal consistency reliability had to be performed. The life satisfaction scale obtained a Cronbach alpha value of 0.887. Cronbach alpha of 0.852 was obtained for the on risk-taking behaviour and perception scale, which included 28 items. The subjective risk tolerance scale was a validated single question scale that was used.
3.5. Data analysis
Data analysis made use of the Statistical Packages of Social Sciences (IBM SPSS) version 25 and AMOS. Data analysis involved the use of descriptive statistics including frequency distributions to report the demographics of the sample. In addition, structural equation modelling (SEM) was employed.
4. Results of the study
This section reports the results of the collected and analysed data. Firstly, the demographic background of the sample is reported. Secondly, the section presents the structural model and the model fit assessment.
4.1. Demographic background of the sample
When considering the age distribution in Figure , it can be seen that the majority of the sample were older than 50 years (41.2%). This age group was followed by investors between the ages of 35 years and 49 years of age (35.1%). The minority of the sample was between 16 years and 34 years of age (23.7%). Figure also displays the gender distribution between males and females and the majority of the sample that participated in the questionnaire were females (53.4%), while male investors represented only 46.6 per cent of the sample.
Figure 1. Demographic distribution of the sample.
4.2. Structural model and model fit assessment
The structural model can be indicated and laid out for specification in the section below (Hardy & Bryman, Citation2004). The SEM included all factors which had a relationship with investor risk tolerance. Hence, only gender and age were appropriate demographic variables to be included in the model.
Both demographic variables, age and gender did significantly influence investor risk tolerance. A negative relationship was found between age and risk tolerance. This is consistent with previous studies who found that risk tolerance decreases with age (Bajtelsmit & VanDerhei, Citation1997; Brooks et al., Citation2018; Brown, Citation1990; Coleman, Citation2003; Dickason & Ferreira, Citation2018; Grable, Citation1997; Halek & Eisenhauer, Citation2001; Hallahan et al., Citation2003; Irwin, Citation1993; Larkin et al., Citation2013; Mabalane, Citation2015; McInish, Citation1982; Morin & Suarez, Citation1983; Palsson, Citation1996; Santacruz, Citation2009; Van den Bergh, Citation2018; Van Schalkwyk, Citation2012; Wallach & Kogan, Citation1961; Yao et al., Citation2004, Citation2011).
Considering life satisfaction in Table , this variable did significantly contribute towards predicting investor risk tolerance (standardised coefficient = 0.071), (p < 0.05). The social domain of risk-taking behaviour and perception did significantly influence (p < 0.01) investor risk tolerance to a strong degree as the squared multiple correlations (SMC) was significant (standardised coefficient = 0.237). The ethical domain of risk-taking behaviour and perception did not influence investor risk tolerance (p > 0.1) with a standardised coefficient of −0.062.
Table 1. Standardised weights of investor risk tolerance
The financial domain did also significantly influence (p < 0.05) investor risk tolerance to a small degree (standardised coefficient = 0.112). A negative relationship also exists between investor risk tolerance and the health and safety domain (standardised coefficient = −0.063) where no significant influence was found (p < 0.1). The negative relationship between investor risk tolerance and health and safety can be expected since an individual’s health consciousness will decrease when their risk tolerance increases. However, the influence of the health and safety variable was not significant for investor risk tolerance. Considering the recreational domain of risk-taking behaviour and perception, no significant influence was found towards predicting risk tolerance (p < 0.1).
The comparative fit index (CFI) was also performed where a value of 0.821 was obtained. Values that are closer to one indicates a better fit whereas those closer to zero indicated that the data do not fit the model (Malhotra et al., Citation2012). The values close to 0.9 indicates a marginal goodness-of-fit (Mueller, Citation1996). Absolute badness-of-fit indices require values that are lower since these measures measure error or deviation, for example, the chi-square test X2, the root mean square residuals (RMSR the standardised root mean square residuals (SRMSR) and the root mean square error of approximation (RMSEA) (Malhotra et al., Citation2012). The chi-square value was obtained by dividing the minimum sample discrepancy with the degrees of freedom (CMIN/DF). Mueller (Citation1996) argues that ratios between three and five are still acceptable as a good model fit. In this case, a value of 5.051 was obtained where this value is still acceptable indicating a goodness-of-fit. An RMSEA of 0.059 was found at the 90 per cent confidence interval [0.057:0.61] per cent. The model is regarded as a good fit where the RMSEA is 0.08 or less (Blunch, Citation2008). The last step in conducting SEM comprises valuable conclusions and recommendations on the structured model for future research (Malhotra et al., Citation2012).
Figure 2. Structural model of investor risk tolerance, gender, age, life satisfaction risk-taking behaviour and perception.
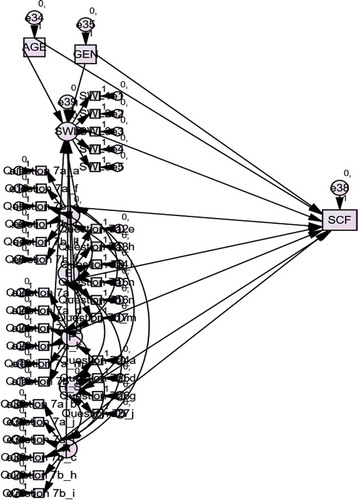
5. Conclusion and recommendations
Risk can have different effects on investors, positive, neutral and negative. Therefore, the amount of risk investors are willing to tolerate can be displayed in their attitude. This attitude can be influenced by demographic factors, life satisfaction and risk-taking behaviour and perception. The main objective for an investor to embark on investments is to create wealth and to first create wealth-income is needed. Investments can influence investor’s life satisfaction when there is a deviation between expected and actual investment returns. As a result, this research article focused on how demographics, life satisfaction and risk-taking behaviour and perception in several life domains influences risk tolerance.
The primary objective was achieved by means of a SEM development. The development of this SEM is aimed at identifying the influence risk-taking behaviour and perception, along with their life satisfaction, age and gender on financial risk tolerance. The results indicated that age and gender significantly influence the risk tolerance of investors. A negative relationship was found between age and risk tolerance which indicate that risk tolerance decrease for older investors. Moreover, life satisfaction significantly contributes to the prediction of investor risk tolerance. The development of this risk tolerance SEM is unique in its existence, as it is the first model to incorporate demographics, life-satisfaction, risk perception and risk tolerance level in the South African context.
This paper also acknowledges a number of limitations within the research. The researchers utilised a quantitative research approach to model investor behaviour whereby a mixed-method approach can be recommended. Moreover, only risk-taking behaviour and perception was used whereas in future research the Hexaco scale can be included. Furthermore, the study made use of investors from one investment company in South Africa and it is suggested to include participants of more than one investment company.
Additional information
Funding
Notes on contributors
Zandri Dickason-Koekemoer
Dr Sune Ferreira and Dr Zandri Dickason-Koekemoer specialise in financial risk management having obtained their PhD degrees in this field. Their main focus area is on financial risk tolerance, depositor behaviour, investor behaviour, behavioural finance, and the financial well-being of investors. These researchers have already published several articles in accredited journals regarding this field of interest.
References
- Bajtelsmit, V. L., & VanDerhei, J. L. (1997). Risk aversion and pension investment choices. Positioning Pensions for the Twenty-first Century, 45(1), 66.
- Blais, A., & Weber, E. U. (2006). A domain-specific risk-taking (DOSPERT) scale for adult populations. Judgment and Decision Making, 1(1), 33–10.
- Blume, M. E. (1971). On the assessment of risk. The Journal of Finance, 26(1), 1–10.
- Blunch, N. J. (2008). Introduction to structural equation modelling using SPSS and AMOS. London: SAGE doi:10.4135/9781446249345
- Brooks, C., Sangiorgi, I., Hillenbrand, C., & Money, K. (2018). Why are older investors less willing to take financial risks? International Review of Financial Analysis, 56(1), 52–72. https://doi.org/10.1016/j.irfa.2017.12.008
- Brown, D. (1990). Age clienteles induced by liquidity constraints. International Economic Review, 31(1), 891–912.
- Coleman, S. (2003). Risk tolerance and the investment behaviour of black and Hispanic heads of household. Financial Counseling and Planning, 14(2), 43–52. https://papers.ssrn.com/sol3/papers.cfm?abstract_id=2265572
- Cooper, D. (2003). Understanding how personality & perception can influence risk taking. The Journal for Occupational Safety and Health Professionals:39-46.
- Cronbach, L. J. (1951). Coefficient alpha and the internal structure of tests. Psychometrika, 16(1), 297–334. https://link.springer.com/article/10.1007%252FBF02310555
- Di Dottorato, T. (2013). Behavioral finance and financial markets: micro, macro and corporate. Ancona, Italy: Università Politecnica Delle Marche. (Thesis-Phd)
- Dickason, Z. (2017). Modelling investor behaviour in the South African context [Thesis – PhD]. North-West University.
- Dickason, Z. (2019). Risk tolerance: The influence of gender and life satisfaction. Journal of Economics and Behavioral Studies, 11(1), 66–72. https://doi.org/10.22610/jebs.v11i1(J).2749
- Dickason, Z., & Ferreira, S. (2018). The effect of age and gender on financial risk tolerance of South African investors. Investment Management and Financial Innovations, 15(2), 1–8. https://www.ceeol.com/search/article-detail?id=741465
- Diener, E., Sandvik, E., & Pavot, W. (1991). Happiness is the frequency, not the intensity, of positive versus negative effect. In F. Strack, M. Argyle, & N. Schwarz (Eds.), Subjective well-being: An interdisciplinary perspective (pp. 119–139). Pergamon.
- Diener, E. (2000). Subjective well-being: The science of happiness and a proposal for a national index. American Psychologist, 55(2000), 34–43.
- Diener, E., Emmons, R. A., & Griffin, S. (1985). The satisfaction with life scale. Journal of Personality Assessment, 49(1), 71–75. https://doi.org/10.1207/s15327752jpa4901_13
- Diener, E., & Ryan, K. (2009). Subjective well-being: A general overview. South African Journal of Psychology, 34(4), 391–406. https://doi.org/10.1177/008124630903900402
- Eckel, C. C., & Grossman, P. J. (2002). Sex differences and statistical stereotyping in attitudes towards financial risk. Evolution and Human Behaviour, 23(1), 281–295. https://doi.org/10.1016/S1090-5138(02)00097-1
- Filbeck, G., Hatfield, P., & Horvath, P. (2005). Risk aversion and personality type. The Journal of Behavioral Finance, 6(4), 170–180. https://doi.org/10.1207/s15427579jpfm0604_1
- Grable, J., & Joo, S. (2000). A cross-disciplinary examination of financial risk tolerance. Consumer Interests Annual, 46(2000), 151–157.
- Grable, J. E. (1997). Investor risk tolerance: Testing the efficacy of demographics as differentiating and classifying factors [Thesis-PhD]. Virginia Polytechnic Institute and State University.
- Grable, J. E. (2008). Risk tolerance. In J. J. Xiao (Ed.), Advances in consumer financial behavior research (pp. 1–20). Springer.
- Grable, J. E. (2016). Financial risk tolerance. Springer International Publishing.
- Grable, J. E. (2017). Financial risk tolerance: A psychometric review. Research Foundation Briefs, 4(1), 1–27.
- Grable, J. E., & Lytton, R. H. (1999). Assessing financial risk tolerance: Do demographic, socioeconomic and attitudinal factors work. Family Relations and Human Development/Family Economics and Resource Management Biennial, 3(1), 80–88.
- Grable, J. E., & Lytton, R. H. (2001). Assessing the concurrent validity of the SCF risk tolerance question. Association for Financial Counseling and Planning Education, 12(2), 43–53. http://citeseerx.ist.psu.edu/viewdoc/download?doi=10.1.1.323.75&rep=rep1&type=pdf
- Grable, J. E., McGill, S., & Britt, S. (2009). Risk tolerance estimation bias: The age effect. Journal of Business & Economic Research, 7(7), 1–12. https://doi.org/10.19030/jber.v7i7.2308
- Halek, M., & Eisenhauer, J. G. (2001). Demography of risk aversion. The Journal of Risk and Insurance, 68(1), 1–24. http://citeseerx.ist.psu.edu/viewdoc/summary?doi=10.1.1.197.8454
- Hallahan, T., Faff, R. W., & McKenzie, M. (2003). An explanatory investigation of the relation between risk tolerance scores and demographic characteristics. Journal of Multinational Financial Management, 13(1), 483–502. https://doi.org/10.1016/S1042-444X(03)00022-7
- Hanna, S. D., & Lindamood, S. (2007). Risk tolerance: Cause or effect. Academy of Financial Services Proceedings, 1–9.
- Hardy, M. & Bryman, A. (2004). Handbook of data analysis. London: SAGE doi:10.4135/9781848608184
- Head, G. L. (1967). An alternative to defining risk as uncertainty. The Journal of Risk and Insurance, 34(2), 205–214. doi: 10.2307/251319
- Henning, E., Van Rensburg, W., & Smit, B. (2004). Finding your way in qualitative research. Van Schaik.
- Irwin, C. E. (1993). Adolescence and risk taking: How are they related? In N. J. Bell & R. W. Bell (Eds.), Adolescent risk taking (pp. 7–28). Sage.
- Kolb, B. (2008). Marketing research: A practical approach. SAGE Publications Inc.
- Larkin, C., Lucey, B. M., & Mulholland, M. (2013). Risk tolerance and demographic characteristics: Preliminary Irish evidence. Financial Services Review, 22(1), 1–26. https://web.b.ebscohost.com/ehost/detail/detail?vid=0&sid=8154cfa5-30e5-441b-b09f-facf0548de0b%40pdc-v-sessmgr01&bdata=
- Mabalane, M. D. (2015). Cultural and demographic differences in financial risk tolerance. (Dissertation-Masters). University of Pretoria.
- Malhotra, N. K., Birks, D. F., & Wills, P. (2012). Marketing research: An applied approach (4th ed.). Pearson Education Inc.
- McInish, T. H. (1982). Individual investors and risk-taking. Journal of Economic Psychology, 2(1), 125–136. https://doi.org/10.1016/0167-4870(82)90030-7
- Merkle, C., Egan, D. P., & Davies, G. B. (2015). Investor happiness. Journal of Economic Psychology, 49(2015), 167–186. https://doi.org/10.1016/j.joep.2015.05.007
- Morin, R. A., & Suarez, A. F. (1983). Risk aversion revisited. Journal of Finance, 38(1), 1201–1216. https://doi.org/10.1111/j.1540-6261.1983.tb02291
- Mueller, R. O. (1996). Basic principles of structural equation modeling: An introduction to LISREL and EQS. Springer.
- Palsson, A. M. (1996). Does the degree of relative risk aversion vary with household characteristics? Journal of Economic Psychology, 17(1), 771–787. https://doi.org/10.1016/S0167-4870(96)00039-6
- Paulsen, D. J., Platt, M. L., Huettel, S. A., & Brannon, E. M. (2012). From risk-seeking to risk-averse: The development of economic risk preference from childhood to adulthood. Frontiers in Psychology, 3, 1–6. https://doi.org/10.3389/fpsyg.2012.00313
- Roszkwoski, M. J., Snelbecker, G. E., & Leimberg, S. R. (1993). Risk tolerance and risk aversion. The Tools and Techniques of Financial Planning, 4(1), 213–225.
- Santacruz, L. (2009). Effect of general economic mood on investor risk tolerance-implications for financial planning. The Finsia Journal of Applied Finance:, 35–42. https://search.informit.com.au/documentSummary;dn=200905055;res=IELAPA;type=pdf
- Saris, W. E., Veenhoven, R., Scherpenzeel, A. C., & Bunting, B. (1996). A comparative study of satisfaction with life in Europe. Eötvös University Press.
- Shirazi, M., & Khan, M. A. (2013). Life satisfaction among professional and non-professional students in India. International Journal of Applied Psychology, 3(4), 109–113. DOI: 10.5923/j.ijap.20130304.03
- Slovic, P. (1966). Risk-taking in children: Age and sex differences. Child Development, 37(1), 169–176. doi: 10.2307/1126437
- Snelbecker, G. E., Roskowski, M. J., & Cutler, N. E. (1990). Investors’ risk-tolerance and return aspirations, and financial advisors’s interpretations: A conceptual model and exploratory data. The Journal of Behavioral Economics, 19(1), 377–393.
- Van de Venter, G., Michayluk, D., & Davey, G. (2012). A longitudinal study of financial risk tolerance. Journal of Economic Psychology, 33(2012), 794–800. https://doi.org/10.1016/j.joep.2012.03.001
- Van den Bergh, A. (2018). Analysing risk tolerance during the investor lifecycle [Thesis-Masters]. NWU.
- Van Schalkwyk, C. H. 2012. Member choice in a defined benefit contribution pension plan: Decision-making factors [Unpublished doctoral thesis]. University of Johannesburg.
- Vanguard. (2019). Behavioural finance. Accessed 10 Jun, 2019, from https://www.vanguard.co.uk/documents/portal/literature/behavourial-finance-guide.pdf
- Wallach, M. A., & Kogan, N. (1961). Aspects of judgement and decision making: Interrelationships and changes with age. Behavioural Science, 6(1), 23–26. https://doi.org/10.1002/bs.3830060104
- Weller, J. A., Ceschi, A., & Randolph, C. (2015). Decision-making competence predicts domain-specific risk attitudes. Frontiers in Psychology, 6(1), 1–12 doi:10.3389/fpsyg.2015.00540
- Weller, J. A., & Tikir, A. (2010). Predicting domain-specific risk taking with the HEXACO personality structure. Journal of Behavioural Decision Making, 24(2), 117–222. https://doi.org/10.1002/bdm.677
- Yao, R., Hanna, S. D., & Lindamood, S. (2004). Changes in financial risk tolerance, 1983-2001. Financial Services Review, 13(1), 249–266. https://papers.ssrn.com/sol3/papers.cfm?abstract_id=2740157
- Yao, R., Sharpe, D. L., & Wang, F. (2011). Decomposing the age effect on risk tolerance. The Journal of Socio-Economics, 40(1), 879–887. https://doi.org/10.1016/j.socec.2011.08.023