?Mathematical formulae have been encoded as MathML and are displayed in this HTML version using MathJax in order to improve their display. Uncheck the box to turn MathJax off. This feature requires Javascript. Click on a formula to zoom.
Abstract
The prominent role of financial inclusion in every economy—as it has been widely acknowledged as an enabler to achieving eight out of the 17 Sustainable Development Goals (SDGs) cannot be overemphasized as far as the welfare of individuals is concerned. This study estimates the effects of financial inclusion on welfare using cross-section data from 33 sub-Saharan African countries and the ordinary least squares technique is employed for the analysis. The results from the financial inclusion index estimation reveal that, generally, financial inclusion in the sub-region is low as 29 out of the 33 sampled countries have low financial inclusion index. It is also revealed that financial inclusion has positive effect on welfare. With regard to the control variables, the study reveals that education and income also improve welfare. Based on the positive effect of financial inclusion on welfare, important implications that seek to promote financial inclusion in the sub-region have been provided for policy consideration.
PUBLIC INTEREST STATEMENT
Financial inclusion plays a key role in every economy as it is envisaged as an enabler to achieving eight (Goals 1, 2, 3, 5, 8, 9, 10 and 17—which are no poverty, zero hunger, good health and wellbeing, gender equality, decent work and economic growth, industry, innovation and infrastructure, reduced inequalities and partnerships for the goals, respectively) out of the 17 SDGs. This implies that, ensuring greater financial inclusion has the potential of improving welfare. This study estimates the effects of financial inclusion on welfare using data on 33 sub-Saharan African countries. The financial inclusion level of these countries is also examined. Indeed, the study has shown that better financial inclusion improves welfare in the sub-region. The study further indicates that level of financial inclusion in the region is generally low. The study highlights some important implications that seek to promote financial inclusion in the sub-region for policy consideration.
1. Introduction
Financial inclusion helps to make financial services more accessible to all by ensuring that there is a robust financial market. World Bank (Citation2014a) describes financial inclusion as when many individuals and firms have access to and use of formal financial services such as savings, deposits, payments, loans, insurance, financial intermediation, and financial advisory services at affordable price. Financial inclusion has also been defined as increasing formal financial services such as savings, access to credit and bank account to large segment of people in the society (Efobi et al., Citation2014). Also, financial inclusion is envisaged as very key in every economy (Baidoo & Akoto, Citation2019; Oteng-Abayie, Citation2017; Sakyi et al., Citation2019) because it is seen as an enabler to achieving eight (Goals 1, 2, 3, 5, 8, 9, 10 and 17) out of the seventeen sustainable development goals (SDGs). These eight goals are no poverty, zero hunger, good health and wellbeing, gender equality, decent work and economic growth, industry, innovation and infrastructure, reduced inequalities, and partnerships for the goals accordingly.
The African Development Bank (AfDB) (Citation2012) reports that sub-Saharan Africa (SSA) has experienced robust economic growth with six countries in the region being among the ten fastest-growing countries in the world over the past one and a half decades. However, this tremendous achievement seems to have benefitted a few wealthy elites as data shows that this growth was just able to reduce the proportion of people living on less than US$1.25 a day from 52.75 percent (in 1981) to 46.85% (in 2011) (World Bank, Citation2014b). Devarajan and Fengler (Citation2013) explain that this slow pace of poverty reduction and widening income inequality in sub-Saharan Africa could be attributed to inadequate financial inclusion. According to World Bank (Citation2014a) and Demirgüç-Kunt and Klapper (Citation2012a), inclusive financial system is linked to poverty reduction, prosperity, and promoting sustainable inclusive economic growth and development. World Bank (Citation2013) and AfDB (Citation2013) have emphasized that one sure way of inclusive development is financial inclusion, an area in which Africa is largely lagging behind other continents.
Jalilian and Kirkpatrick (Citation2005), Nanziri (Citation2016), and Ibrahim and Olasunkanmi (Citation2019) have argued that high level of financial inclusion is often associated with high rate of investment, employment, high-income and low-poverty rate, and therefore, economic growth can only be sustained if a significant number of the population have greater access to formal financial services. However, Demirguc-Kunt and Klapper (Citation2012b) report that less than a quarter of the adult population in sub-Saharan Africa owns bank account. In addition, data from the Global Financial Index dataset of the World Bank reveals that not more than a quarter of adults in Africa have an account with formal financial institutions and also many adults in Africa use informal means to save. Likewise, many small-sized enterprises in Africa lack access to finance, and this is seen as a major obstacle for firm’s growth.
Africa’s financial systems generally lag behind those in other developing economies. According to the development indicators report by World Bank (Citation2012), the main indicator of financial depth is private credit (as a share of gross domestic product [GDP]). Demirguc-Kunt and Klapper (Citation2012b) document that the proportion of private credit to GDP averaged 24 and 39 percent for sub-Saharan and North Africa, respectively, in 2010 compared with 77 and 172% in all other emerging and high-income economies in the same year. A study by Beck and Demirgüç-Kunt (Citation2008) shows that the non-bank section of Africa’s financial systems thwarts the advancement in the banking sector. The authors conclude that less than half of African countries have stock markets and few of these are liquid. The World Bank Group indicates that with the exception of South Africa, African stock exchanges (measured by market capitalization to GDP ratio) are low. The group further indicates that the proportion of market capitalization to GDP is only 38 percent on average, compared with 44 and 62% in all other developing and developed economies, respectively.
From both theoretical and empirical perspectives, it has been established that broader access to formal financial services enhances overall welfare and supports prosperity. In this regard, Bruhn and Love (Citation2014) elaborate that greater financial inclusion through rural bank branch expansion and extension of financial products lowers poverty rate and increases saving and business growth. Saving helps build transaction history, improves credit scores and provides a safety net in case of any emergency, thus opening doors for easy access to credit facilities. Access to financial services like savings and investment also improves the balance sheet of households in productivity—enhancing economic activities that support economic growth and raises the standard of living of the poor. Therefore, by increasing economic access, customers can enhance their welfare and there will be spill over effects on the economy and general community prosperity. In addition, it is documented that, when small and medium-scale enterprises (SME) have access to loans, it enables them to invest in productive assets which in turn increases job creation (Baidoo et al., Citation2020) which also then improves welfare. Hawkins (Citation2011) further indicates that the current global financial inclusion drive is ensuring that formal financial services and products are accessible and affordable to those who require them and this empowers them to live meaningful lives and also contributes to the financial development of their countries. Households need payment processes to reduce risks and obtain credit to resolve their loan constraints, save, invest and make financial provision for their old age to enhance welfare.
Again, it is indicated that financial development influences welfare. Greenwood and Jovanovic (Citation1990) report that at the early stage of economic development, financial inclusion is low, and so, only the higher income group accesses and benefits from the financial system. As the lower-income group is financially excluded, the inequality gap is widened and hence deterioration in welfare. Greenwood and Jovanovic (Citation1990) further show that as economies develop and financial services improve over time, financial services become available to more people, and the inequality gap is reduced. The studies by Galor and Zeira (Citation1993) and Banerjee and Newman (Citation1993) have furthered this notion by arguing that financial market imperfections discourage the poor from borrowing adequately to invest in human and physical capital. The authors explain this from a scenario where individuals inherit different amount of wealth. Individuals who inherit large wealth invest in education and take up skilled jobs whilst those who inherit less wealth resort to borrowing for investment in human capital. Given the imperfections in the financial markets which often lead to higher borrowing cost, individuals who are unable to borrow will remain unskilled. As the economy expands and the financial market develops, the imperfections reduce and cost of borrowing also reduces. As a result of the reduction in borrowing cost, many people then have the opportunity to borrow for human capital investments and upgrade their earning potentials. In sum, as economies developed, financial inclusion is improved, inequality reduces, standard of living rises and hence improvement in welfare. Clarke et al. (Citation2006) further add that inequality is lower in countries with better-developed financial markets and financial intermediaries. This implies that increasing availability of financial institutions seems to be an important conduit for inclusive development and improvement in welfare as indicated by researchers (see: Chibba, Citation2009; Park & Mercado, Citation2015; Sarma & Pais, Citation2011).
It could be deduced therefore that better financial inclusion could reduce poverty, income inequality and enhance welfare of Africans. However, most previous studies on sub-Saharan Africa have focused on the effect of microfinance programmes on households’ welfare at the micro level such as household’s income, business’ income, asset accumulation, health, education, food security and nutrition, child labour, job creation, women empowerment and housing. For instance, the study by Tita and Aziakpono (Citation2017) which sought to examine the aspects of financial inclusion that have the greatest effects on welfare used disaggregated data for the analysis. It considers individual effect of three financial inclusion indicators: formal account, electronic payment, and saving. However, the present study becomes eminent by using more financial inclusion indicators which captures all the three major dimensions (penetration, availability, and usage) of financial inclusion. It also creates an index of financial inclusion using more financial inclusion indicators, which help to compare the level of financial inclusion among the countries in the study to facilitate effective and comprehensive individual country policy adoption and implementation. Further, the present study also uses a quantitative approach to estimate the effect of financial inclusion on welfare as compared to previous studies (see: Fadun, Citation2014; Jones, Citation2008) which have strictly used qualitative methods for the analysis which may not be adequate for effective policy purposes.
The main objective of this study is to examine the financial inclusion-welfare nexus in sub-Saharan Africa. In particular, the study seeks to quantitatively estimate the effect of financial inclusion on welfare in sub-Saharan Africa and also examine the level of financial inclusion among the sampled sub-Saharan African countries.
This study is particularly important because many sub-Saharan African governments have intensified financial inclusion campaign and it is appropriate to undertake such an investigation to justify government’s investment in financial inclusion-related projects. The study is also important as the outcome would further provide policy directions to governments of countries within the sub-region. Some African countries have experienced positive developments following improved access to financial services in recent decades. Deepening of the financial sector and the use of new technologies such as mobile money has broaden access to financial services, including savings, payment products and credit to individuals and enterprises. Given this, the present study would help increase access to knowledge on relevant and affordable financial services for the currently unbanked individuals and also improve the capacity of the financial sector to ensure better services and ultimately improve financial inclusion within the region. Further, the findings of this study would be useful for policymaking concerning financial development, financial inclusion and welfare of individuals and business development in the sub-Saharan African region. The outcome would also inform development organizations such as the World Bank, International Monetary Fund and African Development Bank on their financial inclusion intervention programs.
The remaining of the paper is arranged as follows. What follows is the theoretical underpinnings. Next is the empirical methodology which discusses the methods the study adopts. This is followed by the empirical results and discussion and the last section presents the concluding remarks.
2. Theoretical underpinnings
This section reviews theories and empirical studies which form the basis for this study.
The finance—inequality widening hypothesis postulated by Clarke et al. (Citation2006) explains that when there are institutional constraints, financial development may benefit only the higher income group who are usually credit worthy. The hypothesis thus suggests that financial development benefits the high-income group. The Lower income group who relatively lacks access to credit and sufficient collateral may find it difficult to access financial services. Therefore, the poor individual is equipped with only primary education and later joins the unskilled labor market and earn lower wages which in turn reduces welfare. Contrary to the finance—inequality widening hypothesis, Galor and Zeira (Citation1993) and Banerjee and Newman (Citation1993) put forward the finance-inequality narrowing hypothesis. According to the hypothesis, the deficiencies in financial markets deter the poor from patronizing financial services such as borrowing adequately to invest in human and physical capital. A group of individuals assumed to inherit more wealth invest in education and therefore take up skilled jobs. The group that inherits less wealth is left with no other option but to borrow and invest in education. Individuals who inherit less wealth will remain unskilled and this can go on from one generation to another. This hypothesis, however advances its argument that financial development expands financial services and broaden access to credit which provides an avenue for the poor to borrow for human capital investments and improve their earning potentials which in turn also enhance their welfare. The financial-inequality narrowing hypothesis concludes that there is a negative relationship between income inequality the financial development—as financial development improves, inequality reduces and welfare is improved.
Greenwood and Jovanovic (Citation1990) develop a theoretical model that captures elements of both finance-inequality widening and finance-inequality narrowing hypotheses. Greenwood and Jovanovic (Citation1990) explain that at the early stages of economic development, the higher income group has the opportunity to access and benefit from financial services. This implies that as financial systems expand and there is rapid economic growth, the income difference between the rich and the poor widens. This aspect of the model predicts an inverted u-shaped relationship between income inequality and financial sector development. From another perspective, as the financial sector develops, it provides wider financial access to the economy and the poor, and as the economy reaches a stable and steady state, income inequality begins to decrease, before eventually stabilizing.
To link financial inclusion to welfare, Radcliffe and Voorhies (Citation2012) explain that ownership of formal account in a financial institution grants households the opportunity to accumulate funds to invest in activities that generate income such as micro enterprises, purchasing of farming inputs like tractors and fertilizers, investing in the education of children, planning for retirement, and managing day-to-day risk. Hence, a basic account serves as a store-of-value, for precautionary purposes and a safe place to store money outside the home to avoid impulse spending. Electronic payments can also help improve the welfare of the individual. The introduction of an electronic payment system presents a number of advantages including cost and time saving, increased sales, reduced transaction costs and creating a reliable link between government, employers, employees and families for direct payment of social grants, wages, and remittances to friends and families abroad, thus the convenience it creates for consumers (Ehrbeck et al., Citation2010). When financial market is relatively perfect, individuals with entrepreneurial ability gain access to credit to finance their projects. The above analogy suggests that the effect of financial inclusion on some dimensions of welfare such as income inequality may be positive as revealed by some authors (see: Attanasio et al., Citation2015; Bauchet et al., Citation2011; Pitt & Khandker, Citation1998).
On the empirical front, Amendola et al. (Citation2016) investigate the relationship between financial access and household welfare in Mauritania. The study uses micro-level data from a 2014 household survey and the ordinary least squares technique is employed as the analytical tool. The results show that household headed by the aged, educated people and residents in urban areas is associated with better access to financial services which in turn improves welfare. Using the ordinary least squares estimation technique, Nanziri (Citation2016) examines the relationship between financial inclusion and welfare in South Africa. The results indicate that better financial inclusion is associated with higher welfare. The author further indicates that women who use non-formal credit have lower welfare. Tita and Aziakpono (Citation2017) examine the nexus between financial inclusion and welfare in sub-Saharan Africa by using disaggregated data for the analysis. The results show that formal account use for business, electronic payment and formal savings have a positive relationship with welfare. Similarly, using national representative household finance survey data on China, Zhang (Citation2017) examines the effect of financial inclusion on household income using ordinary least squares and quantile regressions methods. The cross sectional data used is obtained from the China Household Financial Survey. First, the results from the ordinary least squares indicate that financial inclusion has a strong positive effect on household income across all households regardless of the income level. Given that income is a key determinant of household welfare, the outcome suggests that financial inclusion improves household welfare. Second, the quantile regression approach shows that low-income households benefit more from financial inclusion than the richer counterparts.
In a related study, Addury (Citation2019) assesses the financial inclusion—welfare nexus in a broader context for Indonesia. Specifically, the study examines the influence of the amount of credit and investment on household income, household consumption expenditure, and household living facilities that actually influence welfare. Data for the study is obtained from the Indonesia Family Life Survey in the period 2000, 2007 and 2014 and a panel estimation technique is used for the analysis. The results reveal a significant positive relationship between amount of credit and household income. A positive and significant relationship between amount of credit and savings and household consumption expenditure is also revealed. Further, by utilizing a unique household survey panel data, Mallick and Zhang (Citation2019) estimate the effects of financial inclusion on household welfare in China. The study shows that the effects of financial inclusion on welfare varied across urban and rural areas and income groups. It is further revealed that financial inclusion significantly increases overall consumption, but the impact is greater for urban households compared with rural households.
3. Empirical methodology
This section is devoted to the methodologies adopted to achieve the objectives of the study. The section specifically focuses on data type and source, model specification, variable description as well as the estimation procedures.
3.1. Data type and source
The study uses secondary data on 33 sub-Saharan African countries (see Table in the Appendix for country list). Cross sectional data for the year 2017 on these countries is obtained for the analysis. These countries and the year are selected mainly due to data availability on all the variables the study considers. The data considered in this study are human development index (a measure for welfare), financial inclusion index, income, education, and unemployment. Data on human development index (HDI) and education are obtained from the United Nations Development Programme database, whereas those on income and unemployment are obtained from the World Banks’ World Development Indicators. The data used for the calculation of financial inclusion index such as number of deposit account with commercial banks per 1000 adults, automated teller machines per 100,000 adults and outstanding loans from commercial banks as a percentage of gross domestic product is obtained from the Financial Access Survey (FAS) of the International Monetary Fund database.
3.2. Model specification, variable description and estimation procedures
The study specifies the following model for estimation following Amendola et al. (Citation2016) and Zhang (Citation2017).
where represents welfare, and
,
,
and
denote financial inclusion, income, unemployment and education, respectively. The subscript
represents the
country. The estimable form of EquationEquation (1)
(1)
(1) is specified in EquationEquation (2)
(2)
(2) .
where the variables are as explained earlier in EquationEquation (1)(1)
(1) ,
is the elasticity of financial inclusion which measures the effect of financial inclusion on welfare,
,
, and
are, respectively, the elasticities of income, unemployment, and education,
and
represent the constant and error terms, respectively, and
is the logarithm notation.
With regard to measurement of the variables, welfare is measured using human development index (HDI). The HDI is a measure that summarizes the average achievement in three key dimensions of human development—long and healthy life, being knowledgeable, and having a decent living standard. The HDI is the geometric mean of normalized indices for each of the three dimensions. The health, education, and standard of living dimensions of the HDI are assessed using life expectancy at birth, mean of years of schooling for adults aged 25 years and more and expected years of schooling for children of school entering age and gross national income per capita (PPP $) respectively. These scores (for the three HDI dimension indices) are then aggregated into a composite index using geometric mean. The HDI index has a value that ranges from 0 to 1, with values close to 1 indicating better welfare and those close to 0 indicating poor welfare. A study by Sakyi et al. (Citation2018) also measured welfare using human development index. For the independent variables, income is measured by gross national income in constant US dollars (US$). Gross national income captures income accumulated to residents of a country which includes remittances and aid but excludes income repatriated abroad. Education is measured by mean years of schooling—the average number of years of education received by the population of a country. Unemployment which is defined as the proportion of the labour force that is without work but available for and seeking employment is measured as the total unemployment as a percentage of total labour force. Income and education are expected to affect welfare positively. This is because, as one earns higher income, it is expected that consumption of goods and services will increase and hence welfare will be improved. Again, as individuals attain more years of education, they can secure skilled jobs that are associated with higher income and standard of living which in turn improves welfare. Unemployment is however expected to affect welfare negatively. This is because, unemployed individuals may not earn income all other things being equal, and this will imply that their consumption of goods and services which improves their welfare will be limited.
For the financial inclusion variable, the study calculates an index and uses that for estimation. The index of financial inclusion is a multi-dimensional index that captures information on the various dimensions of financial inclusion which is then codified in one single digit ranging from 0 to 1, where 0 and 1 represent total financial exclusion and total financial inclusion, respectively. Sarma (Citation2008) develops a financial inclusion index across different countries of the world. Following Sarma’s approach, this study develops a financial inclusion index for the selected sub-Saharan African countries. The reason for adopting Sarma’s technique is that, a lot of financial indicators have been used in obtaining the index. Indicators such as the number of bank accounts, number of bank branches, number of ATMs, amount of bank credit and amount of bank deposit are the most frequently used. These indicators are often used separately and hence they only give partial information on how financial systems are inclusive in an economy and hence may not adequately capture the level of financial inclusion.
The financial inclusion index this study proposes captures information on several dimensions of an inclusive financial system. Therefore, the obtained index can be used to compare levels of financial inclusion across economies. It can also be used to monitor the progress of policy initiatives for financial inclusion over a period of time. For the purpose of this study, the number of deposit accounts with commercial banks per 1,000 adults measure is used for accessibility, which is also known as the penetration for banking system. Automated teller machine (ATMs) per 100,000 adults with commercial bank branches per 100,000 adults is also used to measure the availability dimension. For the usage dimension, the outstanding loans from commercial banks and outstanding deposits with commercial banks, all as a percentage of gross domestic product are used. The proposed financial inclusion index is computed by first calculating a dimension index for each dimension (penetration, availability, and usage) of financial inclusion for the 33 countries. The computation of the dimension index follows the specification of Sarma (Citation2008), where the dimension index for ithdimension, d i is derived as follows:
where, represents the actual value of dimension i,
denotes minimum value of dimension which is 0 in this study and
represents the maximum value of dimension i.
For availability dimension, two separate indexes for bank branches and ATMs are first computed. Then, a weighted average of these two indexes using 1/3rd weight for ATM and 2/3rd weight for bank branch are calculated and the summation for both are obtained. Outstanding loans from commercial banks and outstanding deposits with commercial banks as percent of GDP are used for the usage dimension. In view of these three dimensions, the study follows the three dimensional Cartesian space to identify the country i by a point (penetration [], availability [
] and usage [
]). The financial inclusion index is then measured by the normalized inverse Euclidean distance of the point (
from the perfect point (1, 1, 1) (Sarma, Citation2008). The formula is specified in EquationEquation (4)
(4)
(4) .
where, ,
and
represent penetration, availability and usage dimensions, respectively, and
represents the number of dimensions which is three (3) in this study.
The financial inclusion index takes values between 0 and 1, where values closer to 1 indicate high or complete financial inclusion and those close 0 indicates low or complete financial exclusion. The intuition behind the value of the proposed financial inclusion index obtained from EquationEquation (4)(4)
(4) is to categorize the countries according to their level of financial inclusions based on their respective index. The categories are presented as follows: countries with an index values of between 0 and 0.3 (0 ≤ FINDEX <0.3) are considered as low financial inclusion economies. Also, countries with index values of between 0.3 (inclusive) and 0.5 (0.3≤ FINDEX <0.5) are considered as medium financial inclusion economies and countries with index values of between 0.5 and 1 (all inclusive) (0.5 ≤ FINDEX≤ 1) are considered as high financial inclusion economies.
By way of estimating EquationEquation (2)(2)
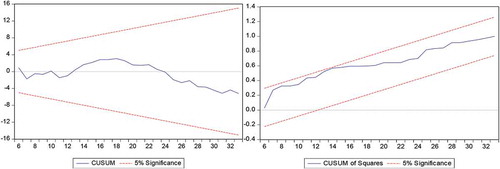
(2) which captures the effect of financial inclusion on welfare, the study uses the ordinary least squares estimation technique as used by studies such as Amendola et al. (Citation2016), Nanziri (Citation2016), and Zhang (Citation2017). Again, to ensure the results from the estimation are consistent, reliable and efficient for effective policy purposes, several diagnostic tests are performed. These include, the normality test, serial correlation test, heteroscedasticity test, functional form test and finally the model stability test. The normality and serial correlation tests are performed using the Jarque Bera normality and Breusch-Godfrey serial correlation tests, respectively. Also, the heteroscedasticity and functional form tests are done using the Breusch-Pagan-Godfrey heteroscedasticity and Ramsey reset tests, respectively. The model stability test is performed by plotting the cumulative sum (CUSUM) and cumulative sum of squares (CUSUMSQ). For the normality, serial correlation, heteroscedasticity and functional form tests, the null hypothesis of absence of these problems in the model are tested against the alternative hypothesis that these problems are present in the model. For the stability test, the model becomes stable when the plots of CUSUM and CUSUMSQ lie within the 95% confident interval lines.
4. Empirical results and discussion
This section presents the empirical results from the study. The section starts with discussion on the descriptive statistics of the data and this is followed by the regression results. The diagnostic test results as well as the level of financial inclusion among the selected countries are also reported and discussed accordingly.
4.1. Descriptive statistics
The summary of the descriptive statistics of the data is reported in Table . The results indicate that welfare in the sub-region is relatively high as indicated by a mean value of 0.53. The HDI for the sampled countries ranges from 0.34 (minimum value) to 0.79 (maximum value). This indicates that some of the countries are actually having a higher welfare whereas others are lagging behind. Also, the values from the financial inclusion index show that, on the average, there is poor financial inclusion in the sub region which needs urgent attention. The mean value for financial inclusion is 0.19 and the maximum and minimum values are 0.74 and 0.04, respectively. Income, education and unemployment also have average values of 1,044,762, 5.16 and 6.75, respectively.
Table 1. Summary of descriptive statistics
4.2. Regression results
The results emanating from the estimation of EquationEquation (2)(2)
(2) are reported in Table .
Table 2. Estimated results
With regard to the variable of interest—financial inclusion, the results reveal that it has a positive and significant effect on welfare which is consistent with the a priori expectation. Specifically, the coefficient indicates that a 1% increase in the level of financial inclusion will lead to 0.13% increase in welfare at 1% significance level. This therefore implies that improving financial inclusion has the tendency of enhancing welfare within the sub-region. The finding further implies that an increase in financial inclusion indicators such as the number of commercial bank branches per 100,000 adults and the number of ATMs per 100,000 adults will improve the welfare of the individual. Therefore, greater financial inclusion in the sub-region is very important. Theoretically, this result is consistent with Sarma and Pais (Citation2011) who opine that greater financial inclusion has the possibility of enhancing welfare of individuals. Again, the present outcome confirms similar empirical findings by Tita and Aziakpono (Citation2017) and Zhang (Citation2017).
Further, the results indicate that there is a positive relationship between education and welfare. At 1% level of significance, the coefficient of education variable shows that a 1% increase in years of schooling is associated with 0.22% rise in welfare. This means that increasing the average years of schooling improves human capital and subsequently productivity which in turn enable individuals to earn higher wages. With higher wages, individuals are able to increase their consumption of goods and services and therefore experience improvement in welfare all other things being equal. This finding supports the result obtained by Amendola et al. (Citation2016).
With regard to income and welfare, the study reveals a positive relationship. This means that increase in national income has the potential of enhancing welfare of citizens. Specifically, the study shows that a 1% increase in national income improves welfare by 0.01%, at 5% significance level. Zhang (Citation2017) have reported similar finding for China. Finally, the results reveal that the effect of unemployment on welfare is insignificant—indicating that unemployment has not explained welfare state in the sub-region considering the present data used for the analysis. Although, theoretically, unemployment is expected to reduce welfare, the case for sub-Saharan Africa has been different plausibly because of the extended family system which serves as social security (Owusu & Baidoo, Citation2020) in situations such as loss of job among others. This finding of the study appears to align with the assertion by Andolfatto and Gomme (Citation1998) that elimination of unemployment will not necessarily improve welfare. Likewise, high unemployment will not necessarily deteriorate welfare. The authors add that, the effect of reducing unemployment on welfare is sometimes dependent on changes in economic and social circumstances.
4.3. Diagnostic tests
As mentioned earlier, the reliability and validity of the results is dependent on the assumption that the estimation is free from any econometric problem. To this end, the various diagnostic test results are reported in Table . The results show that none of the econometric problems is an issue in the present study as all the probability values are greater than 0.05, indicating the non-rejection of the null hypothesis. Again, the plots of cumulative sum (CUSUM) and cumulative sum of squares (CUSUMSQ) (see: in the Appendix) indicate that the estimated model is stable. Given these, it can be concluded that the estimated results are consistent, efficient and reliable and for that matter good for policy purposes.
Table 3. Diagnostic test results
4.4. Level of financial inclusion among the selected countries
The level of financial inclusion among the 33 selected sub-Saharan African countries are ascertained using EquationEquation (4)(4)
(4) and the results are reported in Table . The countries are arranged according to their financial inclusion index (FINDEX) value obtained from the estimation.
Table 4. Level of financial inclusion among the selected countries
Following the financial inclusion index obtained, countries with an index values of between 0 and 0.3 (0 ≤ FINDEX <0.3) are considered as low financial inclusion economies. Also, countries with index values of between 0.3 (inclusive) and 0.5 (0.3≤ FINDEX <0.5) are considered as medium financial inclusion economies and countries with index values of between 0.5 and 1 (all inclusive) (0.5 ≤ FINDEX≤ 1) are considered as high financial inclusion economies. Given this, the ensuing discussion is done by grouping the countries according to their respective category.
Based on the three-dimensional financial inclusion index computed for the 33 sub-Saharan African countries, Cape Verde ranks highest with an index value of 0.737 followed by Mauritius and Namibia with index values of 0.704 and 0.597, respectively. These three countries in the sub-region are the only countries that belong to the high financial inclusion category (financial inclusion index value of 0.5 or more).
For the medium financial inclusion economies, only Sao Tomé and Príncipe falls within this category with index value of 0.363. It is worrying to notice that, among the 33 countries, 29 countries which include Botswana, Nigeria, Ghana, Togo, Zimbabwe, Senegal, Côte d’Ivoire, Burkina Faso, Mauritania, Gabon, Benin, Zambia, Mali, Congo Republic, Uganda, Equatorial Guinea, Tanzania, Malawi, Ethiopia, Guinea-Bissau, Cameroon, Madagascar, Sierra Leone, Niger, Guinea, Burundi, Central African Republic, Chad and Congo, Dem. Republic fall within the low financial inclusion category with index value of less than 0.3.
The four countries who fall within the high and medium financial inclusion categories can be primarily attributed to a high number of branches/ATMs networks and high credit plus deposits in such economies. The opposite is also true for countries that fall within the low financial inclusion category.
5. Concluding remarks
This study has estimated the effect of financial inclusion on welfare for 33 sub-Saharan African countries. The level of financial inclusion among these countries is also investigated. The study uses cross-sectional data on these countries for the year 2017. By way of estimation, the study employs the ordinary least squares technique. In ensuring that the results obtained are not spurious—consistent and reliable for effective policy purposes, several diagnostic tests are conducted on the estimated model.
The results from the study reveal that there is a positive relationship between financial inclusion and welfare for the selected countries. The study further indicates that income and education also have positive effect on welfare. With regard to the level of financial inclusion, the study shows that out of the sampled 33 countries, it is only Cape Verde, Mauritius and Namibia who have high financial inclusion based on the estimated financial inclusion index. Sao Tome and Principe is also categorized as a country with medium financial inclusion. The remaining 29 countries have low financial inclusion which is very worrying and needs urgent attention. Based on the results, it is concluded that greater financial inclusion improves welfare in sub-Saharan Africa. It is further concluded that generally, the financial inclusion in the sub-region is low.
The findings from the study have good policy implication for various governments, policymakers, stakeholders in the financial industry and other development organizations and agencies such as the World Bank, African Development Bank and United Nations Development Programme. Based on the positive relationship between financial inclusion and welfare, it is incumbent on stakeholders in the financial industry to ensure credit availability and expansion of ATM facilities among others to enhance greater financial inclusion within the sub-region. This notwithstanding, stringent measures should be put in place to ensure that credit given out to prospective borrowers are recovered in order not to aggravate the incidence of loan default and high non-performing loans. This is so because, loan default and high non-performing loans have the tendency of rendering the financial institutions insolvent and ultimately leading to banks failures which will further worsen the welfare of individuals. Also, the presence of widespread mobile coverage and access to smart phones advocates that the increasing number of financially excluded individuals could potentially access financial services electronically. Given this, continuous efforts to make ICT infrastructure effective, reliable and safe could therefore, go a long way towards promoting financial inclusion in the sub-region. With this, the World Bank and African Development Bank could technically and financially assist the various financial institutions within the region to properly adapt and adopt these electronic ways of making financial services accessible and affordable to everyone. This is also likely to improve the level of financial inclusion in the region and hence, welfare will be improved. In all, as attempts are made to increase access to financial services within the sub-region, managers of financial institutions should also pay attention to overhead costs to ensure that profits of the financial institutions are not affected negatively.
Additional information
Funding
Notes on contributors
Grace Ofori-Abebrese
Grace Ofori-Abebrese is a senior lecturer at the Department of Economics, Kwame Nkrumah University of Science and Technology (KNUST), Kumasi. She has been teaching for over eleven years and she is currently the head of the department. Her research interest is in economic policy issues, finance and monetary issues. Prior to her position at the KNUST, she was a research officer at the Governance Division of the African Development Bank in Abidjan.
Samuel Tawiah Baidoo
Samuel Tawiah Baidoo holds Master of Philosophy in Economics and he is currently a PhD candidate at the Department of Economics, Kwame Nkrumah University of Science and Technology (KNUST), Kumasi. His research interests include microeconomics, monetary economics, international economics, public economics and economic policy analysis.
Ebenezer Essiam
Ebenezer Essiam is currently a graduate student at the Department of Economics, Kwame Nkrumah University of Science and Technology (KNUST), Kumasi-Ghana.
References
- Addury, M. M. (2019). Impact of financial inclusion for welfare: Analyze to household level. Journal of Finance and Islamic Banking, 1(2), 90–15. https://doi.org/10.22515/jfib.v1i2.1450
- AfDB. (2012). Briefing notes for AfDB long term strategy. Briefing note 5: Income inequality in Africa. African Development Bank Group. https://www.afdb.org/fileadmin/uploads/afdb/Documents/Policy-Documents/FINAL%20Briefing%20Note%205%20Income%20Inequality%20in%20Africa.pdf
- AfDB. (2013). Financial inclusion in Africa. In T. Triki & I. Faye Eds., Financial inclusion in Africa, 1–146. African Development Bank Group. http://www.afdb.org/Financial_Inclusion_in_Africa.pdf
- Amendola, A., Boccia, M., Mele, G., & Sensini, L. (2016). Financial access and household welfare: Evidence from Mauritania. The World Bank. https://www.mfw4a.org/sites/default/files/resources/Financial_Access_and_Household_Welfare_Evidence_from_Mauritania.pdf
- Andolfatto, D., & Gomme, P. (1998). Unemployment and economic welfare. Economic Review-Federal Reserve Bank of Cleveland, 34, 25–33. https://fraser.stlouisfed.org/files/docs/publications/frbclevreview/rev_frbclev_1998q3.pdf#page=27
- Attanasio, O., Augsburg, B., De Haas, R., Fitzsimons, E., & Harmgart, H. (2015). The impacts of microfinance: Evidence from joint-liability lending in Mongolia. American Economic Journal. Applied Economics, 7(1), 90–122.
- Baidoo, S. T., & Akoto, L. (2019). Does trust in financial institutions drive formal saving? Empirical evidence from Ghana. International Social Science Journal, 69(231), 63–78.
- Baidoo, S. T., Sakyi, D., & Aidoo, J. B. (2020). Does gender matter in credit denial among small and medium scale enterprises in Ghana? International Journal of Entrepreneurship and Small Business, 39(3), 339–362. https://doi.org/10.1504/IJESB.2020.104980
- Banerjee, A. V., & Newman, A. F. (1993). Occupational choice and the process of development. Journal of Political Economy, 101(2), 274–298.
- Bauchet, J., Marshall, C., Starita, L., Thomas, J., & Yalouris, A. (2011). Latest findings from randomized evaluations of microfinance. World Bank. http://www.microempowering.org/resources/FORUM2.pdf
- Beck, T., & Demirgüç-Kunt, A. (2008). Access to finance: An unfinished agenda. The World Bank Economic Review, 22(3), 383–396. https://doi.org/10.1093/wber/lhn021
- Bruhn, M., & Love, I. (2014). The real impact of improved access to finance: Evidence from Mexico. The Journal of Finance, 69(3), 1347–1376. https://doi.org/10.1111/jofi.12091
- Chibba, M. (2009). Financial inclusion, poverty reduction and the millennium development goals. The European Journal of Development Research, 21(2), 213–230. https://doi.org/10.1057/ejdr.2008.17
- Clarke, G. R., Xu, L. C., & Zou, H. F. (2006). Finance and income inequality: What do the data tell us? Southern Economic Journal, 1(1), 578–596. https://doi.org/10.2307/20111834
- Demirguc-Kunt, A., & Klapper, L. (2012b). Measuring financial inclusion: The global findex database. The World Bank.
- Demirgüç-Kunt, A., & Klapper, L. (2012a). Financial inclusion in Africa: An overview. The World Bank.
- Devarajan, S., & Fengler, W. (2013). Africa’s economic boom: Why the pessimists and the optimists are both right. Foreign Affairs, 92(1), 68–80.
- Efobi, U., Beecroft, I., & Osabuohien, E. (2014). Access to and use of bank services in Nigeria: Micro-econometric evidence. Review of Development Finance, 4(2), 104–114. https://doi.org/10.1016/j.rdf.2014.05.002
- Ehrbeck, T., Lochan, R., Sinha, S., Tahliyani, N., & Zainulbhai, A. (2010). Inclusive growth and financial security: The benefits of e-payments to Indian society. McKinsey & Company.
- Fadun, S. O. (2014). Financial inclusion, tool for poverty alleviation and income redistribution in developing countries: Evidences from Nigeria. Academic Research International, 5(3), 137–146.
- Galor, O., & Zeira, J. (1993). Income distribution and macroeconomics. The Review of Economic Studies, 60(1), 35–52. https://doi.org/10.2307/2297811
- Greenwood, J., & Jovanovic, B. (1990). Financial development, growth, and the distribution of income. Journal of Political Economy, 98(5,Part 1), 1076–1107. https://doi.org/10.1086/261720
- Hawkins, P. (2011). Financial access: What has the crisis changed? BIS Papers, 56(9), 11–20.
- Ibrahim, A. U., & Olasunkanmi, A. F. (2019). Financial inclusion: Prospects and challenges in the Nigerian Banking Sector. European Journal of Business and Management, 11(29), 40–47.
- Jalilian, H., & Kirkpatrick, C. (2005). Does financial development contribute to poverty reduction? Journal of Development Studies, 41(4), 636–656. https://doi.org/10.1080/00220380500092754
- Jones, P. A. (2008). From tackling poverty to achieving financial inclusion - The changing role of British credit unions in low income communities. The Journal of Socio-economics, 37(6), 2141–2154. https://doi.org/10.1016/j.socec.2007.12.001
- Mallick, D., & Zhang, Q. (2019). The effect of financial inclusion on household welfare in China. MPRA Paper No. 95786. https://mpra.ub.uni-muenchen.de/95786/
- Nanziri, E. L. (2016). Financial inclusion and welfare in South Africa: Is there a gender gap? Journal of African Development, 18(2), 109–134.
- Oteng-Abayie, E. F. (2017). Technical efficiency and total factor productivity of rural banks in Ghana. Cogent Economics & Finance, 5(1), 1366088. https://doi.org/10.1080/23322039.2017.1366088
- Owusu, S., & Baidoo, S. T. (2020). Providing a safety net for the vulnerable persons in Ghana: Does the extended family matter? International Journal of Social Welfare, 1–8. https://doi.org/10.1111/ijsw.12446
- Park, C. Y., & Mercado, R. (2015). Financial inclusion, poverty, and income inequality in developing Asia. Asian Development Bank Economics Working Paper Series, 426. Asian Development Bank.
- Pitt, M. M., & Khandker, S. R. (1998). The impact of group-based credit programs on poor households in Bangladesh: Does the gender of participants matter? Journal of Political Economy, 106(5), 958–996. https://doi.org/10.1086/250037
- Radcliffe, D., & Voorhies, R. (2012). A digital pathway to financial inclusion. http://responsiblefinanceforum.org/wp-content/uploads/Pathway_Financial_Inclusion.pdf
- Sakyi, D., Bonuedi, I., & Opoku, E. E. O. (2018). Trade facilitation and social welfare in Africa. Journal of African Trade, 5(1–2), 35–53. https://doi.org/10.1016/j.joat.2018.08.001
- Sakyi, D., Onyinah, P. O., Baidoo, S. T., & Ayesu, E. K. (2019). Empirical determinants of saving habits among commercial drivers in Ghana. Journal of African Business, 1–20. https://doi.org/10.1080/15228916.2019.1695188
- Sarma, M. (2008). Index of financial inclusion. Working paper, Centre for International Trade and Development at Jawaharlal Nehru University, (No. 215). Jawaharlal Nehru University.
- Sarma, M., & Pais, J. (2011). Financial inclusion and development. Journal of International Development, 23(5), 613–628. https://doi.org/10.1002/jid.1698
- Tita, A. F., & Aziakpono, M. J. (2017). The effect of financial inclusion on welfare in sub-Saharan Africa: Evidence from disaggregated data. African Review of Economic and Finance, 9(2), 30–65.
- World Bank. (2012). World development indicators.
- World Bank. (2013). Global financial development report.
- World Bank. (2014a). Global financial development report.
- World Bank. (2014b). PovcalNet: Poverty and equity data.
- Zhang, Q. (2017). Does microfinance reduce poverty? Some international evidence. The BE Journal of Macroeconomics, 17(2), 1–13.
Appendix
Table A1.List of 33 selected sub-Saharan African countries
Figure A1. Plot of CUSUM and CUSUMSQ