
 ?Mathematical formulae have been encoded as MathML and are displayed in this HTML version using MathJax in order to improve their display. Uncheck the box to turn MathJax off. This feature requires Javascript. Click on a formula to zoom.
Abstract
This research examines the impact of positive and negative shocks of exchange rate on South Asian Stock indexes by employing a Non-linear Panel autoregressive distributive lag model along with a Panel Asymmetric granger casualty test. For the Panel-NARDL model, the Pre-crisis regime comprises of 289 observations from 1st January 2000 to 1st January 2008, the post-crisis regime consists of 547 observations from 1st January 2009 to May 2020 and the whole sample is constituted upon 960 observations from 1st January 2000 to May 2020. Pesaran’s 2007 cross-sectional augmented IPS unit root test is also applied after estimating Pesaran’s 2004 CD test. Findings indicated that the linear panel-based ARDL model failed to establish long-term cointegration between exchange rate fluctuation and stock indexes before the global financial crisis and when the overall sample period is selected. However, the asymmetrical panel-based ARDL model established a non-linear long-term association between exchange rate fluctuation and stock indexes in three regimes. Moreover in long run, when the whole sample is selected, investors reacted to only positive shocks to exchange rate and did not react to negative shocks. However, in the short run investors reacted equally to both positive and negative shocks to exchange rates. In pre-crisis and post-crisis regimes, stock indexes are only inversely related to positive shocks to exchange rate fluctuations and investors did not react to negative fluctuations in the exchange rate. However, in the short run and before the global financial crisis, investors reacted to only positive shocks to exchange rate but in the short run and after the crisis, investors did not react to positive shocks. The significance of this research is two-fold: Firstly, we have examined the reaction of investors to both positive and negative shocks to exchange rate fluctuations under three different regimes. Secondly, we have shown that non-linear panel-based modelling is more effectual in estimating asymmetrical linkages between exchange rate fluctuation and stock indexes.
PUBLIC INTEREST STATEMENT
This research article has examined the symmetrical and asymmetrical linkages between exchange rate fluctuations and stock indexes of Pakistan, India, Bangladesh and Sri-Lanka by utilizing linear panel ARDL and NARDL modelling and asymmetrical granger causality analysis. Data period is divided into three different types of time frames such as before the global financial crisis, after the crisis, and when the whole sample period is selected. Results have shown that symmetrical panel-based ARDL models failed to establish a long-term linear co-integrating association between exchange rate fluctuations and stock indexes when the whole sample period is selected and for regime before the crisis. However, the asymmetrical panel-based NARDL model established asymmetrical co-integration between positive and negative shocks to exchange rate fluctuations and stock indexes.
1. Introduction
The 2008 Financial downturn in the South Asian economies mostly impacted Indian and Sri-Lankan economic development (Asad & Farooq, Citation2009; Carrasco et al., Citation2010). In 2010, a working paper series published by the Asian development bank stated that within these economies, capital markets have begun to streamline and a portion of the money supply has returned. However, the magnitude of the regeneration arising from reserve bank interventions can not be calculated. Although by 2010, South Asia’s economic growth is well below average, the production gap is lower for India and Sri-Lanka as compared to other economies of the South Asian region (Carrasco et al., Citation2010). The economic crunch of 2008 has recently created serious economic disruptions for South Asian economic development (Raj, Citation2014) and contributed significant inflationary pressures on the economy of the whole region (Filardo, Citation2011). With the disastrous impact of governmental employees’ payroll disruptions on the services industry and declining agricultural growth of India as a consequence of water shortages, economic development in India in the last three months of 2009 depreciated to 6%. The global financial crisis has not only stimulated disruptions in Asian economies (Keat, Citation2010; Raj, Citation2014; World Bank feature Story, Citation2010) but also affected the South Asian economy (Athukorala & Chongvilaivan, Citation2010) and this has motivated us to study the asymmetrical impact of exchange rate fluctuations on stock indexes of selected economies of the South Asian region by utilizing non-linear Panel ARDL modelling.
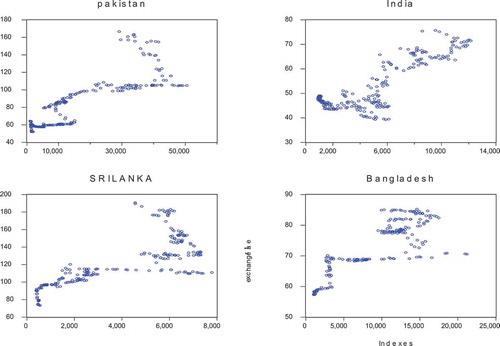
Figure shows that the global financial crisis has affected stock indexes of Pakistan, India, Sri-Lanka and Bangladesh. Figure confims that the relationship between fluctuations in currency values and stock indexes is non-linear or asymmetrical in nature.
Figure 1. Exchange rate and stock indexes of Pakistan, Bangladesh, India and Sri-Lanka
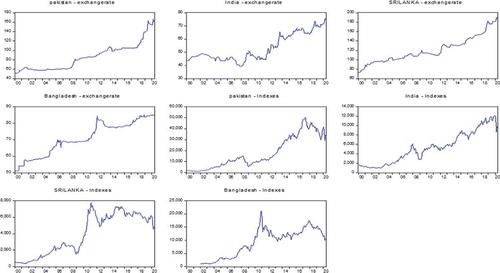
Figure shows that the global economic crunch has stimulated depreciating trend in the stock indexes of Pakistan, Bangladesh, Sri Lanka and India and the indexes of corresponding economies moved in a downward direction during the economic crisis of 2008. However, the exchange rate moved in opposite (upwards) direction during 2008. This furthermore motivates the researchers to investigates the asymmetrical influence of fluctuations in currency values on stock indexes for three different time frames such as pre-economic crisis regime, post-crisis and when the whole sample period is selected.
Figure 2. Scatter-plot diagram for correlations between exchange rate and stock indexes
The purpose of this research article is to examine asymmetrical linkages between exchange rate fluctuations on stock indexes of selected four South Asian economies such as Pakistan, India, Bangladesh, and Sri Lanka. Panel NARDL model is utilized to investigate the asymmetries between exchange rate fluctuations and stock indexes for four selected economies because Panel NARDL model is having the capacity to disintegrate exchange rate into positive and negative shocks for examining the nonlinear impact of exchange rate fluctuations on stock indexes of selected four countries: India, Pakistan, Bangladesh and Sri-Lanka. Panel NARDL model is useful for exploring the asymmetries between exchange rate and stock indexes for selected South Asian economies as a whole. This research article fills the following important research gaps that remain uncharted in existing researches.
Firstly, most of the research article on the exchange rate-stock index nexus have explored symmetrical linkages between both underlying variables (Adjasi et al., Citation2011; Akbar et al., Citation2019; Delgado, & Saucedo, Citation2018; Hussain, Citation2019; Keswani & Wadhwa, Citation2018; Mosab et al., Citation2020; Muhammad & Gang, Citation2015; Tripathi & Seth, Citation2014; Roubaud & Arouri, Citation2018; Sheikh et al., Citation2020; Shiva & Sethi, Citation2015; Simbolon & Purwanto, Citation2018; Singhal et al., Citation2019; Sultana & Reddy, Citation2017; You et al., Citation2017) and limited efforts have been made to investigate the influence of +ve and -ve shocks to exchange rate fluctuations on stock indexes.
Secondly and importantly, most research articles have either utilized symmetrical or linear econometric modelling or asymmetrical econometric modelling by utilizing time-series data (Areli Bermudez Delgado et al., Citation2018; Chkir et al., Citation2020; Corbet et al., Citation2018; Jung et al., Citation2020; Sikhosana & Aye, Citation2018; Akbar et al., Citation2019; Anisak & Mohamad, Citation2019; Andriansyah & Messinis, Citation2019; Choi et al., Citation2019; Hung, Citation2019; Hussain, Citation2019; Kassouri & Altıntaş, Citation2020; Keswani & Wadhwa, Citation2018; Kumar, Citation2019; Liang et al., Citation2020; Mathur, Citation2018; Nouira et al., Citation2019; Rexford, Citation2019; Roubaud & Arouri, Citation2018; Salvatore, Citation2019; Shakil et al., Citation2018; Singhal et al., Citation2019; Simbolon & Purwanto, Citation2018; Wei et al., Citation2019; Xie et al., Citation2020; Mosab et al., Citation2020; Sheikh, et al., Citation2020; Asad et al., Citation2019). However, to the best of our knowledge, no efforts have been made to utilize the Panel NARDL modelling approach for investigating asymmetrical linkages between exchange rate fluctuations and stock indexes. As this is the first research article which has explored asymmetrical linkages between exchange rate fluctuations and stock indexes by utilizing Panel NARDL modelling approach for three multiple regimes: pre-economic recessionary regime, post-economic recessionary and over the entire sample period).
2. Literature review
This literature review section explains the general impact of the exchange rate on stock indexes and also reported previous research findings on the asymmetrical relationship between exchange rate and stock indexes.
2.1. Exchange rate and stock prices relationship
In the existing literature on the nexus between exchange rate-stock indexes, some researchers have analyzed the asymmetrical impact of exchange rate on the stock index (Sheikh et al., Citation2020), but others have found that stock index variabilities symmetrically impacted exchange rate fluctuations (Asad & Farooq, Citation2009; Muhammad & Gang, Citation2015; Sheikh, et al. Citation2020). Muhammad and Gang (Citation2015) found that stock indexes are an important contributing factor for exchange rate volatility by utilizing restricted vector autoregressive modelling, for example, RMB is appreciated when Chinese stock indexes moved in an upward direction. Moreover, country risk has not been found as an important factor for increasing volatility in the exchange rate; however, the RMB plays a deterministic role in influencing the country’s risk of China. The specific purpose of another research article is to determine that whether macroeconomic fluctuations (including the cost of borrowing, inflationary factors, exchange rate fluctuations, and economic development within a country) affect stock prices positively and the magnitude of impact on stock indexes. Lentina and Purwanto (2018) found that variations in selected macroeconomic variables with the exception of economic development significantly contributed to the volatility of real estate firms listed on the Indonesian stock exchange. Sheikh et al. (Citation2020) have also found that the global financial crisis impacted asymmetrical co-integrating linkages between stock indexes and exchange rates. Mosab et al. (2020) have also utilised time series-based non-linear estimation techniques such as NARDL modelling framework and found a non-linear impact of currency values on Pakistan’s stock indexes.
Kumar (Citation2019) investigated the asymmetric causality between macroeconomic variations such as changes in Indian currency values, oil prices, and Indian stock indexes by employing asymmetric granger causation analysis and time-series NARDL modelling technique. Results reported two-way causation between fluctuations in currency values and oil prices. Furthermore, one-way causation is also identified running from currency fluctuation to stock indexes. When oil prices are exposed to +ve and -ve shocks, there is a positive impact on stock indexes for +ve shocks associated with 1 period lag of oil prices and there exists an indirect association with stock indexes for –ve shocks to 1 period lag of oil prices. Chkir et al. (Citation2020) were interested in investigating the hedging properties of oil prices against currency fluctuations and found that oil price fluctuations serve as a weak hedge against fluctuation in currency values. Furthermore, authors have also estimated the dynamic association between currency valuation, stock indexes, and oil prices of different economies categorized by oil-producing and non-oil-producing countries through employing the VINE copulas method. Results have shown that there is negative but significant dependence between currency fluctuations and oil prices. Mexico is famous for the exploration of oil and gold and is also importing petroleum goods (Singhal et al., Citation2019). Singhal et al. (Citation2019) investigated the dynamism between selected macroeconomic fluctuations and stock indexes through the utilization of symmetrical co-integrating techniques covering the time span from 2006 to 2018. Findings suggested a direct symmetrical influence of gold prices on stock indexes. Stock indexes are also affected by sentiments of investors and according to the arbitrage pricing theory, there must be a symmetrical or linear linkage between macroeconomic and stock index fluctuations (Akbar et al., Citation2019). Akbar et al. (Citation2019) investigated the complex dynamism between selected macroeconomic factors and stock indexes by utilizing unrestricted VAR and Bayesian VAR modelling using data from 2001 to 2014. After testing the seasonality effect within data, followed by certain symmetrical co-integration approaches, authors have found a direct dynamic association between exchange rate fluctuation and stock indexes. Furthermore, stock indexes and exchange rate variability are having a depreciating trend during inflationary pressures.
Delgado et al. (Citation2018) examined the dynamic inter-relationship between macroeconomic fluctuation and stock indexes in the Mexican context through utilizing restricted VAR covering the period from 1992 to 2017. Findings suggested contributing impact of exchange rate on stock indexes. Yang (Citation2017) was interested in exploring the dynamic association between stock indexes and the exchange rate and the role of monetary policy interventions on the variables. Findings have shown that exchange rate fluctuations symmetrically and instantly impact stock indexes by employing restricted structural vector autoregression using time-series data from 1999 to 2016. In another relevant research article, Roubaud and Arouri (Citation2018) investigated the dynamic interrelationship between currency fluctuation and stock indexes by utilizing multiple switching VAR models. Authors have found significant dynamic association across all variables, the existence of a dynamic but asymmetrical association between variables and variant relational associations between macroeconomic variables-stock indexes are identified for different regimes (Roubaud & Arouri, Citation2018). Adjasi et al. (Citation2011) investigated the symmetrical associations between stock prices and exchange rate variability in selected African economies. Park and Shin (Citation2020) observed that limited research articles in existing literature emphasize on the relationship between exchange rate variations and stock indexes in wake of the global economic crisis 2008. Building upon this significant research gap, the authors have found asymmetrical associations between exchange rate volatility and stock indexes for individual member countries of the MENA region by utilizing VECH-GARCH modelling and VECM approach. However, Park and Shin (Citation2020) have not utilized the nonlinear panel autoregressive distributive lag modelling technique (NPARDL) in order to find out the asymmetrical association between exchange rate fluctuation and South Asian stock indexes but only found strong perseverance in the unpredictability of currency values during the crisis and before crisis period. Sheikh, Chaudhry and Mukhtar (Citation2018) confirmed that panel data modelling is more efficient in examining the association between financial and non-financial variables and Asian automotive stock indexes.
Financial derivatives were mostly incorporated in conformity with the appropriate assurance of risk mitigation and, consequently, the fluctuation of the underlying spot market. The same is predicted for derivatives of interest rates since these instruments are believed to provide long-term stability in the rate of interests and therefore stock indexes (Nandy & Chattopadhyay, Citation2014). Volatility in stock indexes is not generated just because of certain macroeconomic determinants but these variabilities are also arising due to firms’ micro-level financial determinants such as financial ratios of firms. Sultana and Reddy (Citation2017) determined the role of financial and non-financial determinants of Indian firms in causing stock index volatility and found that macroeconomic factors such as exchange rate, interest rate, etc. and non-macroeconomic variables contributed to stock returns volatility for Indian firms. Macroeconomic variables played an important role in contributing to a nation’s economy regardless of whether the nations are underdeveloped, developed, or emerging. Keswani and Wadhwa (Citation2018) investigated that changes in selected macroeconomic variables including fluctuations in currency, cost of borrowing, inflationary pressures can influence the stock price volatility of the Indian economy through employing advanced cointegration techniques and utilizing time-series data from 2006 to 2016. Hung (Citation2019) investigated the stock indexes and exchange rate volatility transmission between selected countries of the European region through utilizing time-series data from 2000 to 2017 and employed DCC and CCC (GARCH) modelling. Authors have furthermore segregated the data into multiple periods such as regime before the global economic crunch of 2008 and after the global economic crisis regime. Results have indicated that there is 2-way volatility transmission between exchange rates and stock indexes for three economies of Europe: Hungary, Czech Republic, and Croatia. However, results also indicated that there is only one-way volatility transmission between both financial markets for Hungary after the global financial crisis regime and for Romania before the crisis regime.
3. Data collection and selection of variables
The purpose of this research is to explore asymmetries between exchange rate fluctuation and stock indexes of four selected South Asian economies such as Pakistan, India, Bangladesh, and Sri-Lanka. In order to explore asymmetrical linkages between exchange rate fluctuations and stock indexes of four selected economies as a whole, non-linear Panel data modelling is utilized. The pre-crisis regime for cross-sectional time-series data consist of 289 observations covering the period from January 2000 to January 2008, the post-crisis regime is constituted upon 547 observations from January 2009 to January 2020 and the whole sample period is comprised upon 960 observations as a whole for all four countries covering the period from January 2000 to May 2020. The purpose of Panel NARDL modelling is to estimate the non-linear co-integrating association between positive and negative shocks to exchange rate and stock indexes for shorter and longer horizons. Data on exchange rate fluctuations have been collected from the CIEC data repository, investing.com, and tradingeconomics.com covering the time span from January 2000 to May 2020. Stock indexes of India, Pakistan, Bangladesh, and Sri Lanka has been collected from stock exchange websites of selected countries such as Pakistan stock exchange (KSE-100 indexes), Indian stock exchange (NIFTY-50), Bangladesh stock exchange (Chittagong Stock indexes top 30), and Sri-Lankan stock exchange (CSE-All shares). The sample period is divided into three-time frames such as pre-crisis regime for the period before the global financial crisis, the post-crisis regime is for the period after the crisis and the whole sample period is selected to find out the impact of positive and negative shocks to exchange rate fluctuations on stock indexes of four countries as a whole.
4. Research methodology
This section explains the econometric procedure of estimating non-linear Panel A.R.D.L modelling for the asymmetrical impact of exchange rate fluctuations on stock indexes of selected South Asian economies as a whole.
4.1. Panel non-linear ARDL modelling
Panel non-linear and linear ARDL model can be estimated if none of the variables is becoming stationary at 2nd differencing; therefore, for estimation of Panel NARDL model, it is important that variables should be integrated at same order, e.g. regressors and regressand are displaying seasonality trends at level but converted into stationary after taking first differencing (Pesaran et al., Citation2001; Shin et al., Citation2014). It is still possible to estimate Panel-based NARDL model when certain variables are displaying non-stationarity trends at level but others are stationary at level. This means that some of variables are non-stationary at level but others are stationary, e.g. assortment of I (0) and I (1) (Shin et al., Citation2014). First step towards the estimation of Panel NARDL model is to find out the cross-sectional dependence in data, in case of cross-sectional dependence, first-generation unit root test will are no longer reliable (e.g. LLC by (Levin et al., Citation2002), Fisher Type Pane unit root test by (Choi, Citation2001) and Hadri Langrage Multiplier (LM) panel unit root test by (Hadri, Citation2000) and it has become important to estimate seasonality trends through cross-sectional augmented IPS Panel unit root test developed by Pesaran in 2007 also known as 2nd-generation Panel unit root testing approach (Pesaran, Citation2007).
Cross-sectional augmented IPS Panel unit root formula can be written in following manners,
Cross-sectional dependence test is estimated through the CD test of (Pesaran, Citation2004)Footnote1
N = No. of South Asian economies within Panel data set, T = Number of observations with respect to the variable under observation, = pairwise correlation of residuals. Table contains estimations from the CD test of (Pesaran, 2004). As stated above, the Panel NARDL model can be estimated when none of either regressor or regressand is I (2). Pesran’s CD test and Cross-sectional augmented IPS Panel unit root test confirms cross-sectional dependency and seasonality effects within the data sets respectfully.
Table 1. Pesaran’s 2004 Cross-sectional dependency test
Next step is to estimate the Panel ARDL model and Panel NARDL model in order to reconnoiter that either the connotation between currency values fluctuation and South Asian stock indexes is actually linearly related or non-linearly related. Error correction term of Panel ARDL model can be written in subsequent manner,
EquationEquation 1b1b
1b shows Panel ARDL model specification,
In Equationequation 1a1a
1a , stock indexes of South Asian selected economies are taken as dependent variable and fluctuation in the exchange rate is taken as a regressor in order to investigate asymmetrical linkages between both.
denotes long-run equilibrium in linear panel ARDL model. The particular lag length can be selected on basis of Akaike information criterion (AIC), Schwarz information criterion (SIC) and Bayesian information criterion (BIC). Moreover, p and q are lag orders of corresponding regressand and regressors respectively. Long-run coefficient for both regressand and regressors are represented by a and b, whereas short-run coefficients for stock indexes and exchange rate fluctuations are represented by
and
correspondingly.
According to Equationequation 1a1a
1a , If ECT value is negative and significant this means that there is long-run co-integrating association between fluctuations in stock indexes of selected economies of the South Asian region and exchange rate variability. EquationEquation 1a
1a
1a and Equation1b
1b
1b estimated symmetrical panel ARDL model for investigating symmetrical linkages between exchange rate fluctuations and stock indexes, however, according to Figure , it is purposed that actual relationship between underlying variables is non-linear in nature. We also estimate both Panel NARDL and ARDL for exploring that either actual relationship between South Asian stock indexes is linear or non-linear in nature. Non-linear Panel NARDL model can be represented as,
EquationEquation 2b2b
2b represented non-linear Panel-based ECT model incorporated in this study,
EquationEquation 2a2a
2a and Equation2b
2b
2b shows that stock indexes and exchange rate fluctuations are decomposed into their respective positive and negative shocks according to method purposed by (Shin et al., Citation2014). Exchange rate fluctuations and stock indexes are disintegrated into positive and negative signs in the following ways:
According to Equationequation 2a2a
2a and Equation2b
2b
2b , stock indexes and exchange rate fluctuations are decomposed into positive and negative signs in order to investigate asymmetrical linkages between +ve and - ve shocks to currency value fluctuations (
and
) and stock indexes of four selected economies of South Asian region as a whole. Non-linear ARDL model by (Shin et al., Citation2014) is extension of linear ARDL model purposed by (Pesaran et al., Citation1999). Asymmetrical linkages between positive and negative shocks to exchange rate and stock indexes is investigated through utilizing Wald test statistics, if
and
are not equal then we can conclude asymmetric impact of positive and negative shocks to exchange rate on stock indexes, However short run asymmetric impact is analyzed through utilizing Wald test statistics for
and
, there exist short run asymmetric impact of positive and negative shock to exchange if
is not equal to
. In case of Panel NARDL modelling approach, nonlinear long run relationship between positive and negative shock to exchange rate is determined on basis of significant and negative values of
, these values determine that there exist asymmetrical long run co-integrating impact of exchange rate fluctuations on the stock indexes.
4.2. Hatemi-J asymmetrical granger causality for panel data
Asymmetrical granger causality test by (Hatemi-J, Citation2012) is also utilized in order to investigate that whether positive and negative fluctuations in currency values are asymmetrically granger causing South Asian stock indexes in three regimes. Hatemi-J in 2012 developed asymmetrical granger causality test by extending the work of (Granger & Yoon, Citation2002) and furthermore stated that asymmetrical granger causality is different from symmetrical granger causation in such a way that positive and negative shocks to dependent and independent variables may have a different impact on each other. Let consider that we are interested in investigating panel-based granger causation between. In below Equationequation 1
1
1 and Equation2
2
2 ,
and
are identified as white noise error terms,
Both positive and negative shocks to and can be classified as
= max (
,0),
= min (
,0)
= max (
,0),
= min (
,0)
and hence can be written as
and
can be written as
consequently Equationequation 11
1 can be rewritten as
and Equationequation 22
2 can be redefined as
According to (Hatemi-J, Citation2012) positive and negative shocks to and
can be defined as
In this research article, our goal is to investigate the impact of positive and negative shocks to exchange rate fluctuations on stock indexes; therefore, by focusing only on positive shocks associated with a variable, we have and
and both are equal to
and
, granger causation can be implemented under particular VAR environment by utilizing VAR-SUR(k) model,
When both variables are disintegrated into negative shocks,
When one is positive and other is negative,
When one is negative and other is positive,
Equation 4a to 4d can be utilized to find out the asymmetrical causality between exchange rate and stock indexes; however, this research article utilized asymmetrical granger causality to find out that either positive and negative shocks to exchange rate are granger causing stock indexes or not in three different regimes such as pre-crisis, post-crisis and when the whole sample is selected.
5. Panel NARDL modelling results
Result section deals with non-linear Panel NARDL modelling approach for investigating the asymmetrical impact of exchange rate fluctuations on stock indexes of selected countries of South Asian region (Pakistan, India, Bangladesh and Sri-Lanka) as a whole.
5.1. Panel NARDL estimation results
Table explains the descriptive statistics of stock indexes and exchange rate fluctuations of selected economies of South Asian regions like Pakistan, India, Sri-Lanka and Bangladesh. The standard deviation of selected South Asian economy’s stock indexes and exchange rate fluctuations is greater in the post-crisis regime as compared to the pre-crisis regime and when the whole sample period is selected. Moreover, skewness for exchange rate fluctuations and South Asian selected country’s stock indexes are higher when the whole sample period is selected. However, skewness for stock indexes and the exchange rate is higher for the pre-crisis regime as compared to post-crisis regime. Higher positive skewness values depict the largest right tails and higher values for stock indexes and exchange rate fluctuations against US dollars (depreciation of local currency). This further strengthens our motivation to study asymmetries between the exchange rate and stock indexes of selected South Asian countries. Higher SD values of stock indexes in the post-crisis regime mean that higher incidence of volatility in stock indexes and observations more often deviate from their average mean values. Table shows cross-sectional dependence for South Asian stock indexes and exchange rate in three different regimes.
Table 2. Descriptive Statistics for Panel data
Table confirms cross-sectional dependency for stock indexes and an exchange rate of selected economies of South Asian countries, this confirms that cross-sectional augmented IPS unit root test developed by (Pesaran, Citation2007) is more appropriate for detecting seasonality in cross-sectional time-series data. Pesaran’s 2004 cross-sectional dependence test confirms that panel data are cross-sectional dependent, this can be furthermore confirmed from the variance of coefficient (VOC) calculated from Table
Table reports that the coefficient of variance for stock indexes is higher in the pre-crisis regime as compared to post-crisis regime which means the existence of heterogeneity within the panel data sets. However, the coefficient of variation for exchange rate fluctuations is higher in the pre-crisis regime than post-crisis regime. In the case of cross-sectional dependence within panel data sets, Pesaran’s 2007 CIPS unit is more appropriate (Kouton, Citation2019). Vastly heterogeneity within panel data sets is generally because of invariant volatilities in exchange rate fluctuation and stock indexes of four selected economies of the South Asian region.
Table 3. Coefficient of variation (COV)
Table reports that neither stock indexes of selected South Asian economies nor fluctuations in currency values against the US dollar became stationary at 2nd differencing. This shows that Panel NARDL and ARDL model is an appropriate choice for investigating the asymmetrical and symmetrical impact of exchange rate fluctuations on stock indexes of Pakistan, India, Bangladesh and Sri-Lanka. Moreover, Table shows that all variables are integrated in the same order, e.g. stock indexes and exchange rate are having a depiction of seasonality effects at level but after taking the first difference, all have become stationary or there remained no seasonality effects in exchange rates and stock indexes after differencing one time. Following the approach of (Kouton, Citation2019), results of Panel-based ARDL by (Pesaran et al., Citation1999) and NARDL by (Shin et al., Citation2014) for the symmetrical and asymmetrical association between exchange rate and stock indexes are reported in Tables and . Table is divided into three sections and each section explains the symmetrical and asymmetrical impact of exchange rate fluctuation on stock indexes for the whole sample period, before the crisis and after crisis regime for longer horizons. Table is consisted of the symmetrical and asymmetrical association between stock indexes and exchange rates for shorter horizons during the pre-crisis regime, post-crisis regime and when the whole sample is selected.
Table 4. Pesaran’s 2007 cross-sectional Augmented IPS unit root analysis
Table 5. Panel ARDL and Panel NARDL model estimated results for pre-crisis regime, post-crisis regime and when the whole sample is selected for longer horizons
Table 6. Panel ARDL and Panel NARDL model estimated results for pre-crisis regime, post-crisis regime and when the whole sample is selected for shorter horizons
5.1.1. Panel NARDL model estimated results when whole sample period is selected
Table reports the long-term results of the symmetrical panel-based ARDL model and asymmetrical Panel ARDL model for three different types of regimes such as before the crisis, after the crisis, and when the whole sample is selected. The symmetrical Panel ARDL model fails to establish a long-term relationship between exchange rate fluctuation and stock indexes because the linear ECT term is insignificant and non-negative when the whole sample is selected. For the whole sample period, non-linear ECT established asymmetrical linkages between fluctuation in stock indexes and exchange rate for longer horizons. Panel-based NARDL model estimated that investors of selected South Asian economies reacted to only positive shocks to exchange rate fluctuations and did not consider negative shocks to exchange rate fluctuations for longer horizons. For example, an increase in positive shocks to US dollars against local currency value (devaluation in local currency), there is a decrease in stock indexes. This may be due to an increase in international dollar value, producer price appreciates, which may have a negative influence on the overall earnings of the firm and is reflected by stock indexes. This is known as a flow-oriented approach. For the whole sample period and shorter horizons, both symmetrical and asymmetrical panel-based NARDL models showed similar results. In the case of the Panel ARDL model, there is an indirect association between stock indexes and exchange rate fluctuations and the Panel NARDL model showed that investors reacted equally but inversely to +ve and –ve shocks to exchange rate fluctuations, and there existed indirect association for shorter horizons between exchange rate fluctuation and stock indexes. However, the magnitude of investor’s reactions to negative shocks of exchange rate fluctuations is greater as compared to positive shocks to the exchange rate. Negative reactions of investors to positive and negative shocks to exchange rate fluctuations in short term can be explained by a flow-oriented approach. The appreciation of local exchange rates because of depreciating US dollar decreases exporter’s profitability and expenses associated with imported goods, while domestic currency declination against US dollars raises profitability associated with exported goods but expenses allied with imported goods upsurges (Andriansyah & Messinis, Citation2019; Chkir et al., Citation2020; Hung, Citation2019; Xie et al., Citation2020). Further, currency value adjustments also had various implications on the performance of an enterprise’s trade, including potential foreign currency receivables and payable (Bahmani-Oskooee & Saha, Citation2016). Therefore, an increase in local currency valuation against US dollars adversely impacts the export-dominated economy’s stock indexes but such an appreciation is favourable for stock indexes of economies relying on imported goods. For the whole South Asian region in long run and when the whole sample period is selected, only positive shocks to exchange rates negatively impact stock indexes because of the import-oriented economy. However, in the short run and when the whole sample period is selected, investors reacted equally to both appreciation and depreciation in currency values but the magnitude of the impact of currency appreciation on stock indexes is greater as compared to currency depreciation impact. This means that positive and negative fluctuations in appreciation and depreciation of local currency brought different results for South Asian stock indexes, but in the long run, appreciation in local exchange rates is having no impact on stock indexes. In the short run and when the whole sample period is selected, local currency depreciation impact may be harmful to importers but beneficial for exporters but at the same time appreciation in local currency (negative shocks to US$) proved to be equally harmful to exporters. This is why stock indexes reacted negatively (positively) to both positive (negative) shocks to the exchange rate. These findings are inconsistent with (Aravind, Citation2017; Arif et al., Citation2014; Chiang Leong & Hui, Citation2014; Hussain, Citation2019; Keswani & Wadhwa, Citation2018; Mazuruse, Citation2014) because they have only utilized symmetrical models in examining linkages between exchange rate fluctuation and stock indexes.
5.1.2. Panel NARDL results before global financial crisis
In long run and before the global financial crisis, the symmetrical panel-based ARDL model fails to establish the long-run non-linear co-integrating association between exchange rate fluctuation and stock indexes. Non-linear Panel ARDL model established a non-linear association between exchange rate fluctuation and stock indexes and the value of non-linear ECT term is −0.1525 and significant which means that system is getting towards its long-run equilibrium at a particular speed of 15 percent per month. According to the results of the nonlinear panel-based ARDL model, only positive shocks to exchange rate fluctuations are having an indirect effect on stock indexes and negative shocks to exchange rate fluctuation remain statistically insignificant. This means that investors have only reacted to currency depreciation rather than appreciation, e.g. with the increase in the exchange rate, stock indexes decrease in long run and before crisis regime. This means that currency depreciation is having an inverse impact on stock indexes because of import-dominated regime. According to a flow-oriented approach, depreciation in local currency increases the producer prices of many goods and in this way, the profitability of firms relying on imported goods is decreased. Similarly, in the short run and before the global financial crisis, stock indexes reacted to only positive fluctuations in exchange rates, and negative shocks to exchange rate fluctuations remain statistically insignificant. However, Wald test statistics indicated an asymmetrical association between exchange rate fluctuation and stock indexes for shorter horizons and before the global financial crisis. There are wide differences in the results of the two regimes: before the global financial crisis and when the whole sample period is selected. In short term and when the whole sample period is selected, investors reacted inversely to both positive and negative shocks to exchange rate fluctuations, which means that currency appreciations and depreciation have significant impacts on stock indexes of four selected economies. The detrimental impact may be because of import-oriented and export-oriented dynamics of the region. Appreciations in local currency are more profitable for organizations relying on imported goods, whereas depreciation in local currency is more profit-oriented for organizations associated with export businesses. However, investors reacted negatively to both positive and negative shocks to exchange rate fluctuations because import-oriented and export-oriented region cancel the potential benefit associated with either appreciation or depreciation in local currency rates against US dollars. For example, in case of depreciation of the local currency, importers are the loss bearer and exporters may increase their profitability (Andriansyah & Messinis, Citation2019; Ingalhalli et al., Citation2016; Nouira et al., Citation2019). However, at the same time, appreciation in the local currency against US dollars decreases the profitability of exporters, which is again reflected by composite stock indexes. But in the period before the crisis regime, only positive shocks to exchange rate causes stock indexes to decrease, and negative shocks to exchange rate did not significantly cause the stock index to decrease for both longer and shorter horizons. This shows that the South Asian region before the crisis is heavily relying on imports rather than exports as only positive shocks to exchange rate is significantly decreasing the stock indexes and investors did not react to negative shocks to exchange rate in the pre-crisis regime for shorter and longer horizons.
5.1.3. Panel NARDL results after global financial crisis
After the global financial crisis both symmetrical and Asymmetrical panel-based NARDL model established long-term co-integrating association between fluctuations in the exchange rate and stock indexes. The symmetrical panel ARDL model formulates the indirect relationship between exchange rate and stock indexes; however, the reaction of investors to both positive and negative fluctuations in stock indexes cannot be possible in the symmetrical panel-based ARDL model.
According to the Panel NARDL model, investors reacted negatively to currency depreciation. Results reported that only positive shock to exchange rate fluctuations are having an inverse relationship with stock indexes and negative shocks to exchange rate are insignificant. This means that currency depreciation is having an inverse impact on stock indexes as this shows that selected countries of the South Asian region are relying on imported goods. These results are inconsistent with (Areli Bermudez Delgado et al., Citation2018; Bagchi, Citation2017; Dimitropoulos & Asteriou, Citation2009; González et al., Citation2018; Ingalhalli et al., Citation2016; Muhammad & Gang, Citation2015) because these studies have relied only on symmetrical modelling approach and other have utilized only time-series NARDL model (Awodumi & Adewuyi, Citation2020; Baz et al., Citation2019; Charfeddine & Barkat, Citation2020; Jung et al., Citation2020; Kumar, Citation2019; Liang et al., Citation2020; Mathur, Citation2018; Rajesh, Citation2019). This is the first research that has examined non-linearity between exchange rate fluctuation and stock indexes for Pakistan, India, Bangladesh, and Sri-lanka. Table reports the results for asymmetrical granger causality analysis.
Table 7. Panel Asymmetric granger causality test
Table reports that when the whole sample period is selected, there is a unidirectional causality running from positive shocks of currency values towards negative shocks of stock indexes and negative shocks to exchange rates fluctuation are granger causing positive shocks to stock indexes. However, before the global financial crisis, there is no asymmetric Granger causality running from positive and negative shocks of exchange rate towards positive and negative shocks to stock indexes. After the global financial crisis, there is a unidirectional causality running from positive shocks and negative shocks to the exchange rate towards positive shocks to stock indexes. According to the flow-oriented approach, positive fluctuations in US dollars against local currency depreciates the local currency and this depreciation may have a negative impact on import-oriented economy of the South Asian region. Depreciation in local currency is harmful to companies relying on imported goods (Chkir et al., Citation2020) and services for manufacturing products within Pakistan, India, Sri Lanka, and Bangladesh, which is again reflected by stock indexes of selected economies of the South Asian region (Al-hajj et al., Citation2018; Andriansyah & Messinis, Citation2019; Chkir et al., Citation2020; Kassouri & Altıntaş, Citation2020; Keswani & Wadhwa, Citation2018; Nouira et al., Citation2019; Rexford, Citation2019; Xie et al., Citation2020).
6. Conclusion and policy recommendations
This research article has examined the symmetrical and asymmetrical linkages between exchange rate fluctuations and stock indexes of Pakistan, India, Bangladesh, and Sri-lanka by utilizing linear panel ARDL and NARDL modelling and asymmetrical granger causality analysis. Data period is divided into three different types of time frames such as before the global financial crisis, after the crisis, and when the whole sample period is selected. Results have shown that symmetrical panel-based ARDL models failed to establish a long-term linear co-integrating association between exchange rate fluctuations and stock indexes when the whole sample period is selected and for regime before the crisis. However, the asymmetrical panel-based NARDL model established asymmetrical co-integration between positive and negative shocks to exchange rate fluctuations and stock indexes. In the existing literature, symmetrical models have been utilized for investigating the linkages between exchange rate fluctuation and stock indexes, and only a few research articles utilized the time-series NARDL model, but these studies have been carried out for the developed economies and context outside the region of South Asia. For the long term, findings have shown that positive shocks to exchange rate fluctuations formulated an indirect association with stock indexes during the pre-crisis regime and when the whole sample period is selected. According to a flow-oriented approach, this may be because currency depreciation is having a harmful impact on organisations relying on the imported product for finished goods and other import centric businesses. Currency depreciation against US dollars increases the producer prices and also minimizes the profitability of import-dominated businesses.
This research article contributes to the existing literature in the following three ways and also provides practical insights for investors, government, and academicians. Firstly, this research contributes to the existing literature by investigating asymmetrical linkages between exchange rate and stock indexes as symmetrical ECT failed to establish a long-term relationship between exchange rate and stock indexes. Secondly, on a long-term basis, the global financial crisis cannot be able to impact asymmetrical linkages between exchange rate fluctuations and stock indexes during pre-crisis, post-crisis and when the whole sample is selected. However, for shorter horizons, the global financial crisis has changed the asymmetrical relationship between the exchange rate fluctuation and stock indexes.
This shows that short-term investors should consider both positive and negative shocks to exchange rate fluctuation before investing in stock indexes of Pakistan, Bangladesh, India and Sri-Lanka. During three regimes and in long term, only positive fluctuations in the exchange rate are having a negative impact on stock indexes, this means that appreciation of US dollars against local currency is having a detrimental impact on stock indexes. This is mostly because selected countries are dependent on import-oriented goods rather than exporting goods to other countries. The stock investors of the South Asian region needs to consider these positive fluctuations in US dollars against local currency or local currency depreciation as this research classified the detrimental impact of local currency depreciation on stock indexes in long term. Thirdly, in existing literature, most of the researchers utilized either symmetrical panel-based model or asymmetrical time-series modelling for investigating symmetrical or asymmetrical linkages between exchange rate fluctuation and stock indexes. Those studies were either limited to a single economy or have utilized symmetrical or asymmetrical time-series econometric modelling for exploring exchange rate – stock index nexus. This is the first research article which has utilized both symmetrical and asymmetrical panel-based NARDL modelling approach for exploring the asymmetrical nexuses between exchange rate and stock indexes.
Additional information
Funding
Notes on contributors
Umaid A Sheikh
Umaid A Sheikh has completed several academic degrees including BBA-Hons and Master of Business Administration from Comsats University, Islamabad. He has also completed his M.Phil. in Accounting and Finance with A grade in thesis and 87% overall aggregate average. His research works appear in other scientific journals indexed by Scopus, WOS, and ABDC.
Dr. Mosab is acting as Director of the MBA program at AL-Ain University. He also published extensively in several impact factor journals.
Dr. Muzaffar Asad is working as an Assistant Professor at the University of Bahrain, College of Business Administration. He completed his Ph.D. in Entrepreneurial Finance and has supervised several research projects in the field of entrepreneurship, finance, and business management.
Notes
1. “Pesaran, M. H. 2004. General diagnostic tests for cross section dependence in panels. University of Cambridge, Faculty of Economics, Cambridge Working Papers in Economics No. 0435”
References
- Adjasi, C. K. D., Biekpe, N. B., & Osei, K. A. (2011). Stock prices and exchange rate dynamics in selected African countries: A bivariate analysis. African Journal of Economic and Management Studies, 2(2), 143–24. https://doi.org/10.1108/20400701111165623
- Akbar, M., Iqbal, F., & Noor, F. (2019). Bayesian analysis of dynamic linkages among gold price, stock prices, exchange rate and interest rate in Pakistan. Resources Policy, 62(1), 154–164. https://doi.org/10.1016/j.resourpol.2019.03.003
- Al-hajj, E., Al-Mulali, U., & Solarin, S. A. (2018). Oil price shocks and stock returns nexus for Malaysia: Fresh evidence from nonlinear ARDL test. Energy Reports, 4, 624–637. https://doi.org/10.1016/j.egyr.2018.10.002
- Andriansyah, A., & Messinis, G. (2019). Stock prices, exchange rates and portfolio equity flows: A Toda-Yamamoto panel causality test. Journal of Economic Studies, 46(2), 399–421. https://doi.org/10.1108/JES-12-2017-0361
- Anisak, N., & Mohamad, A. (2019). Foreign exchange exposure of Indonesian listed firms. Global Business Review, 0972150919843371. https://doi.org/10.1177/0972150919843371
- Aravind, M. (2017). FX volatility impact on Indian stock market: An empirical investigation. Vision, 21(3), 284–294. https://doi.org/10.1177/0972262917716760
- Areli Bermudez Delgado, N., Bermudez Delgado, E., & Saucedo, E. (2018). The relationship between oil prices, the stock market and the exchange rate: Evidence from Mexico. The North American Journal of Economics and Finance, 45, 266–275. https://doi.org/10.1016/j.najef.2018.03.006
- Arif, B. D., Aasif, S., Niyati, B., & Amaresh, S. (2014). The relationship between stock prices and exchange rates in Asian markets: A wavelet based correlation and quantile regression approach. South Asian Journal of Global Business Research, 3(2), 209–224. https://doi.org/10.1108/SAJGBR-07-2013-0061
- Asad, M., & Farooq, A. (2009). Factors influencing KSE 100 index/share prices. Pardigms A Journal of Commerce, Economics, and Social Sciences, 3(1), 34–51. https://doi.org/10.24312/paradigms030102
- Asad, M., Iftikhar, K., & Jafary, A. Y. (2019). Relationship between capital structure and financial performance of textile sector companies. Kashmir Economic Review, 28(1), 39–52.
- Athukorala, P., & Chongvilaivan, A. (2010). The global financial crisis and asian economies: Impacts and trade policy responses. ASEAN Economic Bulletin, 27(1), 1–4. https://doi.org/10.1355/AE27-1A
- Awodumi, O. B., & Adewuyi, A. O. (2020). The role of non-renewable energy consumption in economic growth and carbon emission: Evidence from oil producing economies in Africa. Energy Strategy Reviews, 27, 100434. https://doi.org/10.1016/j.esr.2019.100434
- Bagchi, B. (2017). Volatility spillovers between crude oil price and stock markets: Evidence from BRIC countries. International Journal of Emerging Markets, 12(2), 352–365. https://doi.org/10.1108/IJoEM-04-2015-0077
- Bahmani-Oskooee, M., & Saha, S. (2016). Do exchange rate changes have symmetric or asymmetric effects on stock prices? Global Finance Journal, 31, 57–72. https://doi.org/10.1016/j.gfj.2016.06.005
- Baz, K., Xu, D., Ampofo, G. M. K., Ali, I., Khan, I., Cheng, J., & Ali, H. (2019). Energy consumption and economic growth nexus: New evidence from Pakistan using asymmetric analysis. Energy, 189, 116254. https://doi.org/10.1016/j.energy.2019.116254
- Carrasco, Hayashi, & Mukhopadhyay. (2010). The impact of the global crisis on South Asia. Asian Dovelopment Bank.
- Charfeddine, L., & Barkat, K. (2020). Short- and long-run asymmetric effect of oil prices and oil and gas revenues on the real GDP and economic diversification in oil-dependent economy. Energy Economics, 86(1), 104680. https://doi.org/10.1016/j.eneco.2020.104680
- Chiang Leong, C., & Hui, T.-K. (2014). Macroeconomic and non-macroeconomic variables linking to singapore hotel stock returns. In Advances in Hospitality and Leisure (Vol. 10, pp. 2–21). Emerald Group Publishing Limited. https://doi.org/10.1108/S1745-354220140000010000
- Chkir, I., Guesmi, K., Ben, B. A., & Naoui, K. (2020). Modelling the nonlinear relationship between oil prices, stock markets, and exchange rates in oil-exporting and oil-importing countries. Research in International Business and Finance, 54(1), 101274. https://doi.org/10.1016/j.ribaf.2020.101274
- Choi, I. (2001). Unit root tests for panel data. Journal of International Money and Finance, 20(2), 249–272. https://doi.org/10.1016/S0261-5606(00)00048-6
- Choi, S., Salam, M. A., & Lee, K.-D. (2019). The nature of exchange rate movements and exchange rate exposure: The Bangladesh case. Journal of South Asian Development, 14(2), 180–222. https://doi.org/10.1177/0973174119853446
- Corbet, S., Gurdgiev, C., & Meegan, A. (2018). Long-term stock market volatility and the influence of terrorist attacks in Europe. The Quarterly Review of Economics and Finance, 68(1), 118–131. https://doi.org/10.1016/j.qref.2017.11.012
- Dimitropoulos, P. E., & Asteriou, D. (2009). The value relevance of financial statements and their impact on stock prices: Evidence from Greece. Managerial Auditing Journal, 24(3), 248–265. https://doi.org/10.1108/02686900910941131
- Filardo, A. (2011). The Impact of the international financial crisis on Asia and the Pacific: Highlighting monetary policy challenges from a negative asset price bubble perspective. Banks for International settlements (BIS).
- González, M., Nave, J., & Rubio, G. (2018). Macroeconomic determinants of stock market betas. Journal of Empirical Finance, 45, 26–44. https://doi.org/10.1016/j.jempfin.2017.10.003
- Granger, C., & Yoon, G. (2002). Hidden cointegration (royal economic society annual conference 2002, issue 92). Royal Economic Society. https://econpapers.repec.RePEc:ecj:ac2002:92
- Hadri, K. (2000). Testing for stationarity in heterogeneous panel data. The Econometrics Journal, 3(2), 148–161. https://doi.org/10.1111/1368-423X.00043
- Hatemi-J, A. (2012). Asymmetric causality tests with an application. Empirical Economics, 43(1), 447–456. https://doi.org/10.1007/s00181-011-0484-x
- Hung, N. T. (2019). Spillover effects between stock prices and exchange rates for the central and eastern European countries. Global Business Review, 1, 0972150919869772. https://doi.org/10.1177/0972150919869772
- Hussain, C. B. (2019). Dynamic analysis of the relationship between stock prices and macroeconomic variables ( M. M. Saeed Ed.). South Asian Journal of Business Studies, ahead-of-p(Issue ahead–of–print). https://doi.org/10.1108/SAJBS-06-2018-0062
- Ingalhalli, V., Poornima, B. G., & Reddy, Y. V. (2016). A study on dynamic relationship between oil, gold, forex and stock markets in Indian context. Paradigm, 20(1), 83–91. https://doi.org/10.1177/0971890716637706
- Jung, Y. C., Das, A., & McFarlane, A. (2020). The asymmetric relationship between the oil price and the US-Canada exchange rate. The Quarterly Review of Economics and Finance, 76, 198–206. https://doi.org/10.1016/j.qref.2019.06.003
- Kassouri, Y., & Altıntaş, H. (2020). Threshold cointegration, nonlinearity, and frequency domain causality relationship between stock price and Turkish Lira. Research in International Business and Finance, 52, 101097. https://doi.org/10.1016/j.ribaf.2019.101097
- Keat, H. S. (2010). The global financial crisis: Impacton Asia and policy challenges ahead. Asia Economic Policy Confrence (pp. 268–275). Federal Reserve Bank of San Francisco.
- Keswani, S., & Wadhwa, B. (2018). An empirical analysis on association between selected macroeconomic variables and stock market in the context of BSE. The Indian Economic Journal, 66(1–2), 170–189. https://doi.org/10.1177/0019466219876492
- Kouton, J. (2019). The asymmetric linkage between energy use and economic growth in selected African countries: Evidence from a nonlinear panel autoregressive distributed lag model. Energy Economics, 83(1), 475–490. https://doi.org/10.1016/j.eneco.2019.08.006
- Kumar, S. (2019). Asymmetric impact of oil prices on exchange rate and stock prices. The Quarterly Review of Economics and Finance, 72(1), 41–51. https://doi.org/10.1016/j.qref.2018.12.009
- Levin, A., Lin, C.-F., & James Chu, C.-S. (2002). Unit root tests in panel data: Asymptotic and finite-sample properties. Journal of Econometrics, 108(1), 1–24. https://doi.org/10.1016/S0304-4076(01)00098-7
- Liang, C. C., Troy, C., & Rouyer, E. (2020). U.S. uncertainty and Asian stock prices: Evidence from the asymmetric NARDL model. The North American Journal of Economics and Finance, 51(1), 101046. https://doi.org/10.1016/j.najef.2019.101046
- Mathur, K. S. (2018). Exchange rate nonlinearities in India’s exports to the USA ( S. Abhishek Ed.). Studies in Economics and Finance, ahead-of-p(Issue ahead–of–print). https://doi.org/10.1108/SEF-07-2015-0179.
- Mazuruse, P. (2014). Canonical correlation analysis: Macroeconomic variables versus stock returns. Journal of Financial Economic Policy, 6(2), 179–196. https://doi.org/10.1108/JFEP-09-2013-0047
- Muhammad, U., & Gang, S. (2015). Country risk, stock prices, and the exchange rate of the renminbi. Journal of Financial Economic Policy, 7(4), 366–376. https://doi.org/10.1108/JFEP-11-2014-0073
- Nandy, S., & Chattopadhyay, A. K. (2014). Impact of Introducing Different Financial Derivative Instruments in India on Its Stock Market Volatility. Paradigm, 18(2), 135–153. doi:10.1177/0971890714558704
- Nouira, R., Hadj Amor, T., & Rault, C. (2019). Oil price fluctuations and exchange rate dynamics in the MENA region: Evidence from non-causality-in-variance and asymmetric non-causality tests. The Quarterly Review of Economics and Finance, 73(1), 159–171. https://doi.org/10.1016/j.qref.2018.07.011
- Park, C-Y.., & Shin, K. (2020). Contagion through National and Regional Exposures to Foreign Banks during the Global Financial Crisis. Journal of Financial Stability, 46, 100721. doi:10.1016/j.jfs.2019.100721
- Pesaran, M. H. (2004). General diagnostic tests for cross section dependence in panels. University of Cambridge, Faculty of Economics, Cambridge Working Papers in Economics No. 0435
- Pesaran, M. H. (2007). A simple panel unit root test in the presence of cross-section dependence. Journal of Applied Econometrics, 22(2), 265–312. https://doi.org/10.1002/jae.951
- Pesaran, M. H., Shin, Y., & Smith, R. J. (2001). Bounds testing approaches to the analysis of level relationships. Journal of Applied Econometrics, 16(3), 289–326. https://doi.org/10.1002/jae.616
- Pesaran, M. H., Shin, Y., & Smith, R. P. (1999). Pooled mean group estimation of dynamic heterogeneous panels. Journal of the American Statistical Association, 94(446), 621–634. https://doi.org/10.2307/2670182
- Raj, R. (2014). Impact of financial crisis in Asia. In Procedia - social and behavioral sciences (pp. 337–345). Science direct.
- Rajesh, S. (2019). Dynamism between selected macroeconomic determinants and electricity consumption in India. International Journal of Social Economics, 46(6), 805–821. https://doi.org/10.1108/IJSE-11-2018-0586
- Rexford, A. (2019). Corporate performance volatility and adverse macroeconomic conditions. Journal of Financial Economic Policy, ahead-of-p(Issue ahead–of–print), 1-21. https://doi.org/10.1108/JFEP-11-2018-0158
- Roubaud, D., & Arouri, M. (2018). Oil prices, exchange rates and stock markets under uncertainty and regime-switching. Finance Research Letters, 27(1), 28–33. https://doi.org/10.1016/j.frl.2018.02.032
- Salvatore, C. (2019). The long-run interrelationship between exchange rate and interest rate: The case of Mexico. Journal of Economic Studies, 46(7), 1380–1397. https://doi.org/10.1108/JES-04-2019-0176
- Shakil, M. H., Mustapha, I. M., Tasnia, M., & Saiti, B. (2018). Is gold a hedge or a safe haven? An application of ARDL approach. Journal of Economics, Finance and Administrative Science, 23(44), 60–76. https://doi.org/10.1108/JEFAS-03-2017-0052
- Sheikh, H. U. (2018). Financial and non-financial determinants of Asian automobile stock prices. Accountancy Business and the Public Interest, 17(1), 142–162. http://visar.csustan.edu/aaba/SheikhChaudhryMukhtar2018.pdf
- Sheikh, U., Mukhtar, U., Asad, D. M., & Ahmed, D. Z. (2020). Asymmetrical relationship between oil prices, gold prices, exchange rate and stock prices during global financial crisis 2008; evidence from Pakistan. Cogent Economics & Finance. https://doi.org/10.1080/23322039.2020.1757802
- Sheikh, U. A., Asad, M., Ahmed, Z., & Mukhtar, U. (2020). Cogent Economics & Finance Asymmetrical relationship between oil prices, gold prices, exchange rate, and stock prices during global financial crisis 2008 : Evidence from Pakistan Asymmetrical relationship between oil prices, gold prices, exchange rat. Cogent Economics & Finance, 8(1). https://doi.org/10.1080/23322039.2020
- Sheikh, U. A., Asad, M., Israr, A., Tabash, M. I., & Ahmed, Z. (2020). Symmetrical co-integrating relationship between Money supply, Interest rates, Consumer price index, Terroristic disruptions and Karachi stock exchange: Does Global financial crisis matter? Cogent Economics & Finance. https://doi.org/10.1080/23322039.
- Shin, Y., Yu, B., & Greenwood-Nimmo, M. (2014). Modelling asymmetric cointegration and dynamic multipliers in a nonlinear ARDL framework BT. In R. C. Sickles & W. C. Horrace (Eds.), Festschrift in honor of peter schmidt: Econometric methods and applications (pp. 281–314). Springer New York. https://doi.org/10.1007/978-1-4899-8008-3_9
- Shiva, A., & Sethi, M. (2015). Understanding dynamic relationship among gold price, exchange rate and stock markets: Evidence in Indian context. Global Business Review, 16(5_suppl), 93S–111S. https://doi.org/10.1177/0972150915601257
- Sikhosana, A., & Aye, G. C. (2018). Asymmetric volatility transmission between the real exchange rate and stock returns in South Africa. Economic Analysis and Policy, 60(1), 1–8. https://doi.org/10.1016/j.eap.2018.08.002
- Simbolon, L., & Purwanto. (2018). The influence of macroeconomic factors on stock price: The case of real estate and property companies. Global Tensions in Financial Markets, 34(1), 2–19. Emerald Publishing Limited. https://doi.org/10.1108/S0196-382120170000034010
- Singhal, S., Choudhary, S., & Biswal, P. C. (2019). Return and volatility linkages among international crude oil price, gold price, exchange rate and stock markets: Evidence from Mexico. Resources Policy, 60(1), 255–261. https://doi.org/10.1016/j.resourpol.2019.01.004
- Sultana, S. T., & Reddy, K. S. (2017). The effect of macroeconomic factors on Indian stock market: An empirical evidence. FIIB Business Review, 6(1), 68–76. https://doi.org/10.1177/2455265820170109
- Tabash, M. I., Sheikh, U. A., & Asad, M. (2020). Market miracles: Resilience of Karachi stock exchange index against terrorism in Pakistan. Cogent Economics & Finance, 8(1), 1821998. https://doi.org/10.1080/23322039.2020
- Tripathi, V., & Seth, R. (2014). Stock market performance and macroeconomic factors: The study of Indian equity market. Global Business Review, 15(2), 291–316. https://doi.org/10.1177/0972150914523599
- Wei, Y., Qin, S., Li, X., Zhu, S., & Wei, G. (2019). Oil price fluctuation, stock market and macroeconomic fundamentals: Evidence from China before and after the financial crisis. Finance Research Letters, 30(1), 23–29. https://doi.org/10.1016/j.frl.2019.03.028
- World Bank feature Story. (2010). Has South Asia escaped the worst effects of the global economic crisis?. World Bank.org. https://www.worldbank.en/news/feature/2010/02/23/south-asia-escaped-worst-effects-global-economic-crisis
- Xie, Z., Chen, S.-W., & Wu, A.-C. (2020). The foreign exchange and stock market nexus: New international evidence. International Review of Economics & Finance, 67(1), 240–266. https://doi.org/10.1016/j.iref.2020.01.001
- Yang, S.-P. (2017). Exchange rate dynamics and stock prices in small open economies: Evidence from Asia-Pacific countries. Pacific-Basin Finance Journal, 46(1), 337–354. https://doi.org/10.1016/j.pacfin.2017.10.004
- You, W., Guo, Y., Zhu, H., & Tang, Y. (2017). Oil price shocks, economic policy uncertainty and industry stock returns in China: Asymmetric effects with quantile regression. Energy Economics, 68(1), 1–18. https://doi.org/10.1016/j.eneco.2017.09.007