
 ?Mathematical formulae have been encoded as MathML and are displayed in this HTML version using MathJax in order to improve their display. Uncheck the box to turn MathJax off. This feature requires Javascript. Click on a formula to zoom.
Abstract
The primary objective of this research article is to investigate the asymmetrical linkages between gold-oil-exchange rates and Bombay stock indexes by utilizing a nonlinear ARDL approach covering the period from April 2003 to May 2020. Time-series data is divided into three different types of regimes such as before the crisis regime, after the crisis regime, and over the entire period. Seasonality effects within the data series are identified through utilizing different types of unit root analysis such as Philips Peron (PP), augmented dickey-fuller test (ADF), and Kwiatkowski Philips Schmidt Shin (KPSS) test statistics followed by Zivot Andrew (ZA) unit root for identification of structural break unit root test. Nonlinearity within time-series frequencies has been identified through the implementation of BDS test statistics. For longer horizons and before the economic recession period, only gold prices, oil prices, and currency values have an asymmetrical association with Bombay stock indexes as positive shocks to these variables have no impact on stock indexes. However, after the crisis regime and for the longer term, negative shocks to exchange rate fluctuations and oil prices remain statistically insignificant, and only an asymmetrical relationship is established between oil prices and stock indexes. This shows that the regime is more important while classifying the impact of oil prices, gold prices, and appreciation, or depreciation in local currency on Bombay stock indexes. This research article has established an asymmetrical association between stock indexes and gold-oil-exchange rates and concluded asymmetries between them, which are well thought out to be symmetrical by previous researches.
PUBLIC INTEREST STATEMENT
In long run and before the global financial crisis, only negative shocks associated with exchange rate fluctuation, gold prices, and oil prices are value relevant for investors as investors did not give much importance to episodes of currency devaluations, positive shocks associated with gold prices and oil prices. Positive shocks to exchange rate fluctuations means that dollar prices appreciated against local rupee value, which can be a favorable outcome for economies relying on exports rather than import centric economies. However, after the economic crunch, both positive and negative fluctuations in exchange rates remain no longer value relevant for investors. This research article has found that the global financial crisis has not only effected the asymmetric association between gold prices, oil prices, stock indexes, and dollar values against the local Indian rupee but the relationship between these variables is also dependent upon specific regime and is nonlinear in nature.
1. Introduction
The South Asian economies have undergone the worst economic recession since 2008 because of the worldwide economic crisis of 2008. Such countries required sufficient resources to stabilize against the aftereffects of the 2008 financial crisis and to rebound economically with maximum momentum. The major work onto the consequences and solutions to the 2008 international financial downturn, which is highly divisive by policymakers and scholars, has been widely discussed by (Asad & Farooq, Citation2009; Athukorala & Chongvilaivan, Citation2010; Muthukumaran et al., Citation2011; Al‐Rjoub & Azzam, Citation2012; Inoguchi, Citation2014; Mollick & Nguyen, Citation2015; MengYun et al., Citation2018; Anisak & Mohamad, Citation2019; Husain, Tiwari, Sohag, & Shahbaz, Citation2019; Makin, Citation2019, Tabash et al., Citation2020). Furthermore, the literature remains deficient regarding the asymmetrical impact of Gold-Oil-Exchange rate volatility on Indian stock indexes during three regimes such as the pre-2008 crisis regime, post-economic recession, and over the entire sample period.
Mollick and Nguyen (Citation2015) utilized the arbitrage pricing model to observe the relationship between stock price variations of the US energy sector and its determinants such as oil price volatility, currency value fluctuations, and yield spread. Results have revealed an asymmetrical association between variations in stock prices and their fundamental determinants during the global financial crisis of 2008. Anisak and Mohamad (2019) also observed that the agriculture sector of Indonesia remained resilient during the Asian financial crisis of 2008. Based upon earlier study discussions on Eastern Asian financial institutions’ resilience after the global financial crisis, Shakil et al. (Citation2018) have examined the transmission of volatility shocks from foreign stock markets towards Singapore, Korean, Malaysian, and Thailand’s equity markets. Results estimated the transmission of exogenous volatility shocks from stock markets of developed economies like the US and Japan towards sampled countries. Husain et al. (2019) examined the inter-relationship between precious metal prices, international oil price volatility, and stock price volatility to understand that whether the US stock market has contributed to volatility shocks or acted as a receiver of volatility shocks. Results indicated that precious metal prices have contributed towards volatility shocks whereas crude oil, silver, and steel proved as receivers of volatility shocks.
Al‐Rjoub and Azzam (2012) investigated the reaction of the Jordon stock exchange during the international economic crisis of 2008 by employing the GARCH modeling approach and by using time-series data over the period from 1992 to 2009. Authors have defined stock market crash according to previous specifications set by Patel and Sarker (Citation1998) and Mishkin and white (Citation2002) who have associated 35% and 20% depreciation in stock indexes, respectively, as an illustration of stock market turmoil. Findings suggested that the international economic crisis contributed to adverse impacts on the stock market and the financial sector was most adversely affected by the crisis. Sheikh, Asad, Ahmed, and Mukhtar (Citation2020) have divided the time-series data into three threshold periods such as before the economic crunch period, after the economic crunch, and over the entire period to investigate the asymmetrical impact of oil price volatility, gold prices, and currency fluctuations on Karachi stock exchange of Pakistan. Muthukumaran et al. (Citation2011) symmetrically examined the impact of the international economic crisis on the Indian stock market and found adverse consequences of the international economic crisis on the Indian stock market. However, limited efforts have been made to investigate the asymmetrical impact of Oil-Gold-Exchange rate volatility on Indian stock indexes during pre-crisis and post-crises regime.
1.1. Research motivation
The implications of the international economic crisis were passed on to the Indian financial system via three different networks, namely the exporting industry, currency fluctuations, and the financial market of India (Kumar & Vashist, Citation2009). Although it has been observed that the Indian economic system, including the insurance sector, stock markets, commercial loans, foreign remittances have not remained unaffected by the economic crisis of 2008 but banking sector of India has not been exaggeratedly subjected to the economic recession in 2008 (Kumar & Vashisht, Citation2009; Asad et al., Citation2018). For example, one of the India’s largest banks named as ICCI, owing to its successful financial history, is partly impacted but showed resilience to the great recession in 2008. Before the crisis, the Indian stock exchange appreciated to 21,000 index points, but during the crisis, the Indian stock market witnessed almost 60% depreciation in the stock market indexing and a decrease of some USD 1.3 trillion in market capitalizations (Kumar & Vashisht, 2009). This depreciative trend in stock indexes is partly attributed to international Equity shareholders’ withdrawals of 12 billion US$ from the stock exchange during the global economic crisis. For purpose of stabilizing the financial position of Parent firms, global investors removed those contributions (Kumar et al., 2009).
Commercial loans have nearly dried out, particularly for corporate financing and medium-term borrowing from international banks. Due to high-interest rates and limited money supply within the economy, the exchange rates have declined and the situation of firms that rely on imported goods has been further deteriorated (Asad, Citation2010; Muthukumaran et al., Citation2011). The significant decrease in India’s demand for exporting goods in the major international markets was yet another shock towards economic structure due to the international crisis. The first industry impacted was Jewels and Gems, which in November had laid off more than 0.3 million workers. The volatility in developed countries’ capital markets has negatively impacted all foreign direct investment inflows and the external commercial borrowing levels. During the global financial crisis, Indian companies attempted to gain only US$ 1800 million for trade loans from foreign countries since 2008 that is 41% smaller as compared to commercial credit generated in the last year (Kumar & Vashisht, 2009). International remittances from Indians residing and working in global markets during the international economic crunch immediately felt the effects of the financial recession, as international remittances depreciated yearly by 0.5%. Throughout the last four months of 2008–2009, the effect is greater, with the influx of external remittances falling more than 29% in contrast with the preceding year. However, in existing literature-limited efforts have been made to explore the asymmetrical impact of macroeconomic volatility on Indian stock indexes, which motivates the researcher to investigate the asymmetric impact of gold prices, oil prices, and INR/USD on Bombay stock indexes during three different regimes.
In , the horizontal axis of gold prices, oil prices and exchange rate portray a number of years from 2003 to 2020 and the vertical axis displays price-related information for underlying independent variables. According to , Bombay stock indexes (BSE-100) have been depreciated from 6000 index points to only 2000 index points, whereas oil prices, gold prices, and exchange rates (USD/INR) have also shown indications of positive and negative shocks during the crisis regime. displays that Indian stock indexes have been adversely affected during the global financial crisis, whereas gold prices, international crude oil prices, and USD to INR moved in the same direction as that of Indian stock indexes during the global financial crisis of 2008. also demonstrates that international oil prices, gold prices, and currency values have both positive and negative shocks, which furthermore motivated the researchers to find out the asymmetrical impact of these variables on Indian stock indexes before the crisis, after the crisis, and over the entire period. , shows an asymmetrical relationship between Bombay stock indexes, exchange rate, crude oil prices, and gold prices. However, this nonlinear association between variables will be furthermore validated by the BDS test of nonlinearity in the results section (see ).
Figure 1. International crude oil prices, gold prices, and USD/INR and BSE-100 indexes from April 2003 to April 2020
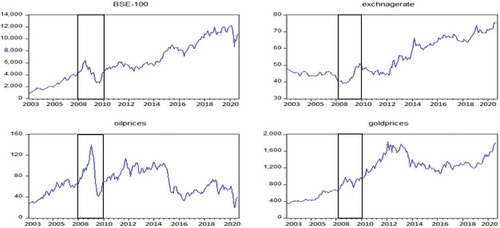
Figure 2. Scatter plot matrix diagram
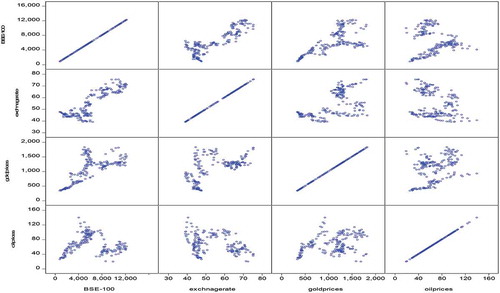
Table 1. Descriptive statistics of time-series data during the entire period
Table 2. Descriptive statistics of time series data during Pre-crisis period
Table 3. Descriptive statistics of time-series data during Post-crisis period
Table 4. Brock, Dechert, Scheinkman, and LeBaron Test for Nonlinearity
In the existing literature, some of the researchers have utilized the arbitrage pricing model (Christofi et al., Citation1993; Günsel et al., Citation2009; Mollick & Nguyen, Citation2015; Saumya, Citation2012; Yan & Yang, Citation2016), while other have utilized efficient market hypothesis as an underpinning theoretical model in order to explore symmetrical and asymmetrical linkages between Gold-Oil-Exchange rates and stock indexes (Floros & Vougas, Citation2008; Hatemi-J, Citation2012; Singhania & Prakash, Citation2014; Wickremasinghe, Citation2011). To the best of our knowledge, this is the first research article which is intended to answer the research question about the asymmetrical impact of international oil prices, gold prices, and exchange rate fluctuations on the Bombay stock exchange before and after the international economic recession of 2008 and over the entire duration from April 2003 to May 2020.
1.2. Research gaps
We have identified the following four most important research gaps in the existing literature. Firstly, in existing literature number of research articles have only explored linear linkages between stock indexes, exchange rate fluctuations, oil price volatilities, and gold prices by utilizing linear models like VECM (Badry, Citation2019; Keswani & Wadhwa, Citation2018; Neveen, Citation2018; Rajesh, Citation2019; Sahu et al., Citation2014; Shiva & Sethi, Citation2015), VAR (Areli Bermudez Delgado et al., Citation2018; Ghulam, Citation2018; Huang et al., Citation2018), ARDL modeling approach (Ho, Citation2018; Singhal et al., Citation2019) and limited efforts have been made to explore the asymmetrical impact of Exchange rates-Gold-Oil price volatility on stock indexes by using NARDL model by (Shin et al., Citation2014).
Secondly, some of the research articles have explored linkages between macroeconomic fluctuations and stock indexes of the United states (Liang et al., Citation2020), Pakistan (Asad & Farooq, Citation2009; Sheikh et al., Citation2020; Tabash et al., Citation2020), Malaysia (Al-hajj et al., Citation2018; Almansour et al., Citation2016), China (Fan et al., Citation2014; Huang et al., Citation2018; Lin & Chen, Citation2019; You et al., Citation2017; Zhang et al., Citation2019), Indonesia (Lentina Andriansyah & Messinis, Citation2019; Simbolon & Purwanto, Citation2018), Sri-Lanka (Wickremasinghe, Citation2011), Bangladesh (Choi et al., Citation2019) and no efforts have been made to explore Gold-Oil-Exchange rates and stock index nexus asymmetrically for Indian stock exchange.
Thirdly, some of the research articles have explored the asymmetrical impact of macroeconomic volatility on Indian stock indexes (Pandey & Vipul, Citation2018) but they have not utilized NARDL modeling in order to decompose underlying independent variables into their positive and negative shocks. The disintegration of oil prices, gold prices, and exchange rates into their positive and negative cumulative signs help to investigate whether investors are reacting only to positive fluctuations in exchange rates, gold prices and oil prices or negative fluctuations associated with these variables are also value relevant.
In the existing literature, some of the researchers have utilized only gold prices (Arfaoui & Ben Rejeb, Citation2017; Shakil et al., Citation2018; Tuna, Citation2018) and others have utilized only oil prices (Lardic & Mignon, Citation2008; Sahu et al., Citation2014; Mollick & Nguyen, Citation2015; Wen et al., Citation2017; Abdel-Latif et al., Citation2018; Areli Bermudez Delgado et al., Citation2018; Pandey & Vipul, Citation2018; Kumar, Citation2019; A. Mouna, Citation2019; Narayan, Citation2019; Charfeddine & Barkat, Citation2020) in order to examine their linkages with stock market indexes. In this research article we have utilized gold prices, oil prices, and currency value fluctuations (USD/INR) simultaneously in order to examine asymmetrical linkages with Bombay stock indexes. Moreover, amongst previously published research articles, few researchers have explored asymmetrical linkages of macroeconomic fluctuations with stock indexes (Ajaz et al., Citation2017; Bahmani-Oskooee & Saha, Citation2016; Kocaarslan & Soytas, Citation2019; Kumar, Citation2019; Liang et al., Citation2020; Singhal et al., Citation2019) but did not examine the role of the international economic recession of 2008 in effecting asymmetrical association between gold, oil, currency values, and Bombay stock indexes, and these studies were also outside of the Indian context.
1.3. Research objectives
This research article is projected to aim for the following three important research intents.
To investigate asymmetrical short-run and long-run impact of gold prices on Bombay stock index during the pre-economic recessionary regime, post-recession and over the entire sample duration.
To investigate asymmetrical short-run and long-run impact of oil prices on Bombay stock index during the pre-economic recessionary regime, post-recession and over the entire sample duration.
To investigate asymmetrical short-run and long-run impact of exchange rate fluctuationFootnote1 on Bombay stock index during the pre-economic recessionary regime, post-recession and over entire sample duration.
1.4. Summarized research findings and remaining structure of document
In long run and before the economic recession period of India, investors have only reacted significantly to negative shocks associated with gold prices, exchange rate fluctuations, and oil prices, however in long run after the crisis, investors did not react to positive and negative shocks to the exchange rate fluctuations. This shows that the Indian economy has been relying on imports and can be classified as an import centric economy before the 2008 economic crunch. Negative shocks to exchange rate fluctuations (dollar values against Indian rupee) causes’ local currency appreciation, which may not be more suitable for exporters relying on exported goods for earning revenues, and hence, increases their expenses. However, local currency appreciation yields a positive impact on Bombay stock indexes means that importers of India have been greatly aided due to local currency appreciation. There is an asymmetrical relationship between the Gold-Oil-exchange rate and stock indexes before the crisis; however, after the crisis, the asymmetrical association is only established between oil price volatility and Bombay stock indexes for a longer period. This shows that the regime is extremely important while making financial investments and decisions. The rest of the paper is structured in the following six parts. The first part explains the literature review, in which authors have explained the linear-nonlinear impact of underlying variables on stock indexes. The second and third parts deal with the data and research methodological portion. The research methodological portion explains the procedure for implementation of unit root test, BDS test of nonlinearity, NARDL, and asymmetrical ECT estimation. The fourth, fifth, and sixth parts deal with results, discussion, and conclusion, respectively. Results of BDS test for the determination of non-linearity are reported in .
2. Literature review
The literature review of this article is divided into two different segments: the first section explains the symmetric and asymmetrical impact of macroeconomic variability on stock indexes and the second, third, and fourth sections explicates the symmetrical and asymmetrical impact of selected variables such as gold prices, international crude oil prices, and exchange rate on stock indexes, respectively. The main purpose of dividing the literature review into two different types of segments is to find out imperative research gaps, and current research findings from published articles, which have explored stock index-macro economy nexus symmetrically or linearly and asymmetrically or nonlinearly.
2.1. Linear and nonlinear impact of macroeconomic volatility on stock indexes
The expediency of nonlinear modeling for estimating and forecasting stock indexes has been debated extensively. McMillan (Citation2012) has utilized financial and nonfinancial variables for predicting variations in UK share market returns through exploring smooth transitional modeling techniques. Findings suggested that the utilization of nonlinear modeling techniques can contribute useful practical knowledge for shareholders, investors, and strategists at the government level. Chronopoulos, McMillan, Papadimitriou, and Tavakoli (Citation2018) explored the symmetrical relationship between investing activities of company executives and forecasted future returns of stocks and found negative linkages between both. In another relevant article, McMillan (Citation2017) has investigated the impact of US stock prices on international equity markets to observe the predictive capacity of US stock prices for forecasting foreign equity market returns. Furthermore, the authors were also interested to examine local as well as international factors responsible for stimulating variations in stock returns of the international financial market (McMillan, 2016). McMillan (Citation2020) highlighted different variables such as the cost of borrowing and purchasing manager index in explaining the predictive capacity of these factors for US stock returns. Spilioti (Citation2016) investigated the role of macroeconomic fluctuations and reactions of investors for explicating forecasted stock price deviations from their real values by utilizing both time series and panel data modeling for the London stock exchange (LSE). Findings have suggested that deviation of stock prices from their real values can be explained by macroeconomic fluctuations and shareholder’s attitude.
Jung et al. (Citation2020) investigated the asymmetrical association between currency fluctuations and oil price variability by employing a nonlinear ARDL modeling approach over the period from 1992 to 2019. Findings have indicated dynamic causation between oil prices and US-Canadian dollar values. Chandra (Citation2012) investigated the causation between stock returns and foreign institution investments (FIIs) for India and found the contributing role of stock market returns in granger causing foreign institution investments for India. The efficient market hypothesis can be rejected if lag values of stock returns influence the present values. Singhania and Prakash (Citation2014) validated EMH by utilizing stock returns of SAARC member countries and employed the GARCH modeling approach. Findings indicated that present values of stock returns are influenced by their prior lag values within the context of SAARC member countries. Muhammad and Gang (Citation2015) analyzed linear co-integrating links between fluctuations in US dollars, Chinese Renminbi, and stock prices by utilizing an asymmetrical ARDL modeling approach for two different time frames such as before 2005 and after 2005. Findings have suggested that fluctuations in the Chinese renminbi are due to fluctuations in Chinese stock indexes and stock indexes are found to be an influential determinant for the Chinese exchange rate, i.e., increase in the value of Chinese stock indexes also have an appreciative impact on the Chinese renminbi. Building upon EMH, Wickremasinghe (Citation2011) have examined symmetrical linkages between macroeconomic volatility and Sri-Lankan stock indexes for shorter and longer horizons. Results have refuted EMH by establishing causal associations between selected macroeconomic variability and Sri-Lankan stock indexes for shorter and longer horizons.
Zhang et al. (Citation2019) studied the macroeconomic volatility on commodity prices of china through employing the SVAR modeling approach. Findings suggested that variations in commodity prices can be explained by the fundamental macroeconomic variables of China. Chiu, Harris, Stoja, and Chin (Citation2018) examined the inter-relationship between selected macroeconomic variables, shareholder’s psychological factors, and financial market volatility by employing a structural vector auto-regression approach with Bayesian sign restrictions. Authors have furthermore disintegrated volatility transmissions into their respective short term and long-term cumulative shocks. SVAR estimation results suggested that shocks to money supply increase the volatility of stock prices and bond market returns but shocks to either stock market or bond market returns play a contributing role in stimulating depreciative trends for macroeconomic fundamentals. Anderson, Balli, and Godber (Citation2018) explored the association between macroeconomic announcements on industrial stock indexes of developed economies: the US and European regions by disintegrating announcements into their positive and negative cumulative signs. Findings suggested that sectoral stock indices are more strongly responsive to macroeconomic variations of the US as compared to the European region. Sheikh, Asad, Ahmed, and Mukhtar (Citation2020) were also interested to explore the influence of global economic crunch on the asymmetrical association between stock indexes and macroeconomic volatility through utilizing the NARDL modeling approach and divided the time frame into three periods: pre-economic crunch regime, post-crunch regime and over the complete sample. Sheikh, Asad, and Mukhtar (Citation2020) showed that nonlinear estimation is more appropriate as compared to linear modeling while exploring the asymmetrical association between energy consumption and economic growth. Sheikh (Citation2018) found that both firm-level financial and nonfinancial variables are important in determining automotive stock prices of the Asian continent.
Mensi, Hammoudeh, Tiwari, and Al-Yahyaee (Citation2019) explored the asymmetric association between selected macroeconomic variations, advancements in Islamic banking, and overall economic development through utilizing time-series data with cross-sectional properties for estimating panel smooth transition framework. Rexford (Citation2019) employed symmetrical granger causation and the Toda–Yamamoto approach for exploring unidirectional and bidirectional causation between sectoral macroeconomic variations and organizational performance. There exists only one-way causation between currency value fluctuations, inflationary pressures, unpredictable inflation index, and variabilities in performance across organizations. Abbas, McMillan, and Wang (Citation2017) employed GARCH and VAR modeling to estimate the impact of macroeconomic volatility on stock returns of G7 member countries by utilizing time-series data from 1985 to 2015. The complex inter-relationship between macroeconomic variability and volatility in stock prices is also analyzed and found a contributing role of macroeconomic variables in stimulating variations within the stock prices. In another study, Peiró (Citation2016) explored macroeconomic-stock price nexus in the European context. Bhargava (Citation2014) also explored the linkages between macroeconomic variations, micro-level firm-specific factors, and stock prices of the developed economy such as the US.
Enns, Eldridge, Montgomery, and Gonzalez (Citation2018) have estimated the stock market betas through employing the MIDAS framework and then investigate the influence of macroeconomic volatility in influencing stock market betas. Simbolon and Purwanto (Citation2018) studied the impact of macroeconomic fluctuations on stock indexes and the magnitude of that impact. The authors were mainly focused on real estate sectoral stock returns and also analyzed the role of macroeconomic fluctuations such as fluctuation in the rate of interest, consumer price index, inflationary pressure, and economic growth on real estate sectoral returns of Indonesia. Wu and Lee (Citation2015) also examined the developed economy’s macroeconomic variations in forecasting bearish trends in stock prices through utilizing a nonlinear technique and suggested that macroeconomic variations of the US significantly predicted bearish trends in stock prices. Chiang, Leong, and Hui (2014) suggested that fluctuations in capital flow and industrial output framed direct association with stock indexes and volatility of other macroeconomic indicators such as currency fluctuations, cost of borrowing and inflation formulates indirect linkages with stock returns of the Singapore hotel industry. Macroeconomic variations played an important contributing role in inflicting volatility to stock prices of a country, irrespective of the economy is either developed, emerging, or developing (Keswani & Wadhwa, Citation2018).
Bhuiyan and Chowdhury (2019) established long-term co-integration between macroeconomic and sectoral indexes only in the case of the US but not for Canada. However, the macroeconomic volatility of the US is having the propensity to predict changes in Canadian stock indexes. Ikizlerli, Holmes, and Anderson (2019) determined the reactions of local and foreign institutions and local shareholders to fluctuations in macro-economy by utilizing buying and selling statistics of the Korean stock market. Indriawan (2020) utilized three factors to measure the quality of the stock exchange such as volatile characteristics of the market, efficient prices, and liquidity during times of macro-economy-related information disclosure. Results disclosed that market quality is greater for ASX as compared to Chi-X during macroeconomic information disclosure. Pradhan, Arvin, and Ghoshray (2015) investigated the dynamic inter-relationship between stock market depth, macroeconomic variations, oil prices, and economic development in the context of G-20 economies. Mensi, Hammoudeh, Yoon, and Balcilar (2017) studied the influence of country risk and selected macroeconomic volatility on the stock market of Gulf cooperation council member economies by utilizing multivariate Panel regression analysis.
2.2. Symmetrical-asymmetrical relationship between gold prices and stock indexes
Tuna (Citation2018) utilized symmetrical co-integration analyses to estimate the relationship between precious metal commodities and stock markets of 32 Islamic states. Countries are selected according to their status of development index. In the case of established economies, findings stated that all precious metal commodities including gold can be recognized as an effective portfolio diversification tool. Shrydeh, Shahateet, Mohammad, and Sumadi (2019) estimated hedging properties of gold against stock price volatility by employing generalized autoregressive conditional heteroskedasticity modeling and found that gold is not an effectual hedging tool against US stock indexes and hedging property of gold against US stock prices tended to undermine with increasing stock market capitalization. This means that marginal risk exposure levels are reduced given the comparatively higher financial resources are required to be capitalized in gold against US stock prices. Sheikh et al. (Citation2020) also estimated the asymmetrical association between KSE-100 indexes, gold prices, currency value fluctuation, and volatility in oil prices by employing the NARDL modeling approach during three different types of regimes: pre-crisis, post-crisis, and over the entire period. Findings indicated a nonlinear co-integrating association between gold prices and stock indexes and investors reacted in a different way to variations in gold prices during pre-crisis and post-crisis regimes.
Shakil et al. (Citation2018) applied linear ARDL modeling to explore hedging properties of gold against variations in Saudi Arabian stock indexes, currency value fluctuations, oil price volatility, cost of borrowing, and inflation. Results indicated gold as an effectual hedging tool against appreciating consumer price indexes. In another related study Ibrahim (2012) studied the association between gold price volatility and stock index variations by utilizing symmetrical ARDL and EGARCH modeling approach and results indicated that investment in gold is more favorable during the times of stock market turmoil. Jain and Biswal (2016) have also found that gold is an effective hedging tool against depreciating stock market indexes of the Indian economy. Singhal et al. (Citation2019) explored the inter-relationship between oil price volatility, gold prices, currency value fluctuations, and Mexican stock indexes through utilizing symmetrical ARDL modeling over the timeframe from 2006 to 2018. Authors have found an inverse association between gold prices and Mexican stock indexes. Pandey and Vipul (Citation2018) analyzed the impact of gold prices and price volatility in stimulating volatility on the stock market of BRICS member countries through utilizing the GARCH modeling approach. Findings indicated that oil prices and gold price volatility play a contributing role in affecting stock prices of individual member countries of the BRICS region. Furthermore, volatility transmission from international gold prices towards stock prices remained insignificant in the pre-crisis regime but become significant after the economic crisis. Ingalhalli and Reddy (2016) studies the association between stock indexes, gold prices, oil prices, and exchange value fluctuations, and found one-way causality running from oil prices towards gold prices and currency value fluctuations. Arfaoui and Rejeb (2017) observed complex dynamic linkages between precious metal prices like gold, currency value fluctuations, oil price volatility, and stock indexes over the period from 1995 to 2015. Results indicated an inverse relationship between oil prices and stock indexes, but a direct relationship is established between oil, gold, and exchange rate. Furthermore, authors have also found that stock indexes influenced gold price volatility. Akbar et al. (Citation2019) estimated the indirect association between gold and stock prices by utilizing symmetrical VAR modeling over the period from 2001 to 2014.
Building upon arbitrage pricing theory, Andreas (1993), Günsel et al. (Citation2009), Mollick and Nguyen (Citation2015), and Saumya (Citation2012), and Yan, Yang, and Zhao (2016) purposed a symmetrical association between macroeconomic volatility and stock indexes, but as stated by Bahmani-Oskooee and Saha (2015) there is a possibility that investors may react to both positive and negative fluctuations in gold prices after the financial crisis. The symmetrical ARDL model purposed by (Pesaran et al., Citation2001) can only estimate the linear association between regressors and regressand, however, NARDL model by (Shin et al., Citation2014) disintegrates regressors and regressand into positive and negative cumulative signs to find out the possibility of investor’s reaction to both positive and negative shocks to gold rates. According to , there are both positive and negative fluctuations in gold prices; hence, it can be hypothesized as
H1: There is an asymmetrical relationship between gold prices and stock indexes.
2.3. Symmetrical-Asymmetrical relationship between Oil Prices and stock indexes
Abbas et al. (2017) studies the influence of macroeconomic volatility and stock indexes and found that oil price volatility is one of the most influential macroeconomic determinants for stock prices of G7 member countries. In the existing literature, several research articles have emphasized on linear impact of macroeconomic variations on stock indexes but limited efforts have been made to study the impact of macroeconomic fundamentals on oil price volatility (Joëts et al., 2017); however, Bahmani-Oskooee and Saha (2015) studied the nonlinear impact of macroeconomic volatility on stock indexes as previous researches assumed linearity between macroeconomic-stock price nexus but in reality the relationship is nonlinear. Acting upon the suggestion of Bahmani-Oskooee and Saha (2015), Sheikh et al. (Citation2020) employed the NARDL model to explore the nonlinearity between oil price volatility and stock indexes and found a nonlinear association between both in the Pakistani context. Shahzad et al. (Citation2017) employed an asymmetrical NARDL model to estimate the influence of oil price volatility on US industrial CDS spread and found that oil price variations play a contributing role in affecting the sectoral CDS spread index of the United States. Hatemi-J (Citation2012) formulated an asymmetrical granger causality test by disintegrating the variables into their positive and negative shocks and found that the stock market is informationally efficient regarding positive and negative shocks associated with oil price volatility.
Wen et al. (Citation2017) examined the impact of oil price reforms on Chinese equity markets and analyzed whether these reforms influence stock market return’s certainty. Kumar (Citation2019) employed an asymmetrical ARDL modeling approach and Granger causality to understand nonlinearity between currency value fluctuations, stock indexes, and oil price volatility. Results explained that there is two-way asymmetrical causation between oil prices and stock prices. Furthermore, results have also shown that positive and negative shocks to several period lag oil prices are negatively influencing the Indian stock prices. In another article, Olaleke (2019) utilized the asymmetrical ARDL model to explore the nonlinear influence of oil price shocks on the prices of the agricultural commodity. Pandey and Vipul (Citation2018) provided evidence regarding the transmission of volatility shocks from gold and oil prices towards stock prices of BRICS member economies. Wei, Qin, Li, Zhu, and Wei (2019) employed the asymmetrical threshold model to investigate nonlinear co-integration between oil future prices and the Chinese equity market and also emphasized on the mediated role of the international exchange rate market, economic expansion, foreign trade volume between Chinese stock market and oil future prices. Findings indicated that oil future prices have directly and indirectly influenced the Chinese stock market through the mediation of selected macroeconomic transmission channels. Bagchi (2017) investigated the relationship between oil price volatility and variation in stock prices through the utilization of GARCH family models and found that volatility in oil prices plays a contributing role in stimulating variations across the stock market of emerging economies.
Mensi et al. (2020) investigated asymmetrical linkages between selected macroeconomic volatility, economic expansion, and banking system growth of Islamic economies. Authors have applied dynamic panel quantile regression analyses and found that oil exportation and appreciation in consumer price indexes positively influence the economic expansion. Furthermore, economies are classified into two categories: economies involved in the importation of oil and others that are exporting oil. Findings suggested that macroeconomic volatility only influences the economic development of oil exportation countries. Adjasi (2009) investigated the symmetrical linkages between oil price volatility along with other macroeconomic variabilities on stock indexes and found that a reduction in the volatility of Ghana stock prices is due to high volatility in oil prices. Rehman (2017) also found that currency value fluctuations and oil price volatility influences the dynamic correlational linkages between stock prices and implied volatility indexes. Jung et al. (Citation2020) identified asymmetrical causality between currency value fluctuations and oil prices by utilizing the NARDL modeling approach over the period 1982 to 2019. Chkir, Guesmi, Brayek, and Naoui (2020) analyzed dynamic linkages between oil prices, currency prices, and stock indexes of oil-producing and oil-importing economies through the utilization of the Vine Copulas technique. Results indicated that oil prices are inversely dependent upon currency value fluctuations and vice versa and oil prices cannot be regarded as a strong hedging tool against depreciative trends in currency fluctuations. In another relevant article, Mongi (2017) studied dynamic linkages between oil price volatility and stock indexes in the US context and found a significant relationship between both. Singhal et al. (Citation2019) employed symmetrical cointegration approaches by utilizing daily time-series data and the estimated negative association between oil prices and stock indexes in the case of Mexico. Ingalhalli et al. (2016) utilized granger causation to understand that either stock indexes, currency value fluctuations, and oil prices are granger causing each other. For the Pakistani context, Sheikh et al. (Citation2020) divided the whole time series into three regimes: before the economic crunch, after the financial crunch, and over the entire period, and found an asymmetrical impact of oil prices on stock indexes. However, this asymmetrical influence of oil price volatility on KSE-100 indexes is different for the three regimes.
In the existing literature, a number of research articles has explored symmetrical linkages between oil price volatility and stock indexes(Asad, Citation2011; Bagchi, 2017; Kisswani & Elian, 2017; Mongi, 2017; Roubaud & Arouri, 2018; Areli Bermudez Delgado et al., Citation2018; Husain et al., 2019; A. Mouna, Citation2019; Narayan, Citation2019; Nouira, Hadj Amor, & Rault, 2019) but limited efforts have been made to estimate oil price-stock price nexus asymmetrically (Kocaarslan & Soytas, Citation2019; Kumar, Citation2019; Charfeddine & Barkat, Citation2020; Chkir et al., 2020). explains that oil prices have suffered from both positive and negative shocks, however, the symmetrical model cannot be able to disintegrate oil prices into their respective positive and negative cumulative signs (Shin et al., Citation2014; Baz et al., Citation2019; Kumar, Citation2019; Rajesh, Citation2019; Salvatore, Citation2019; Awodumi & Adewuyi, 2020; Liang et al., Citation2020; Charfeddine & Barkat, Citation2020). Moreover, there is also the possibility that investors reacted to both positive and negative shocks unequally (Sheikh et al. Citation2020), hence building upon EMH and APT model, the following hypothesis is formulated;
H2: There is an asymmetrical relationship between Oil prices and stock indexes.
2.4. Symmetrical-asymmetrical relationship between exchange rate and stock indexes
Jung et al. (Citation2020) employed the NARDL model and asymmetrical granger causality approach to finding out whether exchange rate fluctuations are granger causing oil price volatility for shorter and longer horizons. Chkir et al. (2020) employed asymmetrical linkages between oil prices, stock indexes, and exchange rates for oil-exporting and importing economies and found weak support for oil price volatilities to be classified as a hedging tool against depreciating local currencies. Xie, Chen, and Wu (2020) utilized the asymmetrical granger causality approach by (Hatemi-J, Citation2012) and found that exchange rate fluctuations cannot be able to granger cause variations in stock prices. However, stock prices are granger causing variations in currency values. Authors have found an insignificant role of exchange rate fluctuation in asymmetrically granger causing stock prices. Singhal et al. (Citation2019) utilized a linear or symmetrical ARDL modeling approach to estimate symmetrical linkages between currency value fluctuations, gold prices, oil prices, and Mexican stock indexes over the period from January 2006–2018. Results indicated an inverse association between oil and stock prices and direct linkages between gold and stock prices. However, oil prices have an inverse impact on exchange rate fluctuations, but gold prices remained statistically insignificant. Sheikh et al. (2020) divided the time-series sample data into different types of regimes and found that exchange rate fluctuation asymmetrically impacts the stock indexes of KSE-100 indexes.
Jain and Biswal (2016) explored dynamic ties between international gold prices, oil price volatility, currency fluctuations, and stock indexes of the Indian stock exchange through the utilization GARCH family of models. Results revealed the direct impact of gold prices and oil price volatility on the exchange rate and stock prices. Hung (Citation2019) attempted to investigate the dynamism between currency value fluctuations and stock indexes in the European context by using constant conditional correlation and dynamic conditional correlational GARCH modeling approach over the period from 2000 to 2017. Moreover, the authors have also analyzed the transmission of volatility between currency fluctuations and stock indexes of central and eastern European context and found bidirectional transmission of volatility between currency fluctuations and stock indexes for Croatia, Hungary, and the Czech Republic. Neveen (Citation2018) studied the inter-relation between exchange rate and stock indexes in the context of the Mena region through employing symmetrical models like VECM and VECH-GARCH model to determine the volatility characteristics of exchange rate fluctuations and stock indexes. Results showed a nonlinear association between currency value fluctuations and stock prices during the pre-economic crunch regime and after the economic crisis regime. Roubaud and Arouri (2018) explored dynamic linkages between stock prices, currency fluctuations, and oil prices by utilizing a structural vector auto-regression approach and found dynamism between all underlying variables but linkages are regime dependent. Sikhosana and Aye (2018) explored volatility transmission between stock indexes and exchange rate fluctuations through employing the EGARCH modeling approach over the period from 1996 − 2016 in the South African context. Findings indicated the transmission of volatility shocks from exchange rate fluctuations towards stock prices and vice versa. In another relevant study and Indian context, Malepati and Naraya (2017) found a dynamic inter-relationship between the cost of borrowing, currency fluctuations, and stock indexes. However, Akbar et al. (Citation2019) found no co-integrating association for longer horizons between gold prices, currency values, interest rates, and stock indexes in the Pakistani context.
In the existing literature, the only symmetrical relationship between exchange rate fluctuations and stock indexes is explored (Arfaoui & Ben Rejeb, Citation2017; Lentina Simbolon & Purwanto, Citation2018; Hung, Citation2019; Hussain, 2019; Nouira et al., 2019; Singhal et al., Citation2019; Wei et al., 2019; Xie et al., 2020), and limited efforts were made to explore the asymmetrical impact of exchange rate fluctuations on stock indexes. Currency depreciation may have a negative effect on stock indexes because appreciative dollar prices against local exchange rates increase the producer prices and decrease profitability for organizations relying on imported products (Khalil et al., Citation2018). Therefore, local currency appreciation causes a positive effect on stock indexes and inverse relationships existed in the case of local currency depreciation. However (Bahmani-Oskooee & Saha, 2015, Bahmani-Oskooee & Saha, Citation2016) stated that local currency appreciation and depreciation do not have necessarily direct impact on stock indexes. This is a probability that favorable shocks to the local currency valuation could have a beneficial effect on equity prices. In the case of adverse shocks to the domestic currency or currency deflation, businesses may become immune to such shocks and will not raise their product’ costs to retain large market shares (Bahmani-Oskooee & Saha, 2015). Therefore, both positive and negative shocks have a dissimilar impact on stock indexes. This is called the asymmetrical impact of exchange rate fluctuation on stock indexes (Bahmani-Oskooee & Saha, Citation2016). Sheikh, Tabash and Asad (Citation2020) have also found that non-linear estimations techniques are more appropirate in establishing asymmetrical cannotations between currency values fluctuations and stock indexes in panel settings for the whole south asian region.
H3: there is an asymmetrical relationship between exchange rate fluctuation and stock indexes.
3. Data and research methodology
The purpose of this research article is to investigate the asymmetrical impact of currency value fluctuation, volatility in international crude oil prices, and gold prices on Bombay stock indexes for three selected regimes: pre-international economic crisis regime, post-crisis regime, and over the entire sample period from April 2003 to May 2020. Sample data on international gold prices, crude oil prices, and exchange rate fluctuations have been collected from investing.com and CIEC data repository.Footnote2 Monthly level time-series data on Bombay stock indexes (BSE_100 Indexes) have been incorporated from the Bombay stock exchange website. Monthly level time-series data on stock indexes, gold prices, oil prices, and exchange rate (USD/INR) have been divided into three regimes. The complete sample period is comprised of 208 observations from April 2003 to May 2020. Pre-economic crisis regime is comprised of 58 observations covering the period from April 2003 to January 2008 and post-crisis regime consists of 151 observations over the period from January 2009 to May 2020. The main purpose of dividing the time-series period into three different regimes is to scrutinize the asymmetrical impact of underlying regressors on stock prices for three multiple regimes. This classification of division is in line with (Ajaz et al., Citation2017; Andriansyah & Messinis, Citation2019; Hung, Citation2019; Neveen, Citation2018)
3.1. Research methodology
The Implementation of the asymmetrical modeling approach by Shin et al. (Citation2014) is very much similar to the symmetrical ARDL model purposed by (Pesaran et al., Citation2001); however, the main difference is the disintegration of stock indexes and exchange rate into their corresponding positive and negative shocks in case of NARDL model. The decomposition of both regressand, as well as regressor, cannot be possible in a symmetrical ARDL modeling approach. NARDL model can be applied when none of the variables is exhibiting nonstationary trends after first differencing, NARDL model can also be estimated when some of the variables are stationary at a level while other becoming stationary at first differencing, this means that we may have combinations of I (0) and I (1) variables in ARDL or NARDL equation. In this research article, we have utilized 4 different types of unit root tests such as Augmented dickey-fuller (ADF), Philips Peron (PP), KPSS (Kwiatkowski Philips Schmidt Shin), and Zivot Andrew unit root test for structural breakpoint analysis. Moreover, the BDS test is also utilized to estimate nonlinear dependencies in data sets. Estimation of the BDS testing approach furthermore helps us to analyze whether time series are identically and independently distributed or linearly dependent. The null hypothesis of the BDS test stated that time series have a linear dependency, and the alternative hypothesis stated that time series are not linearly dependent. If the value of BDS test statistics is less than critical valuesthen we cannot be able to reject the null hypothesis that time series are linearly dependent, and in this case, the ARDL modeling approach is more appropriate. The general form BDS test is given
is defined as the standard deviation of
The general form of symmetrical Error correction term is given
The general form of the linear ARDL model is represented by Equationequation 4c(4c)
(4c)
EquationEquation 4b(4b)
(4b) and Equation4c
(4c)
(4c) represents symmetrical ECT and linear ARDL modeling approach. In both equations, stock indexes of the Indian stock exchange are selected as regressand and exchange rate fluctuation, oil prices, and gold prices are selected as regressors. Short-run coefficient is represented by b and c, whereas ∆ is utilized as difference operator for both stock indexes and gold price, oil prices, and exchange rate fluctuations. The long run coefficient is represented by
and
. According to (Pesaran et al., Citation2001) if the value of F statistics is larger than upper bound and lower bound critical values then we can infer long-run co-integrating association (
≠
between macroeconomic fluctuations and stock indexes otherwise there exists no co-integration (
=
. One of the disadvantages of symmetrical ARDL modeling is that it is unable to disintegrate independent variables into positive and negative shocks so that we cannot be able to examine the nonlinear association between variables. In the case of the NARDL model by (Shin et al., Citation2014), stock indexes and gold prices, international crude oil prices, and exchange rates can be broken down into positive and negative shocks such as
In Equationequation 4d(4d)
(4d) , long-run asymmetrical coefficient is denoted by
and
respectively and
is epitomized as deviance from long-term equilibrium association, positive and negative shocks to regressors are represented in the following equation
Hence, fluctuations in the exchange rate, gold prices, oil prices, and stock index variability can be broken down in the following ways as purposed by (Shin et al., Citation2014)
As stated above, asymmetrical ECT is an extension of Equationequation 4b(4b)
(4b) and can be modified as is in Equationequation 4g
(4g)
(4g)
Asymmetrical NARDL model is an extension of Equationequation 4c(4c)
(4c) and can be written as
Long-term asymmetrical co-integration existed if the value of F statistics is greater than upper bound and lower bound critical values. Lower bound value is estimated for variables with no seasonality trends at level and upper bound critical values are estimated for variables becoming stationary at first differencing. Hence, regressor and regressand should not be becoming stationary at second difference. Moreover, in case of a mixture of I (0) and I (1) variables, F statistics should be greater than upper bound critical values and if F statistics fall in between upper bound and lower bound then asymmetrical error correction term is utilized for investigating the long-term asymmetrical association between stock indexes and macroeconomic volatility. Wald test statistics are utilized for the asymmetrical impact of macroeconomic fluctuations on stock indexes for shorter and longer horizons
≠
(only in case of the significant and negative value of ECT). Wald test statistics is also computed to examine the symmetrical association between regressors and Bombay stock exchange indexes for shorter
and longer horizons (
=
) (Baz et al., Citation2019; Charfeddine & Barkat, Citation2020; Jung et al., Citation2020; Kumar, Citation2019; Liang et al., Citation2020; Rajesh, Citation2019; Salvatore, Citation2019; Shahzad et al., Citation2017)
4. Results
The results section is divided into five parts: the first section deals with descriptive statistics of sample data. The second section deals with testing for nonlinearity within time series by using the BDS test of nonlinearity. The third and fourth sections deals with the detection of seasonality effects in time-series data and converting stationarity in data into nonstationary, respectively. The fifth sections deal with the estimation of the nonlinear NARDL model with asymmetrical Wald test statistics.
represents descriptive statistics of three different regimes such as over the entire sample period, pre-crisis, and post-crisis regime. After comparing descriptive statistics in with , it is revealed that the standard deviation of all independent and dependent variables is greater in port crisis regime than SD of gold prices, oil prices, exchange rate fluctuations, and stock indexes in the Pre-crisis regime. In comparison to the pre-economic recession, these fundamental responses and predictor variables more profoundly deviated from their respective mean values in the post-economic recession regime. In comparison, the maximum USD value against the INR during a pre-crisis period is lower than during the post-crisis era, which suggests that India’s rupee has seen a greater post-crisis depreciative tendency. Moreover, gold prices, oil prices, and stock indexes have also experienced greater maximum values after the economic crisis regime.
confirms that the NARDL model is an appropriate choice for estimating asymmetrical fluctuation of macroeconomic volatility on stock indexes. The null hypothesis of the BDS test is rejected for gold prices, exchange rate fluctuations, oil prices, and stock indexes which confirms the evidence of nonlinearity within time-series data (Brock et al., 1996). The null hypothesis is rejected as the value of BDS test statistics is greater than critical values. This stated that time series are not independent or identically distributed.
presents the results of unit root estimation by utilizing the Augmented Dickey–Fuller test (ADF), Philips Peron (PP), and Kwiatkowski Philips Schmidt Shin (KPSS) unit root. Estimation of the unit-roots approach confirms that all regressors, as well as regressand, are becoming stationary after differencing 1 time, for example, at the level they are exhibiting seasonality trends, but after differencing 1 time, they all have converted into stationary; moreover, it is also confirmed that none of the variables is integrated of second order or I (2). However, the Zivot Andrew unit root test (see ) shows that all regressors are stationary at level but regressand has become stationary after first differencing. So according to ADF, PP, and KPSS, we have variables integrated in the same order but according to ZA unit root, we are having a mixture of I (0) and I (1) variables.
Table 5. ADF unit root test
Table 6. PP unit root test
Table 7. KPSS unit root test
Table 8. ZA Unit root test
and confirms the presence of structural breaks for exchange rate fluctuation, gold prices, oil prices, and stock indexes, however, all regressors are stationary at level but Bombay stock indexes exhibit seasonality trends at the level and became stationary after differencing 1 time.
Figure 3. Structure breakpoint unit root graphical representation for stock indexes, exchange rate, gold prices and oil prices
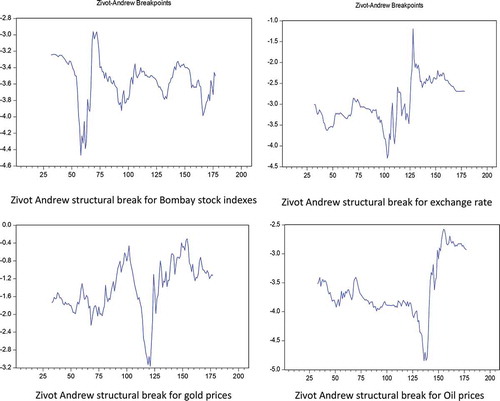
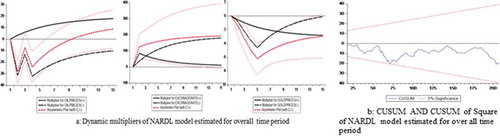
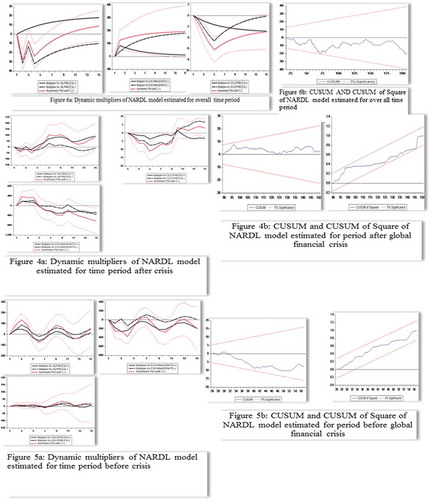
Four different types of structural breakpoints have been identified through estimating the Zivot Andrew unit root test, and for that purpose, four different types of binary dummy variables will be included in the simple regression model (0LS) and most significant dummy variables are retained for NARDL model estimation. In the existing literature, several researchers have adopted the same methodology in case of identification of more than one structural breakpoint (Kocaarslan & Soytas, Citation2019; Tehreem, 2018; Sheikh et al., 2020). Estimation of multiple unit root tests and BDS tests for nonlinearity confirms the suitability to utilize the NARDL model for the nonlinear co-integrating association between macroeconomic volatility and stock indexes. presents the results of the NARDL model for the time period before the global economic crisis, after the economic crunch, and over the entire sample period from April 2003 to May 2020.
Table 9. NARDL (1, 0, 4, 3, 5, 1, and 0) model before crisis regime
Table 10. NARDL model after crisis regime
Table 11. NARDL (1, 0, 4, 0, 3, 1, and 0) model over the entire sample period from 2003 to 2020
reports the results of the NARDL model for estimating the asymmetrical association between international oil price, gold prices, exchange rate fluctuations, and Bombay stock indexes. Results have reported an asymmetrical relationship between all underlying regressors and Bombay stock indexes for shorter and longer horizons. Before the global financial crisis and for longer horizons, investors have only reacted to negative shocks associated with gold prices, oil prices, and exchange rate fluctuations. However, in the short run and before the economic crunch regime, only positive shocks to gold and oil prices have a direct influence on Bombay stock indexes, and only negative shocks to exchange rate fluctuation have an indirect association with Bombay stock indexes. This means local currency appreciation has a positive influence on Bombay stock indexes in the shorter and longer run during the pre-crisis regime. One of the greatest possibilities of a positive relationship between local currency appreciation and stock indexes is the reliance of the local economy on imports rather than exports (Chkir et al., 2020). An increase in dollar value against the Indian rupee causes producer prices to move in an upward direction and causes depreciation in profitability for firms relying on imported products for manufacturing their finished goods (Jain & Biswal, 2016). However, the depreciation of the dollar against the Indian rupee causes local currency appreciation and this scenario is profitable for organizations relying on exports rather than imports (Xie et al., 2020).
Before the global financial crisis, the Indian economy is proved to import centric economy rather than export-oriented. The negative relationship between exchange rate fluctuation and stock indexes is in line with (Arfaoui & Ben Rejeb, Citation2017; Kumar, Citation2019). also reports results for the nonlinear ECT term, which is negative and significant. This validates long-run asymmetrical association between regressors and regressand. Appropriate NARDL model is selected on the basis of the Akaike information criterion and all residual diagnostics such as the Durbin–Watson test, Breusch Pagan test, and Ramsey Reset test confirmed that the model is free from heteroscedasticity, autocorrelation, and miss-specifications.
reports the results of the NARDL model estimated for the period after the global financial crisis and the entire sample period, respectively. Unlike the impact of exchange rate fluctuations on Bombay stock indexes before the crisis, after the global economic recession, and for longer horizons, both positive and negative shocks to exchange rate fluctuation have no impact on Bombay stock indexes. However, both positive and negative shocks to international gold prices and only positive shocks to international oil price volatility are value relevant for investors for longer horizons. Appreciation in positive (negative) shocks to gold prices causes depreciation (appreciation) in Bombay stock indexes. This means that investors are reacting equally to both positive and negative shocks to gold prices after the economic recession regime and in the long term. In the short run and after the global financial crisis, investors reacted to only negative shocks associated with gold and oil prices, and negative shocks to exchange rate fluctuations remain statistically insignificant.
furthermore reports that the NARDL model is free from autocorrelation, heteroscedasticity, and misspecification bias. The value of error correction model (−0.21) estimated for a time period after economic recession regime depict that there exist an asymmetrical association between stock indexes, oil prices, gold prices and exchange rate fluctuations as the model is attaining long-term equilibrium at the particular speed of 21% per month. Wald test statistics confirms that there is the existence of long-run asymmetries for oil prices and stock indexes in long term and asymmetrical association exists between all regressors and stock indexes for shorter horizons.
are also divided into three parts: the first part explains the asymmetrical long-run association between regressors and regressand and the second part explains short-run asymmetrical impact of gold prices, oil prices, and exchange rate fluctuations on stock indexes. The third part is related to residual diagnostics which explains that all three models of NARDL estimated for a time period of pre-crisis, after the crisis, and for overall timespan is free from model misspecification bias, autocorrelation, heteroscedasticity. Moreover, reports that only positive shocks of exchange rate fluctuations are having a positive impact on stock indexes in the longer run. This means that currency devaluations lead towards an appreciative impact on Bombay stock indexes. As we have already explained while interpreting the result of , currency devaluation is much favorable for organizations relying on exports rather than import-centric firms (Akbar et al., Citation2019).
Some firms earning profitability by selling their product to external economies and earn foreign exchange in place of their exported goods, while import-oriented businesses rely on imported goods for manufacturing purposes (Kassouri & Altıntaş, 2020). Currency depreciation increases the profitability of exported centric economies and decreases the profitability of those firms utilizing imported raw materials for finished goods. In the long run, short-run, and over the entire period from 2003 to 2020, investors have only reacted to positive shocks of exchange rate fluctuations and did not consider negative shocks to exchange rate fluctuations as value relevant. However, over the entire sample period and for both shorter and longer horizons, only negative shocks to oil prices formulated a direct relationship with stock indexes and positive shocks to oil prices remain statistically insignificant. The negative relationship of oil prices with stock indexes is in line with (Kollias, Kyrtsou, & Papadamou, 2013; Sahu et al., Citation2014; Arfaoui & Ben Rejeb, Citation2017; Bagchi, 2017; Areli Bermudez Delgado et al., Citation2018; Khalil et al., Citation2018; Kocaarslan & Soytas, Citation2019; Wei et al., 2019; Chkir et al., 2020). and 4b, and 5b, and 6b reports dynamic multipliers of disintegrated variables and shows that the estimated NARDL model is stable for post-crisis, pre-crisis, and over the entire sample period.
Figure 4. (a) Dynamic multipliers of NARDL model estimated for time period after crisis. (b) CUSUM and CUSUM of square of NARDL model estimated for period after global financial crisis
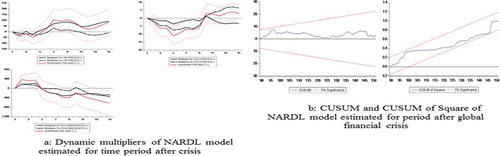
Figure 5. (a) Dynamic multipliers of NARDL model estimated for time period before crisis. (b) CUSUM and CUSUM of square of NARDL model estimated for period before global financial crisis
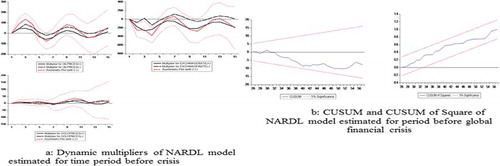
Figure 6. (a) Dynamic multipliers of NARDL model estimated for overall time period. (b) CUSUM and CUSUM of square of NARDL model estimated for over all time period
5. Discussion, theoretical and practical contribution
In long run and before the global financial crisis, only negative shocks associated with exchange rate fluctuation, gold prices, and oil prices are value relevant for investors as investors give much importance to episodes of currency devaluations and positive shocks associated with gold prices and oil prices. Positive shocks to exchange rate fluctuations means that dollar prices appreciated against local rupee value, which can be a favorable outcome for economies relying on exports rather than import centric economies (Alkhuzaie & Asad, Citation2018; Asad et al., Citation2019; Asad & Qadeer, Citation2014; Keswani & Wadhwa, Citation2018). However, after the economic crunch, both positive and negative fluctuations in exchange rates remain no longer value relevant for investors.
After an economic crisis regime and in the long run, both positive and negative shocks to gold prices formulated an inverse relationship with Bombay stock indexes, and only positive shocks to oil prices have a direct impact on stock indexes. This means that the government, investors, and other stakeholders should emphasize on the relevant regime in which they are doing investments, rather than considering only past values.
According to the NARDL model estimated results for the overall period, only positive shocks to exchange rate fluctuations and negative shocks to oil prices have a direct association with stock indexes. Moreover, the Indian economy was relying on imports before the global financial crisis but in the wake of the crisis, their reliance on imports has been changed. However, for the longer term, overall results indicated that local currency devaluation (Positive shocks to USD against INR) is favorable for stock indexes of the Bombay stock exchange because of the export-oriented economy of India. These results are inconsistent with NARDL results computed for the period after the crisis. This information is also value relevant for the government to give importance to both positive and negative shocks to dollar values because there is an asymmetrical relationship between currency fluctuations and stock indexes when the overall timeframe is selected, and for the period before the crisis regime. Another important practical contribution poses for the government of India that before the global financial crisis and for longer and shorter horizons, negative fluctuations in dollar values against the local Indian rupee are having an inverse relationship with the Bombay stock index. This means that local currency appreciation plays a contributing role in providing potential benefits to local importers because appreciation in local currency generates beneficial consequences for Bombay stock indexes. However, for shorter and longer horizons during the entire sample period, and in the short run after the crisis, currency depreciation has a positive outcome for stock indexes. These confirmations claim that the Indian economy is export centric and the government should consider this for making Bombay stock indexes more resilient against exchange rate fluctuations.
This research is also relevant for academicians to consider the period while finding out possible linkages between stock indexes, oil prices, gold prices, and exchange rate fluctuations. Another theoretical contribution is added to existing literature that there is the asymmetrical or nonlinear association between variables which are assumed to be linear by (Sahu et al., Citation2014; Shiva & Sethi, Citation2015; Tehreem, 2018; Keswani & Wadhwa, Citation2018; Neveen, Citation2018; Rajesh, Citation2019). Moreover, in existing literature few researchers have utilized arbitrage pricing theory to explain symmetrical connotations between macroeconomic fluctuations and stock indexes (Christofi et al., Citation1993; Günsel et al., Citation2009; Mollick & Nguyen, Citation2015; Saumya, Citation2012; Shahzad et al., Citation2017; Yan & Yang, Citation2016) while others have utilized EMH (Wickremasinghe, Citation2011; Hatemi-J, Citation2012; Singhania & Prakash, Citation2014; Othman et al., 2019). This research article has validated the arbitrage pricing theory and refuted a semi-strong version of an efficient market hypothesis by establishing an association between gold prices, oil prices, and currency value fluctuations but in a nonlinear way.
6. Conclusions, future research directions and limitations
The purpose of this research article is to explore asymmetrical co-integrating linkages between selected variables such as international crude oil volatility, gold prices, exchange rate fluctuations, and Bombay stock indexes. Findings suggested that before the global financial crisis and in long run, Indian shareholders have considered only negative shocks to exchange rate fluctuation, gold prices, and oil prices as value relevant and did not put much emphasis on the positive fluctuations of these variables. For both longer and shorter horizons and before the international economic recession 2008 regime, appreciation in local currency formulated a positive impact on stock indexes, this designates that the Indian economy is relying on income generated from imported products. This is generally because local currency appreciation might be helpful for businesses relying on imported products for manufacturing their finished goods. Therefore, local currency appreciation may be able to meet positive outcome for these importers and causes a positive impact on Bombay stock indexes. This shows that local currency appreciation is not harmful to Bombay stock indexes because of the increased profitability of local importers.
In contrast to results estimated for the pre-crisis regime, in the long run, and after the global financial crisis, both positive and negative fluctuations in exchange rate fluctuations remain statistically insignificant. This means that import centric dynamics of the Indian economy has been changed due to this crisis. In the long run and after the global financial crisis, investors only reacted to positive and negative shocks to gold prices and only positive shocks to oil price fluctuations. This is not the case during the period before the international economic recession. This shows that the global financial crisis has affected the asymmetrical long-run co-integrating linkages between regressors and regressand.
6.1. Limitations and future research directions
One of the greatest limitations of this research article is that it has only considered the top 100 organizations concerning their capitalization registered at the Bombay stock exchange for analysis and selected BSE-100 indexes as regressand. Future research should be concluded by considering Nifty 50 or BSE-Sensex of the top 30 well-established firms registered at the Bombay stock exchange by estimating the NARDL model individually for every firm. Future research should also be concluded on the whole South Asian region by utilizing Panel-based NARDL model to investigate nonlinear linkages between oil-gold-exchange rates and stock indexes of the region.
Cover Image
Source: Author.
Additional information
Funding
Notes on contributors
Muzaffar Asad
Muzaffar Asad has completed his PhD in entrepreneurship from Malaysia and is now associated with the University of Bahrain as Assistant Professor. Previously, he has served Foundation University Islamabad as Associate Professor and the University of Central Punjab, Lahore as Assistant Professor. He is a renowned trainer of entrepreneurship and leadership.
Mosab I. Tabash
Mosab I. Tabash is the program director for Master of Business Administration at college of business, Al Ain University, UAE.
Umaid A. Sheikh
Umaid A. Sheikh is an expert in econometrics and is having interest in exploring symmetrical and asymmetrical linkages between macroeconomic and stock indexes.
Mesfer Mubarak Al-Muhanadi
Mesfer Mubarak Al-Muhanadi is Assistant Professor and Chairman of Management and Marketing Department in College of Business Administration, University of Bahrain. He has completed his PhD in Banking and Finance from University of Salford, United Kingdom. [email protected]
Zahid Ahmad
Zahid Ahmad is working as a Professor in the Faculty of management sciences, University of central Punjab. He also holds a PhD degree in Accounting and Finance
Notes
1. In this research article, authors have taken UD dollar values against Indian rupee because US dollars are international currency and most of shareholders used to value fluctuations in USD. Positive shock to USD to Indian rupee means that international currency is appreciated against local currency which lead towards local currency devaluation.
2. https://www.ceicdata.com/en
References
- Abbas, G., McMillan, D. G., & Wang, S. (2017). Conditional volatility nexus between stock markets and macroeconomic variables: Empirical evidence of G-7 countries. Journal of Economic Studies, 45(1), 77–30. doi:10.1108/JES-03-2017-0062
- Abdel-Latif, H., Osman, R. A., & Ahmed, H. (2018). Asymmetric impacts of oil price shocks on government expenditures: Evidence from Saudi Arabia. Cogent Economics & Finance, 6(1), 1512835. https://doi.org/10.1080/23322039.2018.1512835
- Ajaz, T., Nain, M. Z., Kamaiah, B., & Sharma, N. K. (2017). Stock prices, exchange rate and interest rate: Evidence beyond symmetry. Journal of Financial Economic Policy, 9(1), 2–19. https://doi.org/10.1108/JFEP-01-2016-0007
- Akbar, M., Iqbal, F., & Noor, F. (2019). Bayesian analysis of dynamic linkages among gold price, stock prices, exchange rate and interest rate in Pakistan. Resources Policy, 62(1), 154–164. https://doi.org/10.1016/j.resourpol.2019.03.003
- Al-hajj, E., Al-Mulali, U., & Solarin, S. A. (2018). Oil price shocks and stock returns nexus for Malaysia: Fresh evidence from nonlinear ARDL test. Energy Reports, 4(1), 624–637. https://doi.org/10.1016/j.egyr.2018.10.002
- Alkhuzaie, A. S., & Asad, M. (2018). Operating cashflow, corporate governance, and sustainable dividend payout. International Journal of Entrepreneurship, 22(4), 1–9.
- Almansour, A. Z., Asad, M., & Shahzad, I. (2016). Analysis of corporate governance compliance and its impact over return on assets of listed companies in Malaysia. Science International, 28(3), 2935–2938.
- Al‐Rjoub, S. A. M., & Azzam, H. (2012). Financial crises, stock returns and volatility in an emerging stock market: the case of Jordan, stock returns and volatility in an emerging stock market: the case of Jordan. Journal of Economic Studies, 39(2), 178–211. doi:10.1108/01443581211222653
- Anderson, H. D., Balli, F., & Godber, C. (2018). The effect of macroeconomic announcements at a sectoral level in the US and European Union. Research in International Business and Finance, 44, 256–272.
- Andriansyah, A., & Messinis, G. (2019). Stock prices, exchange rates and portfolio equity flows: A Toda-Yamamoto Panel Causality Test. Journal of Economic Studies, 46(2), 399–421. https://doi.org/10.1108/JES-12-2017-0361
- Anisak, N., & Mohamad, A. (2019). Foreign Exchange Exposure of Indonesian Listed Firms. Global Business Review, 0972150919843371. Global Business Review10.1177/0972150919843371 4 doi:10.1177/0972150919843371
- Areli Bermudez Delgado, N., Bermudez Delgado, E., & Saucedo, E. (2018). The relationship between oil prices, the stock market and the exchange rate: Evidence from Mexico. The North American Journal of Economics and Finance, 45(1), 266–275. https://doi.org/10.1016/j.najef.2018.03.006
- Arfaoui, M., & Ben Rejeb, A. (2017). Oil, gold, US dollar and stock market interdependencies: A global analytical insight. European Journal of Management and Business Economics, 26(3), 278–293. https://doi.org/10.1108/EJMBE-10-2017-016
- Asad, M. (2010). Perception of Trader towards international trade: A diagnostic study. Paradigms A Journal of Commerce, Economics, and Social Sciences, 4(1), 48–63. https://doi.org/10.24312/paradigms040103
- Asad, M. (2011). Working capital management and corporate performance of textile sector in Pakistan. Paradigms: A Research Journal of Commerce, Economics and Social Sciences, 6(1), 100–114. https://doi.org/10.24312/paradigms060101
- Asad, M., Ahmad, I., Haider, S. H., & Salman, R. (2018). A critical review of islamic and conventional banking in digital era: A case of Pakistan. International Journal of Engineering & Technology, 7(4.7), 57–59. https://doi.org/10.14419/ijet.v7i4.7.20382
- Asad, M., & Farooq, A. (2009). Factors influencing KSE 100 index/share prices. Pardigms A Journal of Commerce, Economics, and Social Sciences, 3(1), 34–51. https://doi.org/10.24312/paradigms030102
- Asad, M., Iftikhar, K., & Jafary, A. Y. (2019). Relationship between capital structure and financial performance of textile sector companies. Kashmir Economic Review, 28(1), 39–52.
- Asad, M., & Qadeer, H. (2014). Components of working capital and profitability: A case of fuel and energy sector of Pakistan. Pardigms A Journal of Commerce, Economics, and Social Sciences, 8(1), 50–64. https://doi.org/10.24312/paradigms08010
- Athukorala, P., & Chongvilaivan, A. (2010). The Global Financial Crisis and Asian Economies: Impacts and Trade Policy Responses. ASEAN Economic Bulletin, 27(1), 1–4. http://www.jstor.org/stable/41317106 doi:10.1355/AE27-1A
- Badry, H. (2019). Can conventional energy be replaced by renewable energy without harming economic growth in non-oil-MENA? Evidence from Granger causality in VECM. World Journal of Entrepreneurship, Management and Sustainable Development, 15(2), 159–168. https://doi.org/10.1108/WJEMSD-11-2018-0098
- Bahmani-Oskooee, M., & Saha, S. (2016). Do exchange rate changes have symmetric or asymmetric effects on stock prices? Global Finance Journal, 31(1), 57–72. https://doi.org/10.1016/j.gfj.2016.06.005
- Baz, K., Xu, D., Ampofo, G. M. K., Ali, I., Khan, I., Cheng, J., & Ali, H. (2019). Energy consumption and economic growth nexus: New evidence from Pakistan using asymmetric analysis. Energy, 189, 116254. https://doi.org/10.1016/j.energy.2019.116254
- Bhargava, A. (2014). Firms’ fundamentals, macroeconomic variables and quarterly stock prices in the US. Journal of Econometrics, 183(2), 241–250.. doi:10.1016/j.jeconom.2014.05.014
- Chandra, A. (2012). Cause and effect between FII trading behaviour and stock market returns: The Indian experience. Journal of Indian Business Research, 4(4), 286–300. https://doi.org/10.1108/17554191211274794
- Charfeddine, L., & Barkat, K. (2020). Short- and long-run asymmetric effect of oil prices and oil and gas revenues on the real GDP and economic diversification in oil-dependent economy. Energy Economics, 86(1), 104680. https://doi.org/10.1016/j.eneco.2020.104680
- Chiu, C., Harris, Richard D.F.., Stoja, E., & Chin, M. (2018). Financial market Volatility, macroeconomic fundamentals and investor Sentiment. Journal of Banking & Finance, 92, 130–145.
- Choi, S., Salam, M. A., & Lee, K.-D. (2019). The nature of exchange rate movements and exchange rate exposure: The Bangladesh case. Journal of South Asian Development, 14(2), 180–222. https://doi.org/10.1177/0973174119853446
- Christofi, A. C., Christofi, P. C., & Philippatos, G. C. (1993). An application of the arbitrage pricing theory using canonical correlation analysis. Managerial Finance, 19(3/4), 68–85. https://doi.org/10.1108/eb013718
- Chronopoulos, D. K., McMillan, D. G., Papadimitriou, F. I., & Tavakoli, M. (2018). Insider trading and future stock returns in firms with concentrated ownership levels. European Journal of Finance. https://doi.org/10.1080/1351847X.2019.1487312–225 doi:10.1080/1351847X.2018.1487312
- Enns, A., Eldridge, G. D., Montgomery, C., & Gonzalez, V. M. (2018). Perceived stress, coping strategies, and emotional intelligence: A cross-sectional study of university students in helping disciplines.Nurse Education Today.68(06),012. doi:10.1016/j.nedt.2018.06.012
- Fan, W., Fang, S., & Lu, T. (2014). Macro-factors on gold pricing during the financial crisis. China Finance Review International, 4(1), 58–75. https://doi.org/10.1108/CFRI-09-2012-0097
- Floros, C., & Vougas, D. V. (2008). The efficiency of Greek stock index futures market. Managerial Finance, 34(7), 498–519. https://doi.org/10.1108/03074350810874451
- Ghulam, A. (2018). Conditional volatility nexus between stock markets and macroeconomic variables. Journal of Economic Studies, 45(1), 77–99. https://doi.org/10.1108/JES-03-2017-0062
- Günsel, N., Türsoy, T., & Rjoub, H. (2009). The effects of macroeconomic factors on stock returns: Istanbul stock market. Studies in Economics and Finance, 26(1), 36–45. https://doi.org/10.1108/10867370910946315
- Hatemi-J, A. (2012). Asymmetric causality tests with an application. Empirical Economics, 43(1), 447–456. https://doi.org/10.1007/s00181-011-0484-x
- Ho, S.-Y. (2018). Macroeconomic determinants of stock market development in South Africa. International Journal of Emerging Markets, 14(2), 322–342. https://doi.org/10.1108/IJoEM-09-2017-0341
- Huang, Z., Tong, C., Qiu, H., & Shen, Y. (2018). The spillover of macroeconomic uncertainty between the U.S. and China. Economics Letters, 171(1), 123–127. https://doi.org/10.1016/j.econlet.2018.07.018
- Hung, N. T. (2019). Spillover effects between stock prices and exchange rates for the central and Eastern European Countries. Global Business Review, 0972150919869772. https://doi.org/10.1177/0972150919869772
- Husain, S., Tiwari, A. K., Sohag, K., & Shahbaz, M. (2019). Connectedness among crude oil prices, stock index and metal prices: An application of network approach in the USA.Resources Policy, 62(03). doi:10.1016/j.resourpol.2019.03.011
- Inoguchi, M. (2014). The Impact of External Shocks on Stock Prices in the East Asian Domestic Banking Sector. In Risk Management Post Financial Crisis: A Period of Monetary Easing (Vol. 96, pp. 6–97). Emerald Group Publishing Limited. doi:10.1108/S1569-375920140000096004
- Jung, Y. C., Das, A., & McFarlane, A. (2020). The asymmetric relationship between the oil price and the US-Canada exchange rate. The Quarterly Review of Economics and Finance, 76(1), 198–206. https://doi.org/10.1016/j.qref.2019.06.003
- Keswani, S., & Wadhwa, B. (2018). an empirical analysis on association between selected macroeconomic variables and stock market in the context of BSE. The Indian Economic Journal, 66(1–2), 170–189. https://doi.org/10.1177/0019466219876492
- Khalil, R., Asad, M., & Khan, S. N. (2018). Management motives behind the revaluation of fixed assets for sustainability of entrepreneurial companies. International Journal of Entrepreneurship, 22(Special), 1–9.
- Kocaarslan, B., & Soytas, U. (2019). Asymmetric pass-through between oil prices and the stock prices of clean energy firms : New evidence from a nonlinear analysis. Energy Reports, 5(1), 117–125. https://doi.org/10.1016/j.egyr.2019.01.002
- Kumar, R., & Vashisht, P. (2009). The Global Economic Crisis: Impact on India and Policy Responses. ADBI Working Paper 164. Tokyo: Asian Development Bank Institute. http://www.adbi.org/working-paper/2009/11/12/3367.global.economic.crisis.india/
- Kumar, S. (2019). Asymmetric impact of oil prices on exchange rate and stock prices. The Quarterly Review of Economics and Finance, 72(1), 41–51. https://doi.org/10.1016/j.qref.2018.12.009
- Lardic, S., & Mignon, V. (2008). Oil prices and economic activity: An asymmetric cointegration approach. Energy Economics, 30(3), 847–855. https://doi.org/10.1016/j.eneco.2006.10.010
- Liang, C. C., Troy, C., & Rouyer, E. (2020). U.S. uncertainty and Asian stock prices: Evidence from the asymmetric NARDL model. The North American Journal of Economics and Finance, 51(1), 101046. https://doi.org/10.1016/j.najef.2019.101046
- Lin, B., & Chen, Y. (2019). Dynamic linkages and spillover effects between CET market, coal market and stock market of new energy companies: A case of Beijing CET market in China. Energy, 172, 1198–1210. https://doi.org/10.1016/j.energy.2019.02.029
- Makin, A. J. (2019). Lessons for macroeconomic policy from the Global Financial Crisis. Economic Analysis and Policy, 64, 13–25. doi:10.1016/j.eap.2019.07.008
- McMillan, D. (2012). Does non-linearity help us understand, model and forecast UK stock and bond returns: evidence from the BEYR, model and forecast UK stock and bond returns: evidence from the BEYR. International Review of Applied Economics, 26(1), 125–143. doi:10.1080/02692171.2011.580268
- McMillan, D. (2017). Stock return predictability: the role of inflation and threshold dynamics. International Review of Applied Economics, 31(3), 357–375. doi:10.1080/02692171.2016.1257581
- McMillan, D. G. (2020). Explaining the stock-stock, bond-bond and stock-bond correlation across countries, bond-bond and stock-bond correlation across countries. International Journal of Monetary Economics and Finance, 13(5), 429–445. doi:10.1504/IJMEF.2020.110553
- MengYun, W., Imran, M., Zakaria, M., Linrong, Z., Farooq, M. U., & Muhammad, S. K. (2018). Impact of terrorism and political instability on equity premium: Evidence from Pakistan.Physica A: Statistical Mechanics and its Applications.2017 2017 492.11.095 doi:10.1016/j.physa.2017.11.095
- Mishkin, F. (2002). US stock market crashes and their aftermath: implications for monetary policy, Working Paper 8992. Cambridge, MA: National Bureau of Economic Research
- Mollick, A., & Nguyen, K. H. (2015). U.S. oil company stock returns and currency fluctuations. Managerial Finance, 41(9), 974–994. https://doi.org/10.1108/MF-02-2014-0029
- Mouna, A. (2019). Transmission of shocks between Chinese financial market and oil market. In B.-A. Mouna (Ed..), International journal of emerging markets: Vol. ahead-of-p (Issue ahead-of-print). https://doi.org/10.1108/IJOEM-07-2017-0244
- Muhammad, U., & Gang, S.. (2015). Country risk, stock prices, and the exchange rate of the renminbi. Journal of Financial Economic Policy, 7(4), 366–376. doi:10.1108/JFEP-11-2014-0073
- Muthukumaran, T., Raja, A. S., & Palanichamy, P. (2011). Impact of global financial crisis on indian stock market — an analytical study. Asia Pacific Business Review, 7(2), 5–12. https://doi.org/10.1177/097324701100700201
- Narayan, P. K. (2019). Can stale oil price news predict stock returns? Energy Economics, 83(1), 430–444. https://doi.org/10.1016/j.eneco.2019.07.022
- Neveen, A. (2018). The effect of the financial crisis on the dynamic relation between foreign exchange and stock returns: Empirical evidence from MENA region. Journal of Economic Studies, 45(5), 994–1031. https://doi.org/10.1108/JES-10-2017-0308
- Pandey, V., & Vipul. (2018). Volatility spillover from crude oil and gold to BRICS equity markets. Journal of Economic Studies, 45(2), 426–440. https://doi.org/10.1108/JES-01-2017-0025
- Patel, S., and Sarkar, A. (1998). Crises in Developed and Emerging Stock Markets. The Federal Reserve Bank of New York. New York, NY. doi:10.2469/faj.v54.n6.2225
- Peiró, A. (2016). Stock prices and macroeconomic factors: Some European evidence.International Review of Economics & Finance.41(08), 004. doi:10.1016/j.iref.2015.08.004
- Pesaran, M. H., Shin, Y., & Smith, R. J. (2001). Bounds testing approaches to the analysis of level relationships. Journal of Applied Econometrics, 16(3), 289–326. https://doi.org/10.1002/jae.616
- Rajesh, S. (2019). Dynamism between selected macroeconomic determinants and electricity consumption in India. International Journal of Social Economics, 46(6), 805–821. https://doi.org/10.1108/IJSE-11-2018-0586
- Rexford, A. (2019). Corporate performance volatility and adverse macroeconomic conditions. In Journal of Financial Economic Policy: Vol. ahead-of-p (Issue ahead-of-print). https://doi.org/10.1108/JFEP-11-2018–0158
- Sahu, T. N., Bandopadhyay, K., & Mondal, D. (2014). An empirical study on the dynamic relationship between oil prices and Indian stock market. Managerial Finance, 40(2), 200–215. https://doi.org/10.1108/MF-06-2013-0131
- Salvatore, C. (2019). The long-run interrelationship between exchange rate and interest rate: The case of Mexico. Journal of Economic Studies, 46(7), 1380–1397. https://doi.org/10.1108/JES-04-2019-0176
- Saumya, R. D. (2012). Investor sentiment, risk factors and stock return: Evidence from Indian non‐financial companies. Journal of Indian Business Research, 4(3), 194–218. https://doi.org/10.1108/17554191211252699
- Shahzad, S. J. H., Mensi, W., Hammoudeh, S., Sohail, A., & Al-Yahyaee, K. H. (2019). Does gold act as a hedge against different nuances of inflation? Evidence from Quantile-on-Quantile and causality-in- quantiles approaches. Resources Policy, 62, 602–615. https://doi.org/https://doi.org/10.1016/j.resourpol.2018.11.008
- Shahzad, S. J. H., Nor, S. M., Ferrer, R., & Hammoudeh, S. (2017). Asymmetric determinants of CDS spreads: U.S. industry-level evidence through the NARDL approach. Economic Modelling, 60(1), 211–230. https://doi.org/10.1016/j.econmod.2016.09.003
- Shakil, M. H., Mustapha, I. M., Tasnia, M., & Saiti, B. (2018). Is gold a hedge or a safe haven? An application of ARDL approach. Journal of Economics, Finance and Administrative Science, 23(44), 60–76. https://doi.org/10.1108/JEFAS-03-2017-0052
- Sheikh, H. U. (2018). Financial and non-financial determinants of Asian automobile stock prices. Accountancy Business and the Public Interest, 17(1), 142–162. http://visar.csustan.edu/aaba/ SheikhChaudhryMukhtar2018.pdf
- Sheikh, U., Mukhtar, U., Asad, D. M., & Ahmed, D. Z. (2020). Asymmetrical relationship between oil prices, gold prices, exchange rate and stock prices during global financial crisis 2008; evidence from Pakistan. Cogent Economics & Finance. https://doi.org/10.1080/23322039.2020.1757802
- Sheikh, U. A., Asad, M., Ahmed, Z., & Mukhtar, U. (2020). Asymmetrical relationship between oil prices, gold prices, exchange rate, and stock prices during global financial crisis 2008: Evidence from Pakistan. Cogent Economics and Finance, 8(1). https://doi.org/10.1080/23322039.2020.1757802
- Sheikh, U. A., Asad, M., Israr, A., Tabash, M. I., & Ahmed, Z. (2020). Symmetrical co-integrating relationship between money supply, interest rates, consumer price index, terroristic disruptions and Karachi stock exchange: Does global financial crisis matter? Cogent Economics & Finance. https://doi.org/10.1080/23322039.2020.1838689
- Shin, Y., Yu, B., & Greenwood-Nimmo, M. (2014). modelling asymmetric cointegration and dynamic multipliers in a nonlinear ARDL Framework BT - Festschrift in honor of peter schmidt: Econometric methods and applications. In R. C. Sickles & W. C. Horrace, Eds. (pp. 281–314). Springer. https://doi.org/10.1007/978-1-4899-8008-3_9
- Shiva, A., & Sethi, M. (2015). understanding dynamic relationship among gold price, exchange rate and stock markets: Evidence in Indian context. Global Business Review, 16(5_suppl), 93S–111S. https://doi.org/10.1177/0972150915601257
- Simbolon, L., & Purwanto. (2018). The influence of macroeconomic factors on stock price: The case of real estate and property companies. In Global tensions in financial markets (Vol. 34, pp. 2–19). Emerald Publishing Limited. https://doi.org/10.1108/S0196-382120170000034010
- Singhal, S., Choudhary, S., & Biswal, P. C. (2019). Return and volatility linkages among International crude oil price, gold price, exchange rate and stock markets: Evidence from Mexico. Resources Policy, 60, 255–261. https://doi.org/10.1016/j.resourpol.2019.01.004
- Singhania, M., & Prakash, S. (2014). Volatility and cross correlations of stock markets in SAARC nations. South Asian Journal of Global Business Research, 3(2), 154–169. https://doi.org/10.1108/SAJGBR-04-2012-0056
- Spilioti, S. N. (2016). Does the sentiment of investors explain differences between predicted and realized stock prices? Studies in Economics and Finance, 33(3), 403–416. doi:10.1108/SEF-11-2014-0218
- Tabash, M. I., Sheikh, U. A., & Asad, M. (2020). Market miracles: Resilience of Karachi stock exchange index against terrorism in Pakistan. Cogent Economics & Finance, 8(1), 1821998. https://doi.org/10.1080/23322039.2020.1821998
- Tuna, G. (2018). Interaction between precious metals price and Islamic stock markets. International Journal of Islamic and Middle Eastern Finance and Management, 12(1), 96–114. https://doi.org/10.1108/IMEFM-06-2017-0143
- Wen, X., Bouri, E., & Roubaud, D. (2017). Does oil product pricing reform increase returns and uncertainty in the Chinese stock market? The Quarterly Review of Economics and Finance. https://doi.org/10.1016/j.qref.2017.08.003
- Wickremasinghe, G. (2011). The Sri Lankan stock market and the macroeconomy: An empirical investigation. Studies in Economics and Finance, 28(3), 179–195. https://doi.org/10.1108/10867371111141954
- Wu, S.-J., & Lee, W.-M. (2015). Predicting severe simultaneous bear stock markets using macroeconomic variables as leading indicators. Finance Research Letters, 13, 196–204. doi:10.1016/j.frl.2015.01.003
- Yan, H., & Yang, S. (2016). Research on convertible bond pricing efficiency based on nonparametric fixed effect panel data model. China Finance Review International, 6(1), 32–55. https://doi.org/10.1108/CFRI-04-2015-0030
- You, W., Guo, Y., Zhu, H., & Tang, Y. (2017). Oil price shocks, economic policy uncertainty and industry stock returns in China: Asymmetric effects with quantile regression. Energy Economics, 68(1), 1–18. https://doi.org/10.1016/j.eneco.2017.09.007
- Zhang, T., Du, T., & Li, J. (2019). The impact of China’s macroeconomic determinants on commodity prices. Finance Research Letters, 101323. https://doi.org/10.1016/j.frl.2019.101323