
 ?Mathematical formulae have been encoded as MathML and are displayed in this HTML version using MathJax in order to improve their display. Uncheck the box to turn MathJax off. This feature requires Javascript. Click on a formula to zoom.
Abstract
In this article, the co-movement between GCC and US stock market returns was investigated using the wavelet coherence method. The Dynamic Conditional Correlation GARCH (DCC-GARCH) modelling is then applied on time-varying components in order to provide a point of comparison with the results extracted from wavelet analysis. The investigation was conducted on the weekly stock index prices of two USA stock markets, namely Dow Jones and S&P 500 and six GCC stock markets, namely the United Arab Emirates, Saudi Arabia, Qatar, Oman, Kuwait, and Bahrain. The data were retrieved from Thomson Reuters’s data stream and the sample duration was from 7 January 2007 to 24 June 2018. As a result, a definite co-movement between several GCC stock markets and those of the US stock markets for a long term was found. Moreover, the results also displayed signs of the significant disparity between the co-movements of the stock markets throughout the scales of time during economic decline. This phenomenon was possibly expected during the economic decline, where a significant divergence occurred as opposed to co-movement. The implications of the findings for global investors were considerable due to the indication from long-term co-movement that these investors would not be capable of gaining simultaneous profit from time and portfolio being diversified. In fact, the results showed the major difference in the opportunities for international portfolio diversification throughout these markets in terms of scale and time.
PUBLIC INTEREST STATEMENT
Despite the differences among countries, financiers have effectively started to use the trade financial instruments of the same standard and similar networks around the world. Hence, financial markets across the world have demonstrated a higher tendency to build “one single market” without borders. Therefore, it is necessary for investors to pay high attention to the evaluation of this co-movement due to the superior method of evaluating portfolio risk. The current study aims to scrutinize the dynamic co-movement between the stock market returns for the developing stock markets of the gulf cooperation council (GCC) and those of the US. This evaluation aims to provide helpful insights not only to local GCC investors but also to arbitrageurs who are interested in venturing into subjects related to GCC.
1. Introduction
As a result of increasing globalization, the financial markets across the world have demonstrated a higher tendency to build “one single market” without borders. Despite the differences among countries, financiers have effectively started to speak the same language, and use the trade financial instruments of the same standard and similar networks around the world (Basdas, Citation2012). It could be said that the importance of this interdependence among stock markets is a result of its dominant role in the decision-making process of various parties. While considerable benefits have been provided by the interconnected market, such as lower costs, higher flexibility, and more choices, more naïve market participants are reluctant to invest due to its fragile structure. Another observation gained on the interconnected market is that prominent economies are places that gain the attention of portfolio capital and investors. Additionally, the low cost of a transaction is one of the advantages of this global assimilation and secure economic relation between countries. These elements would definitely contribute to positive impacts on stock market activities in the long run. Alternatively, this assimilation would possibly result in economic fragility over time. It is an impact that may be detrimental to stock markets on the global level, making it a disadvantage (Çelik & Baydan, Citation2015).
There is no doubt that the co-movements between stock market indices pose crucial effects on the evaluation of portfolio risk and the implementation of financial policy and investment decisions. In respect of risk management, Rua and Nunes (Citation2009) highlighted that lower gains stem from a stronger co-movement between the assets of a portfolio. Therefore, it is necessary for investors to pay high attention to the evaluation of this co-movement due to the superior method of evaluating portfolio risk. Naturally, policy-makers believe that the value of such co-movements between stock markets is dependent on the level of cooperation between the authorities involved in these markets. In other words, whenever stock markets are closely interconnected, there is a higher risk of unprecedented spread of market to others (e.g., Birău & Trivedi, Citation2013; Răileanu-Szeles & Albu, Citation2015; Samarakoon, Citation2011; Siminică & Birău, Citation2014). On the other hand, the investigation on the independence and co-movement between stock markets also proved the significant indirect beneficial effects acquired from countries which unite, especially the effects on US market and other developing markets (Choudhry, Citation2004). Co-movement was evaluated in previous studies by examining the non-overlapping sample durations or the correlation coefficient of rolling window (e.g., Brooks & Del Negro, Citation2004; Lin et al., Citation1994). Alternatively, several studies used a wavelet squared coherency, therefore, the significant international co-movement of stock returns between the developed markets was demonstrated (e.g., Rua & Nunes, Citation2009).
Generally, whether the growing and arising financial markets are able to contribute to financial and economic development has become the topic of in-depth argument in the works of finance literature. Furthermore, economic development and financial growth were found to be positively related to each other. Samarakoon (Citation2011) argued that US financial shocks pose the impact of driving interdependence, while the emerging markets lead to contagion to the US. Subsequently, there are three current standard classifications of stock markets according to the MSCI global index, namely the frontier, emerging, and developed markets. To be specific, Saudi Arabia, Qatar, and the UAE are the emerging markets, while Oman, Bahrain, and Kuwait are classified as frontier markets. Naturally, the emerging stock markets are considered as less productive compared to the developed markets due to several factors, such as their long-term structural uncertainties, frequent rounds of significant decline and growth, informational frictions, asymmetric volatility, and extreme functional fluctuations.
In recent decades, the reformation of global stock markets has been structural in nature. It is based on cross-border contracts, exchange control, derivatives, lack of restrictions on investment policy, the diversification of international portfolios, and the general liberalization of financial operations (Birău & Trivedi, Citation2013). Any study of the integration of global stock markets usually focuses on various economic and financial theories. Keynes (Citation1936) highlighted the impacts of stock markets on the cost of equity, concluding that the interrelationship between stock markets and equity cost was enhanced. Therefore, it could be concluded that economic development was positively related to financial growth. For this reason, it was indicated that with positive economic performance, the same performance would be displayed by the stock market in the aspect of returns and profits (De Gregorio & Guidotti, Citation1995; Kirman, Citation1992). Notably, it is believed that the empirical information developed in studies lead to potential improvements in conditional volatility estimates. The improvements hold value in particular financial applications, such as option pricing, value at risk, portfolio optimisation, and optimal hedging (Awartani & Maghyereh, Citation2013).
This research would assist global investors through the diversification of their portfolios, which are related to Markowitz modern portfolio theory in 1952. The contribution is added with a clearer understanding of the development of markets and institutions, effective price discovery, and further information on investment and economic progress, which lead to higher savings. Furthermore, Markowitz’s portfolio optimization theory was applied particularly in the investor’s decisions of asset allocation in the past. In this case, the investor decides to invest in assets, which could either be stocks, bonds or real estate. Aiming to solve optimization problems, the investor needs to utilize quantitative data to construct the stock portfolio. Additionally, the capital assets pricing model (CAPM) can be appraised to elaborate on the integration among stock markets (Sharpe (Citation1964), Lintner (Citation1965), and Mossin (Citation1966)).
This study mainly aims to scrutinize the dynamic co-movement between the stock market returns for the developing stock markets of the gulf cooperation council (GCC) and those of the US. This evaluation aims to provide helpful insights not only to local GCC investors but also to arbitrageurs who are interested in venturing into subjects related to GCC. Wavelet coherence analysis was applied as this technique enabled investors, particularly arbitrageurs, to obtain useful information regarding markets in the relevant regions. Due to the importance of obtaining new and detailed comprehension regarding the degree of global stock market assimilation, a three-dimensional analysis of wavelet coherency was implemented. With this analysis, it was possible to determine the particular regions in a unified time interval-frequency band space where the diversification of two stock markets was present simultaneously. Additionally, a relatively low gain of portfolio diversification was present.
The contents of this article are organised as follows: the second section comprises the review of literature, while the research methodology is presented in the third section. In the fourth section, an analysis of data is presented, followed by empirical findings in the fifth section. Lastly, this article ends with the sixth section which presents the implications of policy.
2. Literature review
It is commonly known that a stock market movement within a country is influenced by the movement of either other stocks in other regions or countries, as proven in the empirical evidence presented in the literature (Alagidede & Mensah, Citation2016; Jiang & Yoon, Citation2020). In fact, a wide range of co-movements of stock markets between various countries was proven in several works of research (R. Ali et al., Citation2020; Meng & Huang, Citation2019; Mensi, Citation2019). Hyeongwoo et al. (Citation2015) studied the spillover effects resulted from the economic decline of the US on developing Asian countries. Meanwhile, it was proposed in Alagidede and Mensah (Citation2016) research on Africa’s emerging stock market that there was a diverse degree of interdependence throughout the time. Besides, the interdependence was low in African markets. On the other hand, K. Wang et al. (Citation2011) found that the Chinese market had a high level of interdependence with the Japanese and Pacific markets.
It was also concluded in the previous studies by G. Lee and Jeong (Citation2016) on the co-movement between Southeast Asian countries that five ASEAN founding countries exhibited a high co-integration degree. Therefore, they were capable of maintaining a higher degree of short-term interdependence when a negative shock, such as an economic decline, ended. Furthermore, the co-movement of 14 stock markets, namely TSEC, SSMI, SSE, RTS, NIKKI, NASDAQ, MXX, KSE (Korea), KSE, JKSE, Hang Seng, FTSE -100, BSE, and BVSP was investigated by Patel (Citation2017). As a result, it was shown in the correlation analysis that the BSE had a constant positive relation with Hang Seng (0.45), FTSE-100 (0.32), MXX (0.27), NASDAQ (0.24), and BVSP (0.23). Moreover, it was found from a Granger causality test that the returns for BSE were influenced by BVSP, FTSE-100, and MXX only. The Johansen cointegration test also showed that a long-term association was present between several stock markets. Majid and Shabri (Citation2018) employed the Granger causalities based on Vector Error Correction Model (VECM) to investigate the main Islamic stock markets of Indonesia, Japan, the UK, and the US. As a result, all of these markets were found to progress towards closer integration. It was also evident that the Japanese Islamic stock market affected the Indonesian Islamic stock market as a co-mover in comparison with the stock markets of the UK and the Islamic stock markets in the US in the multivariate and bivariate frameworks. Yao et al. (Citation2018) used a normalized index to examine the effects of China’s financial liberalization policies on the assimilation of its stock market, specifically its impact on the rest of the world during from the year 2000 to 2015. As a result, their study proved a closer integration of the Chinese markets with global markets. Despite major fluctuations, QFII, QDII, and RQFII were particularly found to have constant beneficial influences on market integration. However, certain other policy reforms posed negative effects. Some de jure policy reforms, such as the RMB exchange rate liberalisation, posed fluctuating effects based on market conditions.
Ghosh and Kanjilal (Citation2016) examined the non-linear co-integration between international crude oil prices and the Indian stock market in a multivariate framework. Long-run equilibrium relationships between the variables were rejected for the entire data span. To further investigate this co-integration, threshold cointegration tests were conducted on three sub-phases, namely prior phase (phase I), post phase (phase III), and the most uneven phase (phase II). The tests were taken from 2 July 2007 to 29 December 2008. As a result, cointegration only occurred in phase III. Additionally, the Toda–Yamamoto version of the Granger causality tests indicated that the movements of international crude oil prices clearly had an effect on the stock market of India in phases II and III without any impacts of feedback. The test results also exogenously identified the cost of global crude oil.
2.1. Co-movement globally with wavelet approach
R. Ali et al. (Citation2020) investigated the co-movement between the Canadian credit default swaps market, the Stock market and volatility index (TSX 60 Index); the study employed the wavelet approach to present results in short-term, medium-term, long-term, and very long time. The wavelet co-movement results in the short-term and long-term were negative, while this relationship in the medium-term and very long-term period was strongly positive. Meng and Huang (Citation2019) investigated the co-movement characteristics of effective exchange rates across frequencies and over time, the wavelet approach was employ to analyze the daily data from four Asian economies. Rua and Nunes (Citation2009) investigated the international co-movement of stock market returns by employing wavelet analysis. Using the same method, Graham and Nikkinen (Citation2011) observed this co-movement in the Finnish and international stock markets. In respect of the spillover effects in diverse time-scales, Fernandez (Citation2005) examined the markets from the year 1990 to 2002 in the Pacific region, North America, G7 countries, Latin America, the developing Far East and Asia regions, Eastern Europe and the Middle East, and Western Europe. Meanwhile, spillover effects were found from the G7 countries to other sample countries, and an insignificant association was present in other regions with G7 countries in various scales of time. Furthermore, Gallegati (Citation2012) employed wavelet analysis to the indices of the stock market of G7 countries, namely Brazil and Hong Kong. It was predictable that the contagion across global markets was present during the subprime crisis in the US. Gallegati concluded that although this impact of financial contagion is usually scale-dependent, it is not homogenous across the scales. Moreover, Jiang et al. (Citation2017a) implemented a novel approach in their study of the fluctuation of co-movement and volatility between the stock markets in the Association of Southeast Asian Nations (ASEAN) countries. Three-dimensional continuous wavelet transforms (CWT) was applied on the daily stock market returns which took place from 2009 to 2016. This included the estimates of the degree of interdependence and lag-lead association among the participants of the ASEAN trading link. As a result, stronger interdependence in these markets could be seen in the short term, which was predicted especially after external shocks. It was found from the Variational Modes Decomposition (VMD)-based copula estimation that the effects of an economic shock on the stock markets’ degree of co-movement lasted within a short term, with a reduction for over two years. This effect was also applied to the ASEAN trading link establishment. Notably, a strong basic interdependence was only present in Indonesia and Malaysia. It could be constantly seen from the CWT and Copula methods that in comparison with other members of ASEAN trading link, the interdependence degree was the lowest in Vietnam, while this degree was the highest in Indonesia. This result was in contrast to the empirical evidence which was previously obtained through conventional approaches.
After a contagion and interdependence investigation was conducted on the Asia-Pacific region’s major equity market using wavelet decomposition, Dewandaru et al. (Citation2016) found that shocks were usually transferred through fundamental connections. This approach had simultaneous impacts on equity markets. The highlights of their analysis revealed that fundamental contagion appeared through negative external shocks, such as the subprime crisis. In a similar study, Shahzad et al. (Citation2017) examined contagion and interdependence in the equity markets of Greek and Europe. As a result, a rapid rise in the stock market co-movement could be seen through the short-run dependency during the global economic decline. Furthermore, the same authors (2016) implemented wavelet squared coherence analysis to investigate interdependence and contagion among the industry-level credit markets in the US. As a result, in comparison with other industries, the highest degree of interdependence was seen in the basic materials (Utilities) industry credit market, while the utility industry credit market had the lowest degree of interdependence. The cyclical effect was transferred from this market to all other industries.
The co-movement of stock markets in Africa’s stock markets on the regional and global level was tested by Boako and Alagidede (Citation2017) using the three-dimensional continuous Morlet wavelet transform methodology. With this method, a segmental analysis was conducted on the co-movements with global markets, bilateral rates of exchange in US dollars and euros, and Africa’s four regional markets. As a result, it was proven that stronger co-movements were significantly reduced to short-run fluctuations. Besides being diverse in time and not homogeneous, the co-movements consisted of phase difference arrow vectors, indicating lead-lag associations. It was possible for the lead-lag impacts and significant co-movements at short-term fluctuations to result in arbitrage. They would also contribute to diversification outcomes for local and international investors who held long-term investment horizons. It was also shown in their research that several equity markets in Africa were resistant from the rapid changes of the euro and dollar exchange rates. This implied that international investors were recommended to add more variation to their portfolio investments across these markets with no concern regarding the impacts of the rapidly changing prices. Additionally, Saâdaoui et al. (Citation2017) investigated the dynamic association between the Islamic and conventional stock markets by conducting causality, cross-correlation, and wavelet-assisted cross-spectral analyses. As a result, it was clearly demonstrated that conventional and Islamic indexes were highly dependent on each other at a low-frequency and instability. This dependence occurred in the finest frequencies across diverse time horizons of investment time. It also had a different appearance during the periods of crisis in comparison to the calm periods. In contrast, indexes had the highest correlation during many periods and frequencies in the developed markets. However, they had a less significant association with the developing markets, especially for short-term horizons. For this reason, investors were provided with various investment alternatives and chances for portfolio diversification. It was proposed in the pre- and post-crisis causality investigations at the end of the research that a bidirectional association was present in most cases. With this, further perceptions of multivariate forecasting were offered.
2.2. Co-movement in the GCC with the wavelet approach
Jiang and Yoon (Citation2020) explored the dynamic co-movement between oil and six stock markets (China, India, Japan, Saudi Arabia, Russia, and Canada) by using two types of wavelet analysis (wavelet multi-scale decomposition and wavelet coherence). Mensi (Citation2019) examines the portfolio risk management and dynamic co-movements between crude oil and Saudi sector stock markets using wavelet approach and a Value at Risk measure. The results show significant co-movements between crude oil and stock sectoral markets over time and across frequencies. In Masih et al. (Citation2010) study on GCC stock markets, a wavelet tool was used to evaluate the systematic risk via the “beta parameter”. As a result, a multiscale tendency could be seen from the beta coefficients in all GCC markets on average. This finding was in agreement with the theoretical argument where stock market investors consist of diverse time horizons as their trading strategies are different, which could be indicated from the GCC market attributes. Akoum et al. (Citation2012) conducted an analysis on the long- and short-term dependencies among OPEC basket oil returns and GCC markets which spanned from 2002 to 2011 through the wavelet squared coherence method. It was emphasised that there was no significant relationship between oil and stock returns. Besides, there was an increase in the market dependencies after 2007 and an improvement in the profits of portfolio diversification in the short-term chances provided for investors. Furthermore, Aloui and Hkiri (Citation2014) investigated the stock market returns for the GCC countries in terms of long- and short-term dependencies. This investigation was according to wavelet squared coherence, enabling the evaluation of the movements in time-frequency spaces. It was shown from the results that there was an increase in the association between the GCC stock markets during the economic decline. Besides, in comparison with long-term investors who were challenged with decreased diversification benefits, an improvement was present in the portfolio benefits for short-term investors.
In the analysis of co-movement between the sukuk in GCC countries and sharia-compliant stocks, the wavelet squared coherency approach was applied by Aloui et al. (Citation2015) in daily data. With this approach, the GCC global, corporate and financial service sukuk indexes, and GCC sharia stocks were covered. Furthermore, it was clear that sharia stocks and sukuk indexes were highly dependent on each other. However, a fluctuation in the level of strength of this co-movement occurred throughout frequency and time. Notably, the fluctuation was the most significant in the long term. Alaoui et al. (Citation2015) examined the dynamics of co-movement on various scales of time or horizons of the Islamic Dubai Financial Market (DFM-UAE) index returns. This investigation involved their counterpart regional Islamic index returns, including Global Sukuk, Emerging Countries index, Developing Countries index, ASEAN index, and the GCC index. Additionally, an investigation was also conducted on the effects of the LIBOR on Islamic DFM-UAE returns. As a result, the DFM_UAE and GCC and Saudi markets were intersected with a similar degree of rapid changes and risk as to the Global Sukuk index. A significant non-homogeneous relationship was present between the scales for diverse durations. A contagion impact with a higher relation and interdependence within a delayed duration was present in closer markets. In fact, a flight to the Sukuk market with lower risks was evident mainly during the final phase of the economic decline. There was a tendency for the lead-lag analysis to imply that the GCC led to DFM-UAE, which resulted in Sukuk. Notably, this research emphasised the significance of the overnight LIBOR when the Islamic stock indices returned. Besides being the case, which took place in major transitions or shocks, policy implications for the variation of the portfolio among international investors were implied.
Aloui et al. (Citation2018) also investigated the relationship between the index of sharia stock and three Islamic bond yields in the GCC Islamic financial markets. Currently, this research involved the wavelet multiple-wavelet cohesion, cross-correlation, and correlation. As a result, a marked fluctuating pattern was present in the dynamic association between sharia stocks and Islamic bond yields in the aspect of time-frequency. Besides, the short horizons, which were proven to have a significant positive relation to a negative linkage, were determined for larger time-scales. Nasreen et al. (Citation2020) this study examines the connectedness between the sukuk- and shariah-compliant stock indices in the GCC financial markets, bivariate and multivariate wavelet approaches are applied. The sukuk bond–shariah stock index returns in the GCC at a multiscale level makes it easier for financial agents dealing with heterogeneous trading horizons to assess the benefits of diversifications.
Based on the previous section in literature, most of previous GCC studies focus on the association between the GCC stock markets only without any linkage with global markets. Due to the importance of obtaining new and detailed comprehension regarding the degree of global stock market assimilation. This study respond to the integration of global stock markets focuses on various economic and financial theories by examining the dynamic co-movement between the stock market returns for the developing stock markets of the GCC and those of the US stock markets.
3. Methodology
Various approaches were applied to examine the co-movement between stock markets. These approaches were performed by modelling the integration, co-movement, and contagions among financial markets in an equilibrium framework using VAR and Causality model (Awartani & Maghyereh, Citation2013; Bekhet & Matar, Citation2013a). However, an alternative branch of studies had modelled this relationship in the form of a single equation model (Bekhet & Matar, Citation2013b, Citation2013c; Boutabba, Citation2014; Lau et al., Citation2014; Matar & Bekhet, Citation2015; Matar, Citation2016).
The wavelet coherence method had been implemented in a number of studies to analyse the economic and financial series of time. To be specific, a formal and thorough elaboration of this approach was made in the research conducted by Torrence and Compo (Citation1998), Ramsey and Lampart (Citation1998), Grinsted et al. (Citation2004), and Rua and Nunes (Citation2009). Furthermore, the theories of market integration were used in other works of research (Bekaert & Harvey, Citation1995; Black, Citation1974; Cooper & Kaplanis, Citation2000; Errunza & Losq, Citation1985; Eun & Janakiramanan, Citation1986; Hardouvelis et al., Citation2006; Stulz, Citation1981) so that the potential timescale-dependency to the procedures of integration could be introduced. This was due to the investor’s portfolio, which comprised assets with different time of investment. It was clear that the overall portfolio return referred to the amount of these individual elements in total (Lehkonen & Heimonen, Citation2014).
In the current study, the co-movements between the GCC time series of stock market indices and the US index were investigated according to the wavelet approach. The Dynamic Conditional Correlation GARCH (DCC-GARCH) modelling is then applied on time-varying components to comprehend the dynamic correlation among the stock markets returns. The study employed the DCC-GARCH technique in order to provide a point of comparison with the results extracted from wavelet analysis.
3.1. Wavelet coherence
With a wavelet analysis, a time series could be separated into frequency elements. While the Fourier analysis has a full ability of representation and decomposition of stationary time series, the research could be conducted with a non-stationary time series through wavelets. Furthermore, wavelets promote the conservation of time for localized information, enabling co-movement to be measured in the time-frequency space. Wavelet analysis is based on the wavelet transform, where changes occur in the signal or time series with the assistance of functions known as wavelets. Moreover, it plays a role as a small wave consisting of the starting and ending points. When these waves are manipulated through its accurate motion and a squeezing or stretching process, a non-stationary and complex signal could be depicted as the elements of frequency that go through localisation in time. The wavelet analysis decompose a time series into highly specified time scales, rather than the blunt categorizations of short-term dynamics and long-term trends of traditional methods, such as error-correction models and co-integration relationships. And wavelet analysis also permits to retain relevant variable information that would be lost with traditional methods by taking differences of data. The wavelet transform is a mathematical instrument that ensure a time-scale presentation of a signal in the time domain and is generally utilized to determine the place of the mutation point in non-stationary signals (Karlsson et al., Citation2018). There is a wide range of the functions of wavelet, which is continuous and discrete. Rua and Nunes (Citation2009) developed a new wavelet-based measure of co-movement, which enables the examination of co-movement at the degree of frequency and over the time domain. This new measure enables changes to occur in the level of co-movement to be measured over duration and frequencies. This spectral analysis provides a more unified framework by incorporating the time dependence aspect of the co-movement between stock market.
This study investigates the co-movement of the developing time-varying stock market, placing a specific focus on the US investors. It is clear that as an extension of the Fourier analysis, wavelets offer several beneficial attributes for data to be decomposed and filtered to various frequencies. When the data are filtered, diverse layers of return would be enabled. These layers consist of the overall number of returns, instead of a simple investigation on the returns during various points of time. Additionally, wavelet analysis offers practical information at the same time for time and frequency on different length scales. This technique provides a balance of time and frequency localization. The Morlet wavelet gives the position, density, and frequency of the wavelet spectral peaks, as well as information on the variation time of the stream flow series (Wang et al., Citation2018). In order to indicate frequency-dependent behavior for examining the co-movements between the GCC time series of stock market indices and the US index, a multi-scale decomposition method can be used as a natural framework. This method provides a natural insight for frequency-dependent behavior in order to reveal the co-movements between the GCC time series of stock market indices and the US index. However, there has been an insufficient observation on wavelet in the field of economics and finance, with several exceptions (Basdas, Citation2012).
Wavelet analysis is originally a time-series analysis. It consists of three types of analysis. The first type appears with the w(t) function. It also consists of two properties, namely zero mean and unit energy:
According to Ramsey and Lampert (Citation1998), Rua and Nunes (Citation2009), and Aloui and Hkiri (Citation2014), the progressive wavelet transform over a discreet series of time is presented by the following equation:
Based on the equation, u refers to the scale, while s represents the position of time. * stands for a complex conjugate. The primary benefit of the wavelet transform is its capability of decomposition. The x(t) was then reconstructed as follows:
The main advantage of the wavelet transform was the energy conserved during the chosen series of time. This feature was used to analyse the power spectrum, which described the variance as the following equation:
To examine the cross-correlation behaviour during the time period and frequency, the wavelet square coherence was applied through the introduction of the first cross-wavelet transformation. This was followed by Torrence and Compo (Citation1998) second wavelet squared coherence, as presented in models (6) and (7), respectively.
The cross-wavelet transforms consisted of the series of time for two stock indices. The indices were represented through x(t) and y(t), with wx(u, s) and wy(u, s) transforming progressively. Based on the equation above, u represents the position index, while s stands for the scale. Meanwhile, * refers to the complex conjugate. Eventually, the wavelet squared coherence, known as wavelet coherence, was implemented for the measurement of the coherence of the cross wavelet transform in the time-frequency space. The wavelet equation applied in this study is shown in Equationequation (7)(7)
(7) . It could be defined as the following equation:
The wavelet coherence could be considered as a correlation coefficient with the value ranging from 0 to 1, s denoting time and the smoothing parameter over time. In respect of “no smoothing” case, the wavelet coherence would be equivalent to 1. Furthermore, the squared wavelet coherence coefficient was within the 0 ≤ R2 (u, s) ≤ 1 range and amounted near to 0. If R2 (u,s) reaches 1, then the time series tested variables are correlated with a certain scale as defined in section 4 with red color. On the other vein, if R2 (u,s) approaches 0, it indicates that there is no correlation between tested variables as shown in blue area on the next section. Overall, wavelet coherence is a suitable instrument to evaluate the stock market co-movement throughout time (Aloui & Hkiri, Citation2014: Orhan et al., Citation2019).
3.2. The DCC-GARCH technique
The DCC-GARCH model was developed by Engle (Citation2002). This model helps in discovering the conditional correlation among the financial time series through estimation of historical correlations and conditional volatilities. It decomposes the conditional covariance into two dynamic components, a conditional standard deviation matrix, and a standard deviation, as shown below:
accounts for time-varying conditional correlation of standardized innovations
In the DCC-GARCH technique, Ht should be a positive definite matrix. As Dt follows the structure of a positive definite matrix in its positive diagonal entries, Rt must adhere to the typical properties of a positive definite matrix having elements less than or equal to one. Rt can be decomposed as follows:
is a diagonal matrix given by:
transforms the elements of Vt so that the following equation holds:
and estimated as follow:
The parameters (α, β) are non-negative and estimated to represent the DCC. The model exhibits mean-reverting behavior if α + β < 1, where α and β represent short-run and long-run persistence, respectively.
4. Data and analysis
The weekly stock index prices for two USA stock markets, namely Dow Jones and S&P 500 were investigated. The similar investigation was performed on six GCC stock markets, namely the United Arab Emirates (U.A.E.), Saudi Arabia, Qatar, Bahrain, Oman, and Kuwait. Weekly markets returns were utilised in this research to prevent the disparity between public holidays and the trading hours in GCC and the US markets from overlapping. Stock prices were adopted from Thomson Reuters data stream, with the sample period spanning from 7 January 2007 to 24 June 2018 for 599 weekly costs in overall. Stock indices were denominated in the domestic currency of the countries they belong to. Notably, several major world events were included in the research period. Examples of the events were the outstanding rise in oil cost throughout 2007 and early 2008, the global financial collapse which followed in late 2008 and early 2009, the progressing recovery of the global markets in 2010, and the recent gulf political crisis taken place in Qatar and other gulf countries in 2017.
One of the main advantages of the wavelet coherence method is its prevention from the necessity of separating the sample into various periods of sub-sample for the analysis of co-movement during the time of crisis. This method may be used to determine structural breaks during the occurrence of a complete breakdown in correlation or when the relevant frequency band is shifted. However, the decision to apply the cut-off point for the segregation of times of crisis could be prevented. Furthermore, wavelet coherence co-movement across all of the sample periods may be viewed with this method in addition to the concentrations of co-movement throughout the time. This process does not require the identification of the economic decline starting point and segregation of data before and during the time of crisis. The following section of this article presents the progressive compounded returns (R), which are represented as follows:
illustrates the descriptive statistics for the stock market returns. It is noteworthy that the positive mean returns are present in most stock markets, with Bahrain as an exception due to negative returns. The highest degree of standard deviation could be seen from Kuwait’s stock market, while the lowest degree of standard deviation was present in the Bahrain market. In accordance with previous empirical evidence, negative market skewness occurred in most stock market returns. To be specific, negative skewness could be seen from Oman at −1.2811. Meanwhile, positive market skewness was present in Kuwait at 17.5451. Furthermore, excessive kurtosis was observed in all stock market returns, where the highest degree of kurtosis was present in Kuwait at 310.5567. On the other hand, the degree of kurtosis was 7.4653, which was the lowest degree. presents the unconditional correlation between the GCC and US stock markets. It was found that the Qatari stock market had the most significant relationship with US stock markets, while the lowest relation could be seen from the Kuwaiti stock market. Moreover, the degree of association of the Oman, Bahrain, Saudi Arabia, and United Arab Emirates stock markets with the US markets ranged from 0.0753 to 0.2182. The GCC stock markets had a higher degree of association with the Dow Jones stock market, in comparison to the association between GCC stock market and the S&P stock market. Based on the descriptive statistics shown in the table, the Kuwaiti stock market displayed the most unpredictable phenomenon among the GCC stock markets. These statistics were confirmed by the association between the GCC stock markets and US stock markets, in which the lowest degree of association was seen in the Kuwait stock market with both US stock markets. Similarly, the most unpredictable phenomenon found in Aloui and Hkiri (Citation2014) study was the Kuwait stock market in comparison to the GCC stock markets.
Table 1. Descriptive statistics for the stock market returns
Table 2. Correlation matrix
5. Analysis results
In order to evaluate the co-movements of GCC and the US stock markets, wavelet analysis was conducted on all the possible country pair. In addition, the time-varying DCC-GARCH has been applied to return series of selected stock markets. The following sections furnish the results of each method.
5.1. Results of wavelet coherence analysis
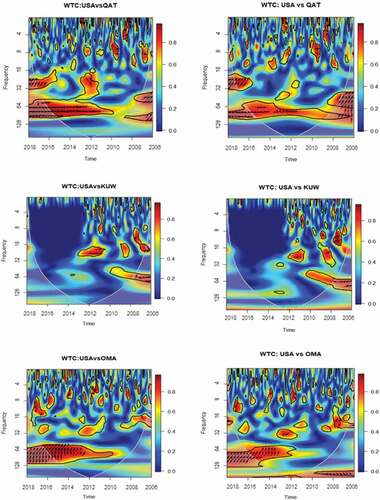
Wavelet analysis appeared in the form of a contour plot and three dimensions in various colours so that the results could be easily observed. In the wavelet coherence plot, the duration, which spanned from 2007 to 2018, is represented by the horizontal axis. Meanwhile, the domain of frequency, which ranged from 1 week to 256 weeks, is represented by the vertical axis, and a scale of 128 periods was selected, since the dataset covers the period of 2007–2018 (weekly data, 599 observation). In respect of each band of time and frequency, colour gradation indicates the level of co-movement (strong or weak). On the other hand, the arrow directions indicate the causation (leading or lagging) and the nature of the relationship (positive or negative). Through these plots, the wavelet coherence of the time-frequency domain between the US region and each country is displayed. Furthermore, each plot could be regarded as a heat map. The level of co-movement was reflected through the plots in the time-frequency domain of a certain stock market with other regions’ stock market. In respect of the heat maps, their colour codes ranged from light/blue to dark/red, each representing low and high degrees of power. Overall, the rise in the wavelet squared coherency value was reflected from the colour codes. This would also indicate the co-movements, which ranged from weak to strong.
Moreover, the darker regions indicated a stronger co-movement, while the lighter regions indicated a weaker co-movement. Various areas in each plot indicated the degree of the mutual movement from the two series during each duration and various frequency bands. For instance, if the top-left-hand side of a particular plot was darker, a stronger co-movement of stock market return at higher frequencies was indicated when the period of the sample started. However, if the top-left-hand side of a particular plot was lighter, a weaker co-movement of stock market return at lower frequencies was indicated. Similarly, if the movement of the stock market returns was in parallel at lower frequencies, a darker region would show at the plot bottom half. However, if the movement of the stock market returns was in parallel at higher frequencies, a lighter region would show at the plot bottom half. It could be said that each plot indicated the increase and decrease in the co-movement which took place from the year 2007 to 2018. This phenomenon occurred at the same time with various frequency bands which captured the long- and short-term characteristic of the co-movements of stock market returns.
The characteristic of the association and causality direction was indicated by the arrow direction. Therefore, it could be determined whether the variable was lagging or leading. To be specific, right arrow implied a positive association and that the variables were in-phase. Furthermore, a right arrow which was pointing up indicated a positive association and a leading first variable, while a right arrow which was pointing down indicated a positive association with a lagging first variable. On the other hand, a left arrow implied a negative association and that the variables were out-of-phase. When the left arrow was pointing up, a negative association with the first leading variable was indicated, while a left arrow which was pointing down would indicate a negative association with the first lagging variable. A black dotted line, which is referred to as the cone of significance, reflected the areas of statistical significance at a normal degree by 5%.
Instability was present in the co-movement between US and GCC stock markets, along with inconsistency in the pattern of their association throughout the scales of time. In the case of several GCC stock markets, a significant co-movement was present in the US stock markets for long-run fluctuations throughout a longer scale of time. Therefore, it was indicated that common trends were displayed through markets throughout the time, which was in accordance with the evidence shown in KSA (1992). Furthermore, the advantage of international diversification over a long horizon of investment was reduced by a significant co-movement at a longer frequency. It was implied from the concept of time diversification that possess a risky asset was recommended for investors over a long-run horizon of investment. Supporting this concept, Strong and Taylor (Citation2001) found that the decrease in shortfall risk occurred with the increase in the length of the investment horizon. It was indicated from these findings that simultaneous portfolio and time diversifications would not be obtainable among international investors who desire to possess a risky asset in the GCC.
In most cases, the degree of co-movement in a smaller scale of time was less significant. However, its frequency increased after 2012 in several countries, including KSA and UAE. Before the mortgage crisis, there was a higher degree of co-movement between the KSA and UAE stock markets with the US market. Besides, the scale from the 32nd to the 128th week was the point of time where the co-movement was abundant. However, a restricted co-movement could be seen from GCC stock markets with the US before the year 2010. There was also a reduced presence of co-movement between the markets when the economic decline was taking place despite the occurrence of co-movement at the scale of the 1st to the 16th week.
The co-movement between the US stock markets and the KSA stock market was abundant from the year 2006 to 2018 at a longer scale of time. Despite the insignificant degree of co-movement, the US stock markets brought along the KSA stock market. Furthermore, the degree of co-movement increased prior to the economic decline, which was followed by its concentration at small and large scales of time until the year 2009. However, the restriction of the co-movement between the KSA and the US stock markets occurred when the economic decline was taking place. However, the increase of it occurred after the economic decline from 2010 to 2018. The co-movement between the UAE stock market and the US stock markets was mostly at long-run scales. Although it was weak, it could be seen that the UAE stock market brought along the US stock markets from the year 2009 to 2011 during the scale of the 32nd to 64th week. Nevertheless, the degree of dependency between these markets was low, which was manifested through a lighter shade of the heat map colour.
Instability was also present in the co-movement between Bahrain and the US stock markets, along with inconsistency in the pattern of their associations. Furthermore, although the degree of co-movement increased after 2011, the dependency between these markets was at a significantly low degree. This was the same case for the co-movement between the Kuwait and US stock markets, where there was almost no co-movement between them. However, Oman and the US stock markets displayed a better co-movement compared to the ones between Bahrain and Kuwait stock markets. Besides, the co-movement between Oman and the US stock markets was concentrated over a longer scale of time. Particularly, although instability persisted in its dependence, it increased and spread over the scale of time in the year 2012. Despite this insignificant co-movement, it demonstrated that the US stock markets brought the Omani stock market along. Additionally, instability and inconsistency were present in the co-movement between the Qatari and the US stock markets over the scale of time. It was also concentrated within the scale of 16th to the 128th week after the economic decline. Nevertheless, this co-movement increased after the year 2012. All in all, the results confirm that the degree of co-movement between GCC stock markets and those of US increased after the crises period which implies that, to some extent, many economies largely depend on the US economy and evenly respond when the US economy is in trouble. Such results are in line with those of Aloui and Hkiri (Citation2014) for the case of GCC, and Jiang et al. (Citation2017b) in case of US with UK, Germany, China, Hong Kong, and Japan.
From the analysis some interesting points can be extracted. First, the degrees of co-movement between stock markets of KSA, UAE, Qatar and Oman with US stock markets were mostly stronger compare to the indices of Bahrain and Kuwait. Such dynamic correlation at the high levels could be high degree of persistence of shock transmission during turbulent period. On the other hand, the weak correlation between stock markets of Bahrain and Kuwait with US markets, could be an indication that these markets are reasonably immune to risk spillovers from the US markets. In other words, the degree of co-movement is too low to warrant the easy spread of contagious shocks along with its broad systemic implications. Second, the dynamics of the interactive relationship between the US markets and GCC stock markers is changing rapidly over time and frequency. For example, when considering the co-movement between Bahrain, Kuwait and US which shows strong co-movement for investment horizon of few years between 2012 and 2018, the short-term dependence seems to be very low during the period under consideration. It could be concluded from these results that the integration magnitude of the GCC market with US stock markets is changing over time and turns to significantly affected by the occurrence of financial crisis. Such results are supported by the results of previous studies Brooks and Del Negro (Citation2006), Madaleno and Pinho (Citation2012), Garham et al., (Citation2012), Akoum et al. (Citation2012), and Aloui and Hkiri (Citation2014) ().
Figure 1. Analysis results
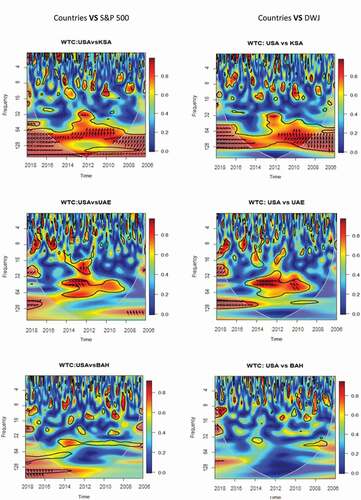
Figure 1. (Continued)
5.2. Results of DCC-GARCH model
The DCC-GARCH model is suitable to assess co-movements between the stock markets of interests because it allows to directly infer the cross-market conditional correlations. The model inspects the dynamic correlation on decomposed components of time series. furnish the magnitudes of key parameters.
Table 3. DCC-GARCH estimation
The results of the co-movement from between S&P stock market and GCC stock markets showed that the scale wise-estimated parameters were significant for all GCC stock markets except for Qatar at the short run. Values of beta is greater than alpha in all cases. Hence, a clear dominance of long-run persistence over short-run persistence is evident in the said time. The significance of DCC parameters specifies the existence of volatility clustering. The sum of alpha and beta less than one infers the evidence of the mean reverting process. For the DWJ stock market and GCC stock markets, the results were almost the same. shows the dynamic conditional correlation between the GCC stock market return and the US stock markets. The figures indicate that the DCC can display homogenous overlap to positive and negative values. The value ranges between −0.20 and 0.20. Hence, this time-scale accounts for the high risk and high return scenario. It appears that the conditional correlations are mostly negative from 2008 to 2010, indicating that higher volatility in US stock markets induces lower stock returns in GCC. The highest conditional correlations are observed in KSA and followed by UAE and Qatar, while the stock market in Bahrain and Kuwait are least correlated with the US markets among its peers.
Figure 2. DCC plots
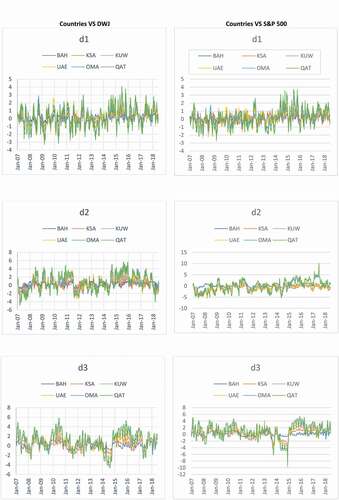
Figure 2. (Continued)
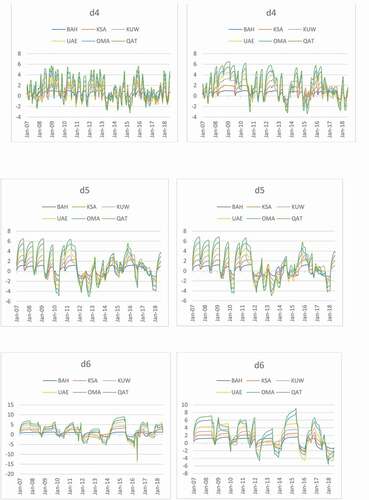
depicts the dynamic conditional correlation DCC between each US stock market and the GCC stock markets at different time scales from d1 to d6 scales, where d1 to d3 represent the short run and d4-d6 represent the long run. The range of the DCC suggests the existence of ample scopes for portfolio formation at different time horizons. The results of and indicate that the probability of higher returns is substantially higher in long-run periods. On the other hand, a comparatively higher possibility of more risk cannot be ruled out in the long run as well. Therefore, risk-averse players may get benefit from diversification of assets for up to 16 weeks. The players willing to take a risk for achieving excess profit may target diversification in the long run-up to 64–128 weeks. The horizontal axes of the figures show the time. All in all, the results to somewhat confirm the obtained ones from wavelet analysis, but the issue lies in analyzing the co-movement between the stock markets of interests in terms of the degree of association in time-varying frequency scales. Findings of wavelet coherence analysis can effectively evaluate the magnitude of prevailing association and dependence in short, medium, and long-run scales, while the DCC-GARCH examines the DCC by critically evaluating historical correlation and conditional volatility. Thus, DCC-GARCH cannot extract the time varying scale-wise nature of dynamic correlation.
6. Conclusion and policy implications
The co-movement of stock market returns for GCC and the US was examined in this study. Essentially, market co-movement is essential in deciding the allocation of assets and diversification of the portfolio. The recent works of literature have the tendency of placing a sole focus on the time-variation in co-movement. However, in reality, there are various scales of time in financial markets. By implementing the wavelet coherence approach, the evolution of co-movement between the markets over time and various scales of time was investigated. This study has proven that time-variations and scale-variations are present in these markets’ co-movements. Furthermore, the instability of the co-movement during the economic decline throughout the time and across the scales was clearly seen. It was also found that there was a significant long-term degree of co-movement between several GCC stock markets and the US stock markets. From the findings, a diverse co-movement across the scales of time during economic decline was proven. Specifically, it was found that the co-movement of the GCC and the US stock markets was highly diverse during the time of economic decline.
There was a concentration of co-movement at a medium scale of time, which was for 32 to 64 weeks. The diverse characteristics of the economic decline or changing regime possibly resulted in the variation in the co-movement dynamics. Therefore, further study is required to investigate the exact factor of this variation in co-movement. Essential implications could be made from this study for international investors. It was indicated from the co-movement over a longer scale of time that the advantages of the diversification of portfolio and time are unobtainable by international investors. Significant variations were found in the chances for international portfolio diversification across these markets, specifically in terms of time and scale. This implies that GCC stock markets gives an attractive diversification opportunity for local and international investors when they construct their own portfolios. Additionally, the diversification of the portfolio was present during economic decline. However, developing a diversified portfolio was a challenge due to the instability in the co-movement between the stock markets.
This study has provided contributions to the existing works of literature through the implementation of the wavelet coherence method to investigate the co-movement of financial markets in the GCC with the US market. Furthermore, the investigation on the association between co-movement and the indicators of stock markets could provide insights regarding the reaction of stock markets towards the changing stock cost in the same emerging markets. With that being said, it could be highlighted that there is a general connection between GCC stock markets. These markets also have a relation with the US stock markets. Last but not least, it could be concluded that the KSA market is a GCC market which receives the highest impact. This finding is highly crucial for various parties related in the field of stocks market, such as the governments, investors, and policymakers. For instance, Significant implications of this study results could be made for policymakers and government. For policymakers, the significant long-term degree of co-movement between several GCC stock markets and the US stock markets implies that any growth of the US stock market should be considered for policymakers in GCC countries. Also governments especially in GCC countries could pay attention for the results of this study such as the instability of the co-movement during the economic decline throughout the time and across the scales. Besides, the co-movement of the GCC and the US stock markets was highly diverse during the time of economic decline. The government can get benefit from these results for their public data and statistics and for controlling and monitoring financial markets.
Additional information
Funding
Notes on contributors
Ali Matar
Ali Matar is an Associate professor in Financial Economic and currently he is the Dean of Scientific Research at Jadara University, Irbid, Jordan. [email protected]
Mahmoud Al-Rdaydeh
Mahmoud Al-Rdaydeh is an assistant professor of finance at Ibn Rushd College for Management Sciences, Abha, Saudi Arabia. [email protected]
Anas Ghazalat
Anas Ghazalat is an assistant professor of Accounting at Arab Open University, Amman, [email protected]
Bilal Eneizan
Bilal Eneizan is an assistant professor at Business School, Jadara University, Irbid, [email protected]
References
- Akoum, I., Graham, M., Kiviaho, J., Nikkinen, J., & Omran, M. (2012). Co-movement of oil and stock prices in the GCC region: A wavelet analysis. The Quarterly Review of Economics and Finance, 52(4), 385–22. https://doi.org/https://doi.org/10.1016/j.qref.2012.07.005
- Alagidede, P., & Mensah, J. O. (2016). How are Africa’s emerging stock markets related to advanced markets? Evidence from copulas. Econ. Model, 60, 1–10. https://doi.org/https://doi.org/10.1016/j.econmod.2016.08.022
- Alaoui, A. O., Dewandaru, G., Rosly, S. A., & Masih, M. (2015). Linkages and co-movement between international stock market returns: Case of Dow Jones Islamic Dubai financial market index. Journal of International Financial Markets, Institutions and Money, 36, 53–70. https://doi.org/https://doi.org/10.1016/j.intfin.2014.12.004
- Ali, R., Butt, U. U., Khan, M. M., Shaheer, M., & Zaidi, F. A. (2020). Empirical evidence of co-movement between the Canadian CDS, stock market and TSX 60 volatility index: A wavelet approach. SEISENSE Journal of Management, 3(3), 51–64. https://doi.org/https://doi.org/10.33215/sjom.v3i3.353
- Aloui, C., Hammoudeh, S., & Hamida, H. B. (2015). Co-movement between sharia stocks and sukuk in the GCC markets: A time-frequency analysis. Journal of International Financial Markets, Institutions and Money, 34, 69–79. https://doi.org/https://doi.org/10.1016/j.intfin.2014.11.003
- Aloui, C., & Hkiri, B. (2014). Co-movements of GCC emerging stock markets: New evidence from wavelet coherence analysis. Economic Modelling, 36, 421–431. https://doi.org/https://doi.org/10.1016/j.econmod.2013.09.043
- Aloui, C., Jammazi, R., & Hamida, H. B. (2018). Multivariate co-movement between Islamic stock and bond markets among the GCC: A wavelet-based view. Computational Economics, 52(2), 603–626. https://doi.org/https://doi.org/10.1007/s10614-017-9703-7
- Awartani, B., & Maghyereh, A. I. (2013). Dynamic spillovers between oil and stock markets in the Gulf Cooperation Council Countries. Energy Economics, 36, 28–42. https://doi.org/https://doi.org/10.1016/j.eneco.2012.11.024
- Basdas, U. (2012). Interaction between MENA stock markets: A comovement wavelet analysis. Available at SSRN 2333774, 2012
- Bekaert, G., & Harvey, C. R. (1995). Time‐varying world market integration. The Journal of Finance, 50(2), 403–444. https://doi.org/https://doi.org/10.1111/j.1540-6261.1995.tb04790.x
- Bekhet, H. A., & Matar, A. (2013a). Co-integration and causality analysis between stock market prices and their determinates in Jordan. Economic Modelling, 35, 508–514. https://doi.org/https://doi.org/10.1016/j.econmod.2013.07.012
- Bekhet, H. A., & Matar, A. (2013b). The impact of global financial crisis on the economic growth and capital market returns: Evidence from Jordan. In The Twelfth Scientific Annual International Conference for Business (Human Capital in a Knowledge Economy) (pp. 22–25). Al-zaytoonah University of Jordan.
- Bekhet, H. A., & Matar, A. (2013c). The influence of global financial crisis on Jordanian equity market: VECM approach. International Journal of Monetary Economics and Finance, 6(4), 285–301. https://doi.org/https://doi.org/10.1504/IJMEF.2013.059946
- Birău, F. R., & Trivedi, J. (2013). Analyzing cointegration and international linkage between Bucharest stock exchange and European developed stock markets. International Journal of Economics and Statistics, 4(1), 237–246. https://www.researchgate.net/profile/Ramona-Birau/publication/258050225_Analyzing_cointegration_and_international_linkage_between_Bucharest_stock_exchange_and_European_developed_stock_markets/links/0c96053cad59c5ebf7000000/Analyzing-cointegration-and-international-linkage-between-Bucharest-stock-exchange-and-European-developed-stock-markets.pdf
- Black, F. (1974). International capital market equilibrium with investment barriers. Journal of Financial Economics, 1(4), 337–352. https://doi.org/https://doi.org/10.1016/0304-405X(74)90013-0
- Boako, G., & Alagidede, P. (2017). Co-movement of Africa’s equity markets: Regional and global analysis in the frequency–time domains. Physica A: Statistical Mechanics and Its Applications, 468, 359–380. https://doi.org/https://doi.org/10.1016/j.physa.2016.10.088
- Boutabba, M. A. (2014). The impact of financial development, income, energy and trade on carbon emissions: Evidence from the Indian economy. Economic Modeling, 40, 33–41. https://doi.org/https://doi.org/10.1016/j.econmod.2014.03.005
- Brooks, R., & Del Negro, M. (2004). The rise in comovement across national stock markets: Market integration or IT bubble? Journal of Empirical Finance, 11(5), 659–680. https://doi.org/https://doi.org/10.1016/j.jempfin.2003.08.001
- Brooks, R., & Negro, M. D. (2006). Firm-level evidence on international stock market comovement. Review of Finance, 10(1), 69–98. https://doi.org/https://doi.org/10.1007/s10679-006-6979-1
- Çelik, S., & Baydan, E. (2015). Bringing a new perspective on co-movements of stock markets in emerging economies through causality and wavelet analysis. Topics in Middle Eastern and North African Economies, 17(1), 26–51. http://meea.sites.luc.edu/volume17/pdfs/Celik-Baydan.pdf
- Choudhry, T. (2004). International transmission of stock returns and volatility: Empirical comparison between friends and foes. Emerging Markets Finance and Trade, 40(4), 33–52. https://doi.org/https://doi.org/10.1080/1540496X.2004.11052581
- Cooper, I. A., & Kaplanis, E. (2000). Partially segmented international capital markets and international capital budgeting. Journal of International Money and Finance, 19(3), 309–329. https://doi.org/https://doi.org/10.1016/S0261-5606(00)00012-7
- De Gregorio, J., & Guidotti, P. E. (1995). Financial development and economic growth. World Development, 23(3), 433–448. https://doi.org/https://doi.org/10.1016/0305-750X(94)00132-I
- Dewandaru, G., Masih, R., & Masih, A. M. M. (2016). Contagion and interdependence across Asia-pacific equity markets: An analysis based on multi-horizon discrete and continuous wavelet transformations. International Review of Economics & Finance, 43, 363–377. https://doi.org/https://doi.org/10.1016/j.iref.2016.01.002
- Engle, R. (2002). Dynamic conditional correlation. Journal of Business and Economic Statistics, 20(3), 339–350. https://doi.org/https://doi.org/10.1198/073500102288618487
- Errunza, V. R., & Losq, E. (1985). The behavior of stock prices on LDC markets. Journal of Banking & Finance, 9(4), 561–575. https://doi.org/https://doi.org/10.1016/0378-4266(85)90007-X
- Eun, C. S., & Janakiramanan, S. (1986). A model of international asset pricing with a constraint on the foreign equity ownership. The Journal of Finance, 41(4), 897–914. https://doi.org/https://doi.org/10.1111/j.1540-6261.1986.tb04555.x
- Fernandez, V. (2005). Time-scale decomposition of price transmission in international markets. Emerging Markets Finance and Trade, 41(4), 57–90. https://doi.org/https://doi.org/10.1080/1540496X.2005.11052617
- Gallegati, M. (2012). A wavelet-based approach to test for financial market contagion. Computational Statistics & Data Analysis, 56(11), 3491–3497. https://doi.org/https://doi.org/10.1016/j.csda.2010.11.003
- Ghosh, S., & Kanjilal, K. (2016). Co-movement of international crude oil price and Indian stock market: Evidences from nonlinear cointegration tests. Energy Economics, 53, 111–117. https://doi.org/https://doi.org/10.1016/j.eneco.2014.11.002
- Graham, M., Kiviaho, J., & Nikkinen, J. (2012). Integration of 22 emerging stock markets: A three-dimensional analysis. Global Finance Journal, 23(1), 34–47. https://doi.org/https://doi.org/10.1016/j.gfj.2012.01.003
- Graham, M., & Nikkinen, J. (2011). Co-movement of the Finnish and international stock markets: A wavelet analysis. The European Journal of Finance, 17(5–6), 409–425. https://doi.org/https://doi.org/10.1080/1351847X.2010.543839
- Grinsted, A., Moore, J. C., & Jevrejeva, S. (2004). Application of the crosswavelet transform and wavelet coherence to geophysical time series. Nonlinear Processes in Geophysics, 11(5/6), 561–566. https://doi.org/https://doi.org/10.5194/npg-11-561-2004
- Hardouvelis, G. A., Malliaropulos, D., & Priestley, R. (2006). EMU and European stock market integration. The Journal of Business, 79(1), 365–392. https://doi.org/https://doi.org/10.1086/497414
- Hyeongwoo, K., Bong-Han, K., & Bong-Soo, L. (2015). Spillover effects of the U.S. financial crisis on financial markets in emerging Asian countries. International Review of Economics & Finance, 39, 192–210. https://doi.org/https://doi.org/10.1016/j.iref.2015.04.005
- Jiang, Y., Nie, H., & Monginsidi, J. Y. (2017a). Co-movement of ASEAN stock markets: New evidence from wavelet and VMD-based copula tests. Economic Modelling, 64, 384–398. https://doi.org/https://doi.org/10.1016/j.econmod.2017.04.012
- Jiang, Y., Yu, M., & Hashmi, S. M. (2017b). The financial crisis and co-movement of global stock markets—A case of six major economies. Sustainability, 9(2), 260. https://doi.org/https://doi.org/10.3390/su9020260
- Jiang, Z., & Yoon, S. M. (2020). Dynamic co-movement between oil and stock markets in oil-importing and oil-exporting countries: Two types of wavelet analysis. Energy Economics, 90, 104835. https://doi.org/https://doi.org/10.1016/j.eneco.2020.104835
- Karlsson, H. K., Li, Y., & Shukur, G. (2018). The causal nexus between oil prices, interest rates, and unemployment in Norway using wavelet methods. Sustainability, 10(8), 2792. https://doi.org/https://doi.org/10.3390/su10082792
- Keynes, J. M. (1936). The general theory of employment interest and money Harcourt. Brace and Company.
- Kirman, A. P. (1992). Whom or what does the representative individual represent? Journal of Economic Perspectives, 6(2), 117–136. https://doi.org/https://doi.org/10.1257/jep.6.2.117
- Lau, L. S., Choong, C. K., & Eng, Y. K. (2014). Investigation of the environmental Kuznets curve for carbon emissions in Malaysia: Do foreign direct investment and trade matter? Energy Policy, 68, 490–497. https://doi.org/https://doi.org/10.1016/j.enpol.2014.01.002
- Lee, G., & Jeong, J. (2016). An investigation of global and regional integration of ASEAN economic community stock market: Dynamic risk decomposition approach. Emerging Markets Finance and Trade, 52(9), 2069–2086. https://doi.org/https://doi.org/10.1080/1540496X.2016.1156528
- Lehkonen, H., & Heimonen, K. (2014). Timescale-dependent stock market comovement: BRICs vs. developed markets. Journal of Empirical Finance, 28, 90–103. https://doi.org/https://doi.org/10.1016/j.jempfin.2014.06.002
- Lin, W.-L., Engle, R. F., & Ito, T. (1994). Do bulls and bears move across borders? International transmission of stock returns and volatility. Review of Financial Studies, 7(3), 507–538. https://doi.org/https://doi.org/10.1093/rfs/7.3.507
- Lintner, J. (1965). Security prices, risk, and maximal gains from diversification. The Journal of Finance, 20(4), 587–615. https://doi.org/https://doi.org/10.2307/2977249
- Madaleno, M., & Pinho, C. (2012). International stock market indices comovements: A new look. International Journal of Finance & Economics, 17(1), 89–102. https://doi.org/https://doi.org/10.1002/ijfe.448
- Majid, A., & Shabri, M. (2018). Who co-moves the Islamic stock market of Indonesia-the US, the UK, or Japan? Journal of Islamic Economics, 10(2), 267–284. https://doi.org/https://doi.org/10.15408/aiq.v10i2.7288
- Masih, M., Alzahrani, M., & Masih, O. A. (2010). Systematic risk and time scales: New evidence From an application of wavelet approach to the emerging Gulf stock markets. International Review of Financial Analysis, 19(1), 10–18. https://doi.org/https://doi.org/10.1016/j.irfa.2009.12.001
- Matar, A. (2016). A dynamic equilibrium relationship between foreign direct investment, electrical power consumption and gross domestic product in Jordan. Jordan Journal of Economic Sciences, 406(3642), 1–17. https://platform.almanhal.com/Files/2/92212
- Matar, A., & Bekhet, H. A. (2015). Causal interaction among electricity consumption, financial development, exports and economic growth in Jordan: Dynamic simultaneous equation models. International Journal of Energy Economics and Policy, 5(4), 955–967. https://econjournals.com/index.php/ijeep/article/view/1331/852
- Meng, X., & Huang, C. H. (2019). The time-frequency co-movement of Asian effective exchange rates: A wavelet approach with daily data. The North American Journal of Economics and Finance, 48, 131–148. https://doi.org/https://doi.org/10.1016/j.najef.2019.01.009
- Mensi, W. (2019). Global financial crisis and co-movements between oil prices and sector stock markets in Saudi Arabia: A VaR based wavelet. Borsa Istanbul Review, 19(1), 24–38. https://doi.org/https://doi.org/10.1016/j.bir.2017.11.005
- Mossin, J. (1966). Equilibrium in a capital asset market. Econometrica: Journal of the Econometric Society, 34(4), 768–783. https://doi.org/https://doi.org/10.2307/1910098
- Nasreen, S., Naqvi, S. A. A., Tiwari, A. K., Hammoudeh, S., & Shah, S. A. R. (2020). A wavelet-based analysis of the co-movement between Sukuk bonds and Shariah stock indices in the GCC region: Implications for risk diversification. Journal of Risk and Financial Management, 13(4), 63. https://doi.org/https://doi.org/10.3390/jrfm13040063
- Orhan, A., Kirikkaleli, D., & Ayhan, F. (2019). Analysis of wavelet coherence: Service sector index and economic growth in an emerging market. Sustainability, 11(23), 6684. https://doi.org/https://doi.org/10.3390/su11236684
- Patel, R. J. (2017). Co-movement and integration among stock markets: A study of 14 countries. Indian Journal of Finance, 11(9), 53–66. https://doi.org/https://doi.org/10.17010/ijf/2017/v11i9/118089
- Răileanu-Szeles, M., & Albu, L. (2015). Nonlinearities and divergences in the process of European financial integration. Economic Modelling, 46, 416–425. https://doi.org/https://doi.org/10.1016/j.econmod.2014.11.029
- Ramsey, J. B., & Lampart, C. (1998). The decomposition of economic relationship by time scale using wavelets: Expenditure and income. Studies in Nonlinear Dynamics & Econometrics, 3(1). https://doi.org/https://doi.org/10.2202/1558-3708.1039
- Rua, A., & Nunes, L. (2009). International comovement of stock market returns: A wavelet analysis. Journal of Empirical Finance, 16(4), 632–639. https://doi.org/https://doi.org/10.1016/j.jempfin.2009.02.002
- Saâdaoui, F., Naifar, N., & Aldohaiman, M. S. (2017). Predictability and co-movement relationships between conventional and Islamic stock market indexes: A multiscale exploration using wavelets. Physica A: Statistical Mechanics and Its Applications, 482, 552–568. https://doi.org/https://doi.org/10.1016/j.physa.2017.04.074
- Samarakoon, L. P. (2011). Stock market interdependence, contagion, and the US financial crisis: The case of emerging and frontier markets. Journal of International Financial Markets, Institutions and Money, 21(5), 724–742. https://doi.org/https://doi.org/10.1016/j.intfin.2011.05.001
- Shahzad, S. J. H., Kumar, R. R., Ali, S.,Ameer, S. (2016). Interdependence between Greece and other European stock markets: A comparison of wavelet and VMD copula, and the portfolio implications. Physica A: Statistical Mechanics and Its Applications, 457, 8–33. https://doi.org/https://doi.org/10.1016/j.physa.2016.03.048
- Shahzad, S. J. H., Nor, S. M., Kumar, R. R., & Mensi, W. (2017). Interdependence and contagion among industry-level US credit markets: An application of wavelet and VMD based copula approaches. Physica A: Statistical Mechanics and Its Applications, 466, 310–324. https://doi.org/https://doi.org/10.1016/j.physa.2016.09.008
- Sharpe, W. F. (1964). Capital asset prices: A theory of market equilibrium under conditions of risk. The Journal of Finance, 19(3), 425–442. https://doi.org/https://doi.org/10.1111/j.1540-6261.1964.tb02865.x
- Siminică, M., & Birău, R. (2014). Investigating international causal linkages between Latin European stock markets in terms of global financial crisis: A case study for Romania, Spain and Italy. International Journal of Business Quantitative Economics and Applied Management Research (IJBEMR), 1(1), 12–36. http://citeseerx.ist.psu.edu/viewdoc/download?doi=10.1.1.1067.8718&rep=rep1&type=pdf
- Strong, N., & Taylor, N. (2001). Time diversification: Empirical tests. Journal of Business Finance & Accounting, 28(3–4), 263–302. https://doi.org/https://doi.org/10.1111/1468-5957.00374
- Stulz, R. (1981). A model of international asset pricing. Journal of Financial Economics, 9(4), 383–406. https://doi.org/https://doi.org/10.1016/0304-405X(81)90005-2
- Torrence, C., & Compo, G. P. (1998). A practical guide to wavelet analysis. Bulletin of the American Meteorological Society, 79(1), 61–78. https://doi.org/https://doi.org/10.1175/1520-0477(1998)079<0061:APGTWA>2.0.CO;2
- Wang, K., Chen, Y. H., & Huang, S. W. (2011). The dynamic dependence between the Chinese market and other international stock markets: Time-varying copula approach. International Review of Economics & Finance, 20(4), 654–664. https://doi.org/https://doi.org/10.1016/j.iref.2010.12.003
- Wang, Q., Liu, Y., Tong, L., Zhou, W., Li, X., & Li, J. (2018). Rescaled statistics and wavelet analysis on agricultural drought disaster periodic fluctuations in China from 1950 to 2016. Sustainability, 10(9), 3257. https://doi.org/https://doi.org/10.3390/su10093257
- Yao, S., He, H., Chen, S., & Ou, J. (2018). Financial liberalization and cross-border market integration: Evidence from China’s stock market. International Review of Economics & Finance, 58, 220–245. https://doi.org/https://doi.org/10.1016/j.iref.2018.03.023