
 ?Mathematical formulae have been encoded as MathML and are displayed in this HTML version using MathJax in order to improve their display. Uncheck the box to turn MathJax off. This feature requires Javascript. Click on a formula to zoom.
Abstract
We present a new model to identify and prioritize factors affecting small and medium enterprises (SMEs) investment intentions by integrating existing models. Structured questionnaire is used to sample respondents from the Ghanaian SMEs between 2017 and 2018. Data analyses have been conducted using variance-based Smart Partial Least Square (SmartPLS) technique. The major findings of the study are that macro environment factors, resource competitive strategies and oil and gas policy-specific factors are the significant determinants of SMEs investment intentions. Again, the study revealed that the resource competitive strategies significantly mediate the relationship between macro environment factors, industry force, oil and gas policy support and investment intentions. These results are robust and consistent with resource-based view, theory of constraint and theory of strategic positioning. Moreover, these results contribute new knowledge towards developing investment strategy for the downstream oil and gas industry. Besides, these findings have managerial implications needed by policy makers to renew commitment and provide the needed framework to investors to enhance indigenous participation in the industry.
PUBLIC INTEREST STATEMENT
Small and medium enterprises (SMEs) represent 92 percent of total businesses in Ghana but less than 5 percent are currently participating in the Ghana’s oil and gas sector largely due to appropriate investment strategies. In this view, identifying and prioritizing factors that affect SMEs’ investment in the downstream oil and gas sector is crucial to all major stakeholders in the sector. We report that external business forces, internal business resources as well as oil and gas investment support policy will enhance SMEs participation in the downstream oil and gas industry. Besides, policy makers have been informed by the findings of the study to renew commitment and provide the needed framework to investors to enhance indigenous participation in the industry.
1. Introduction
Small and medium businesses (SMBs) are the engine of growth and epitome of socio-economic growth across developed and developing economies. SMBs are defined in terms of quantitative and qualitative indicators. Quantitatively, SMBs are classified in terms of investment capital, fixed assets, number of employees and sales while qualitative indicators such as legal status, industry structure, business location and ownership structure are also useful to classify SMBs (Ayaggari et al., Citation2013; Lawal & Ijaiya, Citation2007; Onugu, Citation2011) The Ghana Statistical Service classified SMBs using quantitative attributes (Abor & Quartey, Citation2010; K. M. Appiah et al., Citation2018a; MK. Appiah et al., Citation2021)
Ghana being a low middle income country has huge potentials to transform and grow its economy through industrialization, innovation, job creation and ultimately ensuring equitable distribution of wealth. The 2013 local content regulation was formulated with the fundamental aim of optimizing locally produced materials, personnel, goods and services as well as financing, which are enshrined in the petroleum industry value chain and can best be measured in monetary terms (K. M. Appiah et al., Citation2018a; Appiah et al., Citation2018b). The petroleum sub sector policy directions are intended to guide the development and management of the emerging oil and gas sector as enabler of oil and gas sector for socio-economic transformation. The government has core mandate of ensuing that the exploitation and utilization of Ghana’s oil and gas endearment are sustained and optimized for the overall benefit and welfare of Ghanaians both present and future. Major obstacles in meeting the local content policy goal are how to achieve optimal participation of local content in the oil and gas industry, and how to enhance national development through jobs and employment creations. These notwithstanding the actual participation of still remains record low (K. M. Appiah et al., Citation2018a; MK. Appiah et al., Citation2021).
Despite Government’s legislative efforts of augmenting indigenous companies participation in the oil and gas value chain hitherto local participation remains record low. Previous studies provided mixed and fragmented results. Most of these studies focussed on internal factors (Abuka et al., Citation2006; Adusei & Appiah, Citation2011; K. M. Appiah et al., Citation2018a; Quartey et al., Citation2017; Wamono et al., Citation2012), external factors (Abor & Quartey, Citation2010; Aryeetey, Citation1994; Ayaggari et al., Citation2013; Caesar & Vilar, Citation2010; K. M. Appiah et al., Citation2018a; Quartey et al., Citation2017; Thompson et al., Citation2010), industry policies (Adamchak, Citation1997; Anderson et al., Citation2007; Georgellis & Wall, Citation2004; Lah, Citation2017; K. M. Appiah et al., Citation2018a) and oil and gas policy environment (Adamchak, Citation1997; Anderson et al., Citation2007; Appiah et al., Citation2018c; Brown et al., Citation2007; Georgellis & Wall, Citation2004; Inamete, Citation1993; Lah, Citation2017; Malone, Citation2005) to determine investment behaviours of small and medium businesses. However, these previous studies largely ignored the integration of all these factors in a single study.
The main purpose of this paper is to present a new model to identify and prioritize factors affecting SMEs’ investment intentions by integrating Resource-Based View, Theory of Constraint and theory of strategic positioning. We argue further that the combined effect of these factors effectively determines SMEs’ investment intentions. The mixed and fragmented results previously reported in this area may be due to one or combination of the following possible: 1) Previous studies did not integrate the major constructs instead they were studied in isolation i.e. internal factors, external factors, industry policies and perceived risk and constraints were mostly studied in isolation, 2) Previous studies focussed on different sub dimensions using different methodological approach and 3) the constructs were studied under different geographical context at different time period. We contribute new empirical knowledge to fill this gap. The paper is organized into six distinctive sections as follows: 1) presents the introductory section of the paper covering the significance of the study, main purpose and the research problem, 2) presents the theoretical and empirical reviews, 3) presents the methodology of the study, 4) presents the results and discussions of the study finally and 5) presents the conclusions and the implications of the study.
2. Literature review (theoretical and empirical)
2.1. Investment intention
As previously reported (Soderlund & Ohman, Citation2003; Clark-Murphy & Soutar, Citation2008; K. M. Appiah et al., Citation2018a; Appiah et al., Citation2018b, Citation2018c; MK. Appiah et al., Citation2021) investment intentions of firms are severally determined. Soderlund and Ohman (Citation2003) defined investment intentions using wants, plans and expectations. These authors believed that wants and plans are critical to firm’s decisions to invest requireed financial and other commitment (plans) as well as the need for such a commitment. Soderlund and Ohman argued further that the overall expectations from the investment have a significant impact on the investor’s intentions to invest. Relatedly, a study by Appiah et al. (Citation2018b, Citation2018c) reported that investment intentions can be best explained in terms of resources at the disposal of the firms in question. Arguing further the authors stipulated that factors such as external funding, competitive rivalry, financial resources, information access, policy support and market accessibility are fundamental to firms’ investment. Baker and Haslem (Citation1973) asserted that investment intentions are influenced by the quality of management, firm’s economic outlook and economic status of the industry in the long term. Besides, investment intentions have equally been defined in terms of risk (Clark-Murphy & Soutar, Citation2008). Similarly, financial and non-financial factors have also been used as critical determinants of investment intentions (Nagy & Obenberger, Citation1994).
2.2. Macro environment factors
Empirically, recent studies (K. M. Appiah et al., Citation2018a; MK. Appiah et al., Citation2021; Quartey et al., Citation2017) have revealed that there exists relationship between the macroenvironment and investment intention. Specifically, Appiah et al. (MK. Appiah et al., Citation2021) asserted that macro-economic variables such as economic, political, socio-cultural and legal environment have been found to exert strong influence on investment intentions and business performance in general. Moreover, the theory of strategic positioning argues that the business environment is extensively influenced by external factors like political, economic, social, technological and among others, stakeholders and expectations (Johnson et al., Citation2008). Johnson et al. (Citation2008) believe that the macro-external factors as well as competitors, market systems, control the business environment and industry factors hence the need for the strategic positioning theory. The researcher limited the discussion in this study to strategic positioning theory in relation to the macro-environmental factors. The macro-environment is the element that influences every aspect of the business (Johnson et al., Citation2008). In relation to this, Itani et al. (Citation2014) as cited in Litavniece and Znotina (Litavniece & Znotiņa, Citation2015) affirms the argue that the external business environment is made up of factors like the prevailing political conditions in the country, the economic status of the country, the socio-cultural factors, technological factors, environmental factors and legal framework (PESTEL). The theory has been adopted and used by several researchers like Johnson et al. (Citation2008); Snyman and Saayman (Citation2009); Menzies and Orr (Citation2010); Göndör and Nistor (Citation2012) and Litavniece and Znotina (Litavniece & Znotiņa, Citation2015). From the presentation above we argue that:
H1 the lower the macro environment forces the higher SMEs investment intentions
2.3. Industry forces
The Porter’s five forces were used as a proxy to assess the investment behaviour of SMEs in the Ghanaian oil and gas downstream industry. The Porter’s framework gives a clear understanding of the investment practices of SMEs in the oil and gas industry. The competitive advantage of organizations is underpinned by five main forces; the bargaining power of suppliers, the bargaining power of customers, the bargaining power of consumers, competitive to rivalry and the threat of new entries (Porter, Citation1980a; Passemard & Kleiner, Citation2000; MK. Appiah et al., Citation2021). The Porter’s forces provide a greater insight to identify and analyze the competitive factors that influence the business industry (Porter, Citation1980a). The main rational behind industry forces is that, companies also use internal resources to achieve a success. The internal resources of the company determine how companies react to market signals to be able to effectively manage the operations of the business (Kim et al., Citation2004). The competition within an industry is governed by five main forces; the bargaining power of suppliers, the bargaining power of customers, the bargaining power of consumers, competitive to rivalry and the threat of new entries. The forces that control an environment influence its market environment (Hibbets et al., Citation2003; Appiah et al., Citation2019; MK. Appiah et al., Citation2021). Researchers like Kim and Oh (Kim et al., Citation2004) and Olsen and Roper (Citation1998) indicated that, the bargaining power of suppliers in the Ghanaian oil and gas sector is low due to the involvement of other suppliers. On this base, the researcher considered all the forces like the bargaining power of oil and gas suppliers, the bargaining power of oil and gas customers, the bargaining power of consumers, competitive rivalry and the threat of new oil and gas entries. Assessing these forces simply determines whether the forces are enough to guarantee businesses a competitive edge in the oil and gas downstream industry. We hypothesize based on the above that:
H2 the lower the industry environment forces the higher SMEs investment intentions.
2.4. Policy environment and investment intentions
Studies have confirmed that indigenous education has a significant effect on the growth and development of companies (Adamchak, Citation1997; Anderson et al., Citation2007; Brown et al., Citation2007; Georgellis & Wall, Citation2004; Inamete, Citation1993; Lah, Citation2017; Malone, Citation2005). In line with that, Fullerton et al. (Citation2014) considered how the various levels of educational achievements influence income performance and stated that, educational achievements directly relate to income benefits. Similarly, the level of achievement in terms of education positively influences a firm. Previously, studies have confirmed that, a company’s capabilities influence their decisions and choices. Strachan et al. (Citation2000) emphasized how policy environment determine the performance of businesses. Using a spatial panel approach, Georgellis and Wall (Citation2004) highlighted the impact that government policy environment has on entrepreneurship. Macro-environmental factors like inflation, interest rates, foreign direct investments, taxation and others have a toll on the investment decisions of SMEs. In the same way, Christensen and Goedhuys (Citation2004) reported that national conditions influence the behaviour of SMEs and determine their performance. Christensen and Goedhuys indicated that, the policy environment is a major obstacle to SMEs and new businesses, and these obstacles are in the areas of labour cost, taxation and labour regulations. Nwaizugbo et al. (Citation2013) elaborated that, there is a need for stable business environment to ensure business growth. Inferring from the above we hypothesize that:
H3 the higher the Oil and gas policy environment the higher SMEs investment intentions
2.5. Resource competitive strategies
Beiger Wernerfelt developed the Resource-Based View Theory (RBV) in 1984, and this theory was adopted to determine SMEs’ resource competitive strategies, which foster the participation in the downstream Ghanaian oil and gas industry. The fundamental principles of the resource-based view theory is that, companies gain competitive edge through the internal resources at their disposal. Barney (Citation2001) argues that, to be able to gain a competitive advantage through the internal resources of a company, the resource must be rare, must not be imitable, valuable, cannot be substituted and immobile. The resources can be either tangible or intangible. Tangible resources may include human resources, physical resources like plant, equipment, machine etc., financial resources, technological resources and other tangible assets. The intangible resources are those resources that cannot be touched like skills, knowledge, capability and reputation and others. One of the most important factors projected by the RBV is the core competency of a firm coupled with its resources, which equals competitive advantage (Connor, Citation2002). The bases for the RBV theory differ from the arguments made by Michael Porter’s five forces model that have formed the foundations of neoclassical economics. The RBV draws its perspective from three different areas; the traditional perspective, the competitive perspective and the contemporary perspective. The study adopted the RBV theory to explain the resource competitive strategies of SMEs in the downstream sector of the Ghanaian oil and gas industry. Drawing from the above, we propose that:
H4 the higher the resource competitive strategies the higher the SMEs investment intentions
H5 there is mediating effect of resources competitive strategy on the relationships between macro environment, industry forces oil and gas policy and investment strategy
3. Methodology
3.1. Research design
The study used quantitative research approach. This approach involves the use of numbers and estimation to measure the degree of occurrences (). This research approach was used due to the following reasons; it fulfils the collection of numerical data, it conforms to the objectivity conception of social reality, and it was based on positivist’s epistemology (Fox & Bayat, Citation2007). With respect to the research design, explanatory design was used. This study purposely was conducted to present a new model to identify and prioritize factors affecting SMEs’ investment intentions by integrating RBV Theory, Theory of Constraint and theory of strategic positioning. A cross survey was employed for this study since data were collected at a single time period i.e November 2017 to May 2018 unlike longitudinal, which requires time series data.
Figure 1. Research framework and hypotheses
3.2. Population and sampling design
The study sampled SMEs registered with the National Board for Small Scale Industries (NBSSI) in Ghana. Specifically, SMEs who were into services, retailing and manufacturing industries. The study followed J. F. Hair et al. (Citation2011) guidelines and procedures for selecting the respondents. That is, rule of ten was utilized. The rule of ten technically suggested that the minimum sample size must be ten (10) times higher than the total number of structural paths directed at the latent constructs i.e investment intentions. Following this rule, 50 minimum cases were enough as sample size for the study. Meanwhile 475 cases have been used in the present study. In terms case selection, stratified sampling technique was used in selecting the cases. For instance, using participants’ industry as strata, cases were selected randomly. This sampling technique is robust i.e. it reduces sampling error and ensures greater representatives.
3.3. Measurement instruments
Macro environment factor was measured using four sub-constructs; namely political, economic, socio-cultural and legal environment factors (Johnson et al., Citation2008). The resource competitive strategies were measured using three dimensions viz; entrepreneurial competency, financial resources and knowledge sharing consisting of 14 items (Islam et al., Citation2011). Sixteen items were used to measure industry environment forces (Johnson et al., Citation2008; Tavitiyaman, Citation2009), six items were used to measure oil and gas policy environment (K. M. Appiah et al., Citation2018a). The investment intentions were measured using six items (Islamoglu et al., Citation2015; Li, Citation2013; Soderlund & Ohman, Citation2003).
3.4. Administration of the research instruments
The questionnaires for the study were pre-tested before the actual survey was conducted. Thus, 10% (48) of the estimated 475 sample size was used. This was done to ensure that there was content validity, face validity and construct validity. The pretesting allowed modifications of the data collection instruments. The 5-pint likert scale ranged from Strongly Agree to Strongly Disagree and was coded 1 to 5. The study also covered some SME profiles such as including business age, investment capital, fixed assets, business size and legal status of business.
3.5. Analytical tool for structural model
Partial Least Squares (PLS) method was used for the data analysis, and the testing of the path hypothesis used the SmartPLS software 3.2.8 (Ringle et al., Citation2015). This technique is mostly used when the main goal of the study is to explain the variance of the target constructs. Since the determinants of SMEs’ investment intention are distribution free, exploratory in nature and focus in prediction (Chin, Citation2010; Ringle et al., Citation2005). Two approaches were deployed using PLS-SEM analyses i.e measurement estimation (outer) model and the structure (inner) model (Chin, Citation2010; J. F. Hair et al., Citation2011).
3.6. Structural equation modeling specifications
This study builds on Tabachnick and Fidell (Citation2007) basic algorithmic design and some extensions developed by Lohmoller (1989) as cited in Hooper et al. (Citation2008). In order to simplify the notation of the model and in line with conventional descriptions of PLS, we assume that latent and manifest variables are standardized so that the location parameters can be discarded in the following equations. Within the scope of structural equation modelling, the econometric model for the measurement model can be stated as follows: The formula for the first latent variable (Macro Environment Factors (MEF) that modelled as 20 indicators is formulated as:
3.7. Greek notation current notation (specific)
Ԛ1 = λ1 ζ1 + δ1 Ԛ1 = λ1 MEF + δ1 (4.1a)
Ԛ2 = λ2 ζ1 + δ2 Ԛ2 = λ2 MEF + δ2 (4.1b)
Ԛ3 = λ3 ζ1 + δ3 Ԛ3 = λ3 MEF + δ3 (4.1 c)
Ԛ4 = λ4 ζ1 + δ4 Ԛ4 = λ4 MEF + δ4 (4.1d)
Ԛ5 = λ5 ζ1 + δ5 Ԛ5 = λ5 MEF + δ5 (4.1e)
Ԛ6 = λ6 ζ1 + δ6 Ԛ6 = λ6 MEF + δ6 (4.1 f)
Ԛ7 = λ7 ζ1 + δ7 Ԛ7 = λ7 MEF + δ7 (4.1 g)
Ԛ8 = λ8 ζ1 + δ8 Ԛ8 = λ8 MEF + δ8 (4.1 h)
Ԛ9 = λ9 ζ1 + δ9 Ԛ9 = λ9 MEF + δ9 (4.1i)
Ԛ10 = λ10 ζ1 + δ10 Ԛ10 = λ10 MEF + δ10 (4.1 j)
Ԛ11 = λ11 ζ1 + δ11 Ԛ11 = λ11 MEF + δ11 (4.1k)
Ԛ12 = λ12 ζ1 + δ12 Ԛ12 = λ12 MEF + δ12 (4.1 l)
Ԛ13 = λ13 ζ1 + δ13 Ԛ13 = λ13 MEF + δ13 (4.1 m)
Ԛ14 = λ14 ζ1 + δ14 Ԛ14 = λ14 MEF + δ14 (4.1 n)
Ԛ15 = λ15 ζ1 + δ15 Ԛ15 = λ15 MEF + δ15 (4.1o)
Ԛ16 = λ16 ζ1 + δ16 Ԛ16 = λ16 MEF + δ16 (4.1p)
Ԛ17 = λ17 ζ1 + δ17 Ԛ17 = λ17 MEF + δ17 (4.1q)
Ԛ18 = λ18 ζ1 + δ18 Ԛ18 = λ18 MEF + δ18 (4.1 r)
Ԛ19 = λ19 ζ1 + δ19 Ԛ19 = λ19 MEF + δ19 (4.1s)
Ԛ20 = λ20 ζ1 + δ20 Ԛ20 = λ20 MEF + δ20 (4.1 t)
The formula for the second latent variable (Industry Environment Factors (IEF)) that modeled as 18 indicators is formulated as:
Ԛ21 = λ1 ζ2 + δ21 Ԛ21 = λ1 IEF + δ21 (4.2a)
Ԛ22 = λ2 ζ2 + δ22 Ԛ22 = λ2 IEF + δ22 (4.2b)
Ԛ23 = λ3 ζ2 + δ23 Ԛ23 = λ3 IEF + δ23 (4.2 c)
Ԛ24 = λ4 ζ2 + δ24 Ԛ24 = λ4 IEF + δ24 (4.2d)
Ԛ25 = λ5 ζ2 + δ25 Ԛ25 = λ5 IEF + δ25 (4.2e)
Ԛ26 = λ6 ζ2 + δ26 Ԛ26 = λ6 IEF + δ26 (4.2 f)
Ԛ27 = λ7 ζ2 + δ27 Ԛ27 = λ7 IEF + δ27 (4.2 g)
Ԛ28 = λ8 ζ2 + δ28 Ԛ28 = λ8 IEF + δ28 (4.2 h)
Ԛ29 = λ9 ζ2 + δ29 Ԛ29 = λ9 IEF + δ29 (4.2i)
Ԛ30 = λ10 ζ2 + δ30 Ԛ30 = λ10 IEF + δ30 (4.2 j)
Ԛ31 = λ11 ζ2 + δ31 Ԛ31 = λ11 IEF + δ31 (4.2k)
Ԛ32 = λ12 ζ2 + δ32 Ԛ32 = λ12 IEF + δ32 (4.2 l)
Ԛ33 = λ13 ζ2 + δ33 Ԛ33 = λ13 IEF + δ33 (4.2 m)
Ԛ34 = λ14 ζ2 + δ34 Ԛ34 = λ14 IEF + δ34 (4.2 n)
Ԛ35 = λ15 ζ2 + δ35 Ԛ35 = λ15 IEF + δ35 (4.2o)
Ԛ36 = λ16 ζ2 + δ36 Ԛ36 = λ16 IEF + δ36 (4.2p)
Ԛ37 = λ17 ζ2 + δ37 Ԛ37 = λ17 IEF + δ37 (4.2q)
Ԛ38 = λ18 ζ2 + δ38 Ԛ38 = λ18 IEF + δ38 (4.2 r)
The formula for the third latent variable (Resource Competitive Strategies (RCS)) that modelled as 13 indicators is formulated as:
Ԛ39 = λ1 ζ3 + δ39 Ԛ39 = λ1 RCS + δ39 (4.3a)
Ԛ40 = λ2 ζ3 + δ40 Ԛ40 = λ2 RCS + δ40 (4.3b)
Ԛ41 = λ3 ζ3 + δ41 Ԛ41 = λ3 RCS + δ41 (4.3 c)
Ԛ42 = λ4 ζ3 + δ42 Ԛ42 = λ4 RCS + δ42 (4.3d)
Ԛ43 = λ5 ζ3 + δ43 Ԛ43 = λ5 RCS + δ43 (4.3e)
Ԛ44 = λ6 ζ3 + δ44 Ԛ44 = λ6 RCS + δ44 (4.3 f)
Ԛ45 = λ7 ζ3 + δ45 Ԛ45 = λ7 RCS + δ45 (4.3 g)
Ԛ46 = λ8 ζ3 + δ46 Ԛ46 = λ8 RCS + δ46 (4.3 h)
Ԛ47 = λ9 ζ3 + δ47 Ԛ47 = λ9 RCS + δ47 (4.3i)
Ԛ48 = λ10 ζ3 + δ48 Ԛ48 = λ10 RCS + δ48 (4.3 j)
Ԛ49 = λ11 ζ3 + δ49 Ԛ49 = λ11 RCS + δ49 (4.3k)
Ԛ50 = λ12 ζ3 + δ50 Ԛ50 = λ12 RCS + δ50 (4.3 l)
Ԛ51 = λ13 ζ3 + δ51 Ԛ51 = λ13 RCS + δ51 (4.3 m)
Finally, the formula for the fourth latent variable (Oil and Gas Policy Environment (OGPE)) that modelled as 6 indicators is formulated as:
Ԛ52 = λ2 ζ4 + δ52 Ԛ52 = λ2 RCS + δ52 (4.4a)
Ԛ53 = λ2 ζ4 + δ53 Ԛ53 = λ2 RCS + δ53 (4.4b)
Ԛ54 = λ3 ζ4 + δ54 Ԛ54 = λ3 RCS + δ54 (4.4 c)
Ԛ55 = λ4 ζ4 + δ55 Ԛ55 = λ4 RCS + δ55 (4.4d)
Ԛ56 = λ5 ζ4 + δ56 Ԛ56 = λ5 RCS + δ56 (4.4e)
Ԛ57 = λ6 ζ4 + δ57 Ԛ57 = λ6 RCS + δ57 (4.4 f)
As indicated in the first to fourth latent variables, the observed variables are denoted by Q1 to Q57, λ represents the factor loadings or observed variables under latent variables where δ denotes the error measurement of the model. In addition to the above, to determine the second latent observed variable for investment intentions (II), the formula was stipulated in the equation below: The general notation of the formula is written as:
η1 = λ1 1ζ1 + λ2 1ζ2 + λ3 1ζ3 + λ4 1ζ4 + δ1 (4.5a)
The above formula can be written in reflective measurement model-specific notation as:
II = λ1 1MEF1 + λ2 1IEF2 + λ3 1RCS3 + λ4 1OGPE4 + δ1 (4.5b)
The formula for formative measurement model is given as:
η1 = Ϗ1 1ζ1 + Ϗ2 1ζ2 + Ϗ3 1ζ3 + Ϗ4 1ζ4 + ϛ (4.6a)
The above formula can be written in formative measurement model-specific notation as:
II = Ϗ1 1MEF + Ϗ2 1IEF + Ϗ3 1RCS + Ϗ4 1 OGPE + ϛ (4.6b)
The formula for first structural model with two dependent variables using Greek notation can be set up as follows:
Y1 = Ϗ1 η1 + Ϗ1 1 × 1 + Ϗ2 1 × 2 + Ϗ3 1 × 3 + Ϗ4 1 × 4 + ϛ (4.7a)
We formulate the formula for the first endogenous variables as follows:
INVINT = Ϗ1 1MEF + Ϗ2 1 IEF + Ϗ3 1 RCS + Ϗ4 1 OGPE + ϛ (4.7b)
Then, we formulate the formula for the second endogenous variables as follows:
RCS = Ϗ1 1MEF + Ϗ2 1 IEF + Ϗ3 1 OGPE + ϛ (4.7 c)
As shown above, the observed variables are donated by η1 (exogenous variable), x1 until x4 donated observed variables (exogenous variable), Ϗ is an estimated value of the second and observed variable (x1 to x4) to latent variable (Endogenous variable—y1) and ϛ denoted the error measurement of the model.
4. Results and discussions
4.1. Exploratory factor analysis (EFA)
Under this section, the EFA is conducted to determine the suitability of the data set for statistical modelling. There are some basic requirements for conducting EFA, and as suggested by F. Hair et al. (Citation2014), the matrix data should have sufficient inter items correlation. The principal component analysis (PCA) with direct Oblimin rotation was utilized to check the dimensionality of the scales to further reduce weaker variables for robust analysis. As established in extant literature, a large number of statistical indices have been recommended to determine the suitability of factor analysis. These include Kaiser-Meyer-Oklin (KMO), Bartlett’s Tests of Sphericity (BTOS), Measure of Sample Adequacy (MSA), and eigenvalues were used to check the appropriateness of the data for PCA. In this study, PCAs have been conducted for the following constructs; macro-environment factors, industry environment forces, oil and gas policy environment, resource competitive strategies and investment intention. In all cases, poor factor loading items were removed, and cross loading were also removed to enhance the quality of the model.
4.2. EFA for macro environment forces
As indicated in , EFA results showed that the overall Kaiser-Meyer-Oklin value was 0.905 and Bartlett’s Tests of Sphericity score was highly significant (p-value < 0.01). Moreover, as it can be observed from the reproduced structure matrix, no item was removed based on the communalities’ results ranged from 0.92 to 0.613, which exceeded the recommended minimum value suggested by F. Hair et al. (Citation2014) which is 0.5 or better. The Oblimin rotation with Kaizer normalization results further indicated that macro environment forces produced three factors with eigenvalue exceeding 1. These three factors accounted for 59.303% of the total variances in the items. These three factors have factor loading s ranging between 0.92 and 0.74 thus exceeding the minimum recommended value of 0.6 (Sekaran & Bougie, Citation2010). The factors were accepted for showing satisfactory and reliability. The extracted factors were named accordingly. The first factor had 11.861 eigenvalue, which accounted for 59.30% of the variance, which included ten items relating to economic and legal environment forces. The second factor had an eigenvalue = 2.65, which accounted for 13.22% of the total variation included five items relating to socio-cultural forces. The third factor had an eigenvalue of 1.153, which accounted for 5.77% of the total variance included in five items relating to political forces. From the presentation above, three out of the four original names had been retained. The factor 1 is economic environment, factor 2 is socio-cultural and factor 3 is political forces. As shown in , the macro environment forces results had indicated the appropriateness of the EFA.
Table 1. EFA on macro environment forces
4.3. EFA for resource competitive strategies
As indicated in the , EFA results showed that the overall Kaiser-Meyer-Oklin value was 0.865, and Bartlett’s Tests of Sphericity score was highly significant (p-value < 0.01). Again, the communalities’ results ranged from 0.676 to 0.501, which exceeded the recommended minimum value suggested by F. Hair et al. (Citation2014) which is 0.5 or better.
Table 2. EFA for dimensions of resource competitive strategies
The Oblimin rotation with Kaizer normalization results further indicated that resource competitive strategies produced two factors with eigenvalue exceeding 1. These two factors accounted for 58.23% of the total variances in the items. These two factors have factor loadings ranging from 0.94 to 0.607 thus exceeding the minimum recommended value of 0.6 (Sekaran & Bougie, Citation2010). The factors were accepted for showing satisfactory and reliability. The extracted first factor had eigenvalue = 7.57, which accounted for 58.23% of the variance, which included 10 items relating to entrepreneurial financing. The second factor had an eigenvalue = 1.42, which accounted for 10.92% of the total variation included 4 items relating to knowledge sharing. The factors had retained their names for instance factor 1 is entrepreneurial financing and factor 2 is knowledge sharing. As shown in , the resource competitive strategies’ results had indicated the appropriateness of performing EFA.
4.4. EFA for industry environment forces
As indicated in , EFA results showed that the overall Kaiser-Meyer-Oklin value was 0.956 showing that the items were interrelated, and they shared common factors and Bartlett’s Tests of Sphericity score was highly significant (p-value < 0.01) pointing to the significance of the correlation matrix and therefore the appropriateness for factor analysis.
Table 3. EFA for industry environment forces
The communalities extraction values ranged from 0.813 to 0.504, which exceeded the recommended minimum value suggested by F. Hair et al. (Citation2014) which is 0.5 or better. The Oblimin rotation with Kaizer normalization results further indicated that industry environment forces produced a single factor with eigenvalue of 9.55. The component pattern matrix loadings for the items generally ranged from 0.822 to 0.71, again indicating that the data matrix was suitable for factor analysis thus exceeding the minimum recommended value of 0.6 (Sekaran & Bougie, Citation2010). Since the items were unidimensional, the extracted solution could not be rotated.
4.5. EFA for oil and gas policy environment
As shown in , EFA results indicated that the Kaiser-Meyer-Oklin value was 0.836 showing that the items were interrelated and they shared common factors. Bartlett’s Tests of Sphericity score were highly significant (p-value < 0.01) pointing to the significance of the correlation matrix and therefore the appropriateness for factor analysis. The communalities extraction values ranged from 0.77 to 0.64, which exceeded the recommended minimum value suggested by F. Hair et al. (Citation2014), which is 0.5 or better.
Table 4. EFA on oil and gas policy environment
The Oblimin rotation with Kaizer normalization results further indicated that oil and gas policy environment produced a single factor with eigenvalue of 4.32. The component pattern matrix loadings for the items generally ranged from 0.87 to 0.79, again indicating that the data matrix was suitable for factor analysis thus exceeding the minimum recommended value of 0.6 (Sekaran & Bougie, Citation2010). Since the items were unidimensional, the extracted solution could not be rotated.
4.6. EFA for investment intentions
As shown in , EFA results indicated that the Kaiser-Meyer-Oklin value was 0.87 showing that the items were interrelated and they shared common factors. Bartlett’s Tests of Sphericity score was highly significant (p-value < 0.01) pointing to the significance of the correlation matrix and therefore the appropriateness for factor analysis. The communalities extraction values ranged from 0.74 to 0.61 which exceeded the recommended minimum value suggested by F. Hair et al. (Citation2014) which is 0.5 or better. The Oblimin rotation with Kaizer normalization results further indicated that oil and gas policy environment produced a single factor with eigenvalue of 3.9. The component pattern matrix loadings for the items generally ranged from 0.86 to 0.78, again indicating that the data matrix was suitable for factor analysis thus exceeding the minimum recommended value of 0.6 (Sekaran & Bougie, Citation2010). Since the items were (unidimensional) singly extracted, the solution could not be rotated.
Table 5. EFA for investment intentions
4.7. Convergent validity and discriminant validity
Convergent validity and discriminant validity were used to assess the model effectiveness. The study had assessed convergent validity using Average Variance Extracted (AVE ≥0.5) and composite reliability (C.R ≥ 0.70) as suggested by Fornell and Larcker (Citation1981). F. Hair et al. (Citation2014) suggested that rho_A values can be used to further assess CR scores. As demonstrated in , all the AVEs were greater than 0.50 i.e. the AVEs ranged from 0.549 to 0.663. The CR values were greater than the recommended minimum value of 0.70 i.e the CR values ranged from 0.88 to 95 establishing a satisfactory AVE and CR. Using Fornell and Larcker (Citation1981) guidelines the square roots of the AVE constructs must be higher than the inner constructs. As illustrated in the square roots of the AVE constructs were higher than the correlation of the inner constructs. Furthermore, rho_A values were of the range 0.903 to 0.983. Having achieved satisfactory discriminant validity and convergent validity, the present study proceeded with the path estimation.
Table 6. Convergent validity and discriminant validity Fornell-Larcker criterion
4.8. Hypothesis testing
presents the results of the partial least square and hypothesized testing. The survey results showed that six (6) out of the seven (7) hypotheses are confirmed as indicated in Table 5.18. The predictive power of the model was 84.3% and 73.4%, respectively, for resource competitive strategies and investment intentions. The model had been empirically supported. Thus, macro environment forces (political, economic, legal environment and socio-cultural factors), industry environment forces (threat of entry, power of customers, power of suppliers and competitive rivalry) and oil and gas policy environment forces exert significant influence on resources competitive strategies. Likewise, macro environment forces, oil and gas policy environment forces and resources competitive strategies exert significant influence on SMEs’ investment intentions in Ghana’s downstream oil and gas sector.
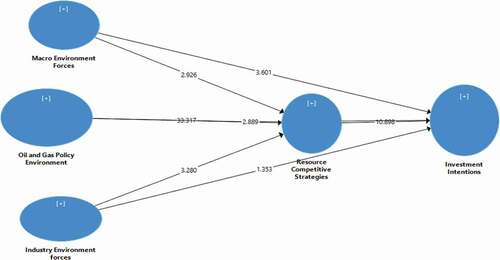
H1 is supported macro environment forces significantly (β = 0.081, p < 0.000 and T-statistics 3.601) relate to SMEs investment intentions in Ghana’s downstream oil and gas sector; H2 is not supported industry environment forces insignificantly (β = —0.044, p > 0.000 and T-statistics = 1.353) relate to SMEs investment intentions in Ghana’s downstream oil and gas sector; H3 is supported oil and gas policy environment significantly (β = 0.153, p < 0.005 and T-statistics = 2.889) relate to SMEs investment intentions in Ghana’s downstream oil and gas sector; H4 is supported resource competitive strategies significantly (β = 0.660, p < 0.005 and T-statistics = 10.898) relate to SMEs investment intentions in Ghana’s downstream oil and gas sector.
Table 7. Partial least squares results and hypothesis testing
4.9. Mediating role of resource competitive strategies
presents the mediating role of resource competitive strategies on macro environment forces, industry environment forces and oil and gas policy environment. There are three hypotheses that are tested with these regard. The H8 is supported resource competitive strategies significantly (β = 0.054, p < 0.006 and T-statistics = 2.781) and mediated the relationship between macro environment forces and investment intentions. The H9 is supported resource competitive strategies significantly (β = 0.070, p < 0.001 and T-statistics = 2.781) and mediated the relationship between industry environment forces and investment intentions. The H10 is supported resource competitive strategies significantly (β = 0.526, p < 0.000 and T-statistics = 0.000) mediate the relationship between oil and gas policy environment and investment intentions .
Table 8. Mediating role of resource competitive strategies
Figure 2. Investment strategy structural model
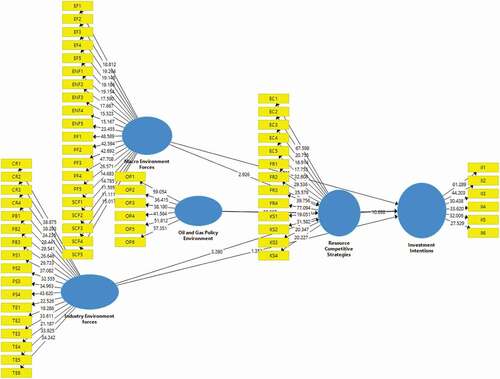
Figure 3. The hypothesized results
4.10. Confirmatory factor analysis
Traditional statistical methods usually use a single statistical test to determine the significance of the analysis. However, structural equation modelling (SEM), and in particular CFA, relies on multiple statistical tests to determine the fit of the model to the data. The chi-square test indicates the size of the difference between the expected and observed covariance matrices. A chi-square value close to zero indicates a small difference between expected and observed covariance matrices. In addition, the probability level should be greater than 0.05, if the chi-square is close to zero. As indicated in , five main criteria were used to determine the overall model fit for the structural model. Namely, Chi-square/degree of freedom standardized mean square values (SRMR), Normed Fit Index (NFI), Geodesic Distance (d_G), Geodesic Distance (d_G) and Squared Euclidean Distance (d_ULS). SmartPLS had provided 3.0 as recommended minimum value for chi square test and 0.080 as the minimum value for SRMR. From the study, chi square for the study was 2.355 and 0.080 for SRMR, NFI was 0.946, d_ULS was 0.335 while d_G was 0.345, which showed acceptable value for the proposed model (Hooper et al., Citation2008 Salloum et al., 2019). This indicates that the research model is of good fit.
Table 9. Model fit indices for subscale from confirmatory factor analysis
5. Discussions
The study finds that H1 supports macro environment forces significantly (β = 0.081, p < 0.000 and T-statistics 3.601) and relates to SMEs investment intentions in Ghana’s downstream oil and gas sector. Drawing from the theory Strategic positioning the business environment is extensively influenced by external factors like political, economic, social, technological and among others, stakeholders and expectations (Johnson et al., Citation2008). Johnson et al. (Citation2008) belief that, the macro-external factors as well as competitors, market systems, control the business environment and industry factors hence the need for the strategic positioning theory. The researcher limited the discussion in this study to strategic positioning theory in relation to the macro-environmental factors. The macro-environment is the elements that influence every aspect of the business (Johnson et al., Citation2008). To this end, the study has established that the theory of strategic positioning is consistent with the findings of the study.
The study finds that H2 does not support industry environment forces insignificantly (β = —0.044 p > 0.000 and T-statistics = 1.353) and relates to SMEs investment intentions in Ghana’s downstream oil and gas sector. Relating the findings to previous studies, Porter argues that the five forces model provides a greater insight to identify and analyze the competitive factors that influences the business industry (Porter, Citation1980a). The main rational behind industry forces is that, companies also use internal resources to achieve a success (Kim et al., Citation2004; MK. Appiah et al., Citation2021). The competitiveness within an industry is governed by five main forces; the bargaining power of suppliers, the bargaining power of customers, the bargaining power of consumers, competitive to rivalry and the threat of new entries. Thus, forces that control an environment influence its market environment (Hibbets et al., Citation2003). The results have failed to show consistency with the Porter’s five forces model.
The study finds that H3 supported oil and gas policy environment significantly (β = 0.153, p < 0.005 and T-statistics = 2.889) and relate to SMEs investment intentions in Ghana’s downstream oil and gas sector, which is again consistent with the theory of strategic positioning. Previously, studies have reported that, policy environment influences business decisions and choices. Appiah et al. (K. M. Appiah et al., Citation2018a) and Strachan et al. (Citation2000) emphasized how policy environment determines behavioural performance of businesses. Using a spatial panel approach, Georgellis and Wall (Citation2004) highlighted the impact that government policy environment have on entrepreneurship. Macro-environmental factors like inflation, interest rates, foreign direct investments, taxation and others have a toll on the investment decisions of SMEs. In the same way, Christensen and Goedhuys (Citation2004) reported that national conditions influence the behaviour of SMEs and determine their performance. Christensen and Goedhuys indicated that, the policy environment is a major obstacle to SMEs and new businesses, and these obstacles are in the areas of labour cost, taxation and labour regulations.
The study finds that H4 is supported resource competitive strategies significantly (β = 0.660, p < 0.005 and T-statistics = 10.898) relate to SMEs investment intentions in Ghana’s downstream oil and gas sector which is consistent with the RBV theory. The study finds H5 is supported there is mediating effect of resources competitive strategy on the relationships between macro environment, industry forces oil and gas policy and investment strategy. The H5a is supported resource competitive strategies significantly (β = 0.054, p < 0.006 and T-statistics = 2.781) mediate the relationship between macro environment forces and investment intentions. The H5b is supported resource competitive strategies significantly (β = 0.070, p < 0.001 and T-statistics = 2.781) mediate the relationship between industry environment forces and investment intentions. The H5c is supported resource competitive strategies significantly (β = 0.526, p < 0.000 and T-statistics = 0.000) mediate the relationship between oil and gas policy environment and investment intentions. These results corroborate with previous reports. As an example instance Barney (Citation2001) argues that, to be able to gain a competitive advantage a company resource must be rare, must not be imitable, valuable, cannot be substituted and immobile. These resources can be either tangible or intangible. Tangible resources may include human resources, physical resources like plant, equipment, machine etc., financial resources, technological resources and other tangible assets. The intangible resources are those resources that cannot be touched like skills, knowledge, capability and reputation and others. Businesses that amass these resources have the capacity to control the market and gain competitive edge over its competitors. One of the most important factors projected by the RBV is the core competency of a firm coupled with its resources, which equals competitive advantage (Connor, Citation2002).
6. Conclusions and implications
This study has been conducted to identify and prioritize factors affecting Small and Medium Enterprises (SMEs) investment intentions by integrating RBV Theory, Theory of Constraint and theory of strategic positioning. The major findings of the study are that macro environment factors, resource competitive strategies and oil and gas policy-specific factors were significant determinants of SMEs investment intentions. Again, the study revealed that the resource competitive strategies significantly mediate the relationship between macro environment factors, industry forces oil and gas policy support and investment intentions. These results are robust and consistent with resource-based view, theory of constraint and theory of strategic positioning. Moreover, these results contribute new knowledge towards developing investment strategy for the downstream oil and gas industry. Besides, these findings are important for policy makers to renew commitment and provide the needed framework to investors to enhance indigenous participation in the industry. SMEs can also be massively supported by the government of Ghana, World Bank Group, International Monetary Fund (IMF) to successfully partake in the oil and gas business.
7. Suggested areas for further studies
This study focused entirely on SMEs, which are basically made up micro, small and medium enterprises. The study suggests that future studies should take large firms into consideration . Particularly, comparative studies between the large firms and SMEs must be considered to ascertain the variability in investment intentions in the oil and gas sector. Besides, this study covered all the SMEs industry in Ghana. It is suggested that future researchers concentrate on specific industries and determine their investment intentions and compare the results. Geographically, this study is limited to Ghanaian SMEs; this could be replicated in other oil- producing countries such as Nigeria, Uganda, Russia, Ukraine, Denmark, Indonesia and Malaysia. Moreover, it is suggested that future studies should take into consideration the size of the company, industry differences, country-specific factors amongst other pertinent issues with regards to investment intentions in the oil and gas sector.
Additional information
Funding
Notes on contributors
Michael Karikari Appiah
Michael Karikari Appiah (Ph.D.) is a Lecturer at the School of Sustainable Development, University of Environment and Sustainable Development in Ghana. Michael does research in energy economics, environmental economics and policy, renewable energy resources and technologies, development economics, management and sociology. His current project is “Modelling SMEs Investment Strategies to Enhance Participation in Oil and Gas Industry”.
Bayu Taufiq Possumah
Bayu Taufiq Possumah (Ph.D.) is senior lecturer at the School of Social and Economic Development, Universiti Malaysia Terengganu, Malaysia. His research interests include; economics, Islamic finance and econometrics.
References
- Abor, J., & Quartey, P. (2010). Issues in SME development in Ghana and South Africa. International Research Journal of Finance and Economics, 39, 218–22.
- Abuka, C. A., Egesa, K. A., Atai, I., & Obwona, M. (2006). Firm-level investment: Trends, determinants and constraints: Research series no.47. Economic Policy Research Centre (EPRC), Makerere University.
- Adamchak, S. E. (1997). Assessing the policy environment: What influences population policy? Available from: http://www.policyproject.com/policycircle/documents/regulationsAndPolicyIssues.pdf
- Adusei, M., & Appiah, S. (2011). Determinants of group lending in the credit union industry in Ghana. Journal of African Business, 12(2), 238–251. https://doi.org/https://doi.org/10.1080/15228916.2011.588914
- Anderson, E., Elbersen, B., Godeschalk, F., & Verhoog, D. (2007). Farm management indicators and farm typologies as a basis for assessments in a changing policy environment. Journal of Environmental Management, 82(3), 353–362.
- Appiah, K. M., Possumah, B. T., Ahmat, N., & Sanusi, N. A. (2018a). External environment and SMEs investment in the Ghanaian oil and gas sector. Economics and Sociology, 11(1), 124–138. https://doi.org/https://doi.org/10.14254/2071-789X.2018/11-1/8
- Appiah, K. M., Possumah, B. T., Ahmat, N., & Sanusi, N. A. (2018b). Applicability of theory of constraint in predicting Ghanaian SMEs investment decisions. Journal of International Studies, 11(2), 202–221. https://doi.org/https://doi.org/10.14254/2071-8330.2018/11-2/14
- Appiah, K. M., Possumah, B. T., Ahmat, N., & Sanusi, N. A. (2018c). Policy environment and small and medium enterprises investment. in the ghanaian oil and gas industry international. Journal of Energy Economics and Policy, 8(4), 244–253.
- Appiah, K. M., Possumah, B. T., Ahmat, N., & Sanusi, N. A. (2019). Do SMEs internal resources affect their investment decisions? Empirical evidence from Ghana. Economics and Sociology, 12(3), 37–50. https://doi.org/https://doi.org/10.14254/2071-789X.2019/12-3/3
- Appiah, M. K., Possumah, B. T., Ahmat, N., & Sanusi, N. A. (2021). Do industry forces affect small and medium enterprise’s investment in downstream oil and gas sector? Empirical evidence from Ghana. Journal of African Business, 22(1), 42–60. https://doi.org/https://doi.org/10.1080/15228916.2020.1752599
- Aryeetey, E. (1994). “Supply and demand for finance of small enterprises in Ghana. World Bank discussion paper 251, The World Bank, Washington, D.C.
- Ayaggari, M., Beck, T., & Demirgue-Kunt, A. (2013) “Small and medium enterprises across the globe: A new database”. World Bank Development Research Group. Working Paper 3127. Washington DC.
- Baker, H. K., & Haslem, J. A. (1973). Information needs of individual investors. Journal of Accountancy, 136(5), 64–69.
- Barney, J. B. (2001). Resource-based theories of competitive advantage: A ten-year retrospective on the resource-based view. Journal of Management, 27(6), 643–650. https://doi.org/https://doi.org/10.1177/014920630102700602
- Brown, E., Cory, K., & Arent, D. (2007). Understanding and informing the policy environment: State-level renewable fuels standards, Technical Report
- Caesar, C., & Vilar, L. (2010). Effect of SMEs’ international experience on foreign intensity and economic performance the role of internationally exploitable mediating assets and competitive strategy. Journal of Small Business Management, 48(2), 116–151. https://doi.org/https://doi.org/10.1111/j.1540-627X.2010.00289.x
- Chin, W. W. (2010). Bootstrap cross-validation indices for PLS path model assessment. In V. Esposito Vinzi,W. W. ChinJ. Henseler,&H. Wang (Eds.), Handbook of partial least squares: Concepts, methods and applications (pp. 83–97). Springer.
- Christensen, J. D., & Goedhuys, M. (2004). Impact of national policy and legal environments on employment growth and investment in micro and small enterprises. Series on Conducive Policy Environment for Small Enterprise Employment.
- Clark-Murphy, M., & Soutar, G. N. (2008). Do retail stockbrokers understand clients’ investment preferences? Journal of Financial Services Marketing, 13(2), 135–149. https://doi.org/https://doi.org/10.1057/fsm.2008.11
- Connor, T. (2002). The resource-based view of strategy and its value to practicing managers. Strategic Change, 11(6), 307–316. https://doi.org/https://doi.org/10.1002/jsc.593
- Fornell, C., & Larcker, D. F. (1981). Evaluating structural equation models with unobservable variables and measurement error. Journal of Marketing Research, 18(1), 39–50. https://doi.org/https://doi.org/10.1177/002224378101800104
- Fox, W., & Bayat, M. S. (2007). A guide to managing research (pp. 45). Juta Publications.
- Fullerton, R. R., Kennedy, A. F., & Widener, K. S. (2014). Lean manufacturing and firm performance: The incremental contribution of lean management accounting practices. Journal of Operations Management, 32(7–8), 414–428. https://doi.org/https://doi.org/10.1016/j.jom.2014.09.002
- Georgellis, Y., & Wall, H. J. (2004). Entrepreneurship and the policy environment. The Federal Reserve Bank of St. Louis Review, 88, 95–112.
- Göndör, M., & Nistor, P., (2012). Fiscal Policy and Foreign Direct Investment: Evidence from some Emerging EU Economies, 8th International Strategic Management Conference, Barcelona, Spain, p. 1155–1164,
- Hair, F., Sarstedt, M., Hopkins, L., & Kuppelwieser, V. (2014). Partial least squares structural equation modeling (PLS-SEM): An emerging tool for business research. European Business Review, 26(2), 106–121. https://doi.org/https://doi.org/10.1108/EBR-10-2013-0128
- Hair, J. F., Ringle, C. M., & Sarstedt, M. (2011). PLS-SEM: Indeed a silver bullet. Journal of Marketing Theory and Practice, 18(2), 139–152.
- Hibbets, A. R., Albright, T., & Funk, W. (2003). The competitive environment and strategy of target costing implementers: Evidence from the field. Journal of Managerial Issues, 15(1), 65–81.
- Hooper, D., Coughlan, J., & Mullen, M. (2008). Structural equation modelling: Guidelines for determining model fit. Electronic Journal of Business Research Methods, 6(1), 53–60.
- Inamete, U. B. (1993). Key elements in managing airports: The policy environment and increasing efficiency. International Journal of Public Sector Management, 6(5), 478–498. https://doi.org/https://doi.org/10.1108/09513559310043156
- Islam, M. A., Khan, M. A., Obaidullah, A. Z. M., & Alam, M. S. (2011). Effect of entrepreneur and firm characteristics on the business success of small and medium enterprises (SMEs) in Bangladesh. International Journal of Business and Management, 6(3), 289–299.
- Islamoglu, M., Apan, M., & Ayvali, A. (2015). Determination of factors affecting individual investor behaviours: A study on bankers. International Journal of Economics and Financial Issues, 5(2), 531–543.
- Itani, N., O’Connell, J. F., & Mason, K. (2014). A macro-environment approach to civil aviation strategic planning. Transport Policy, 33(C 125–135), 125–135. Issue. https://doi.org/https://doi.org/10.1016/j.tranpol.2014.02.024
- Johnson, G., Scholes, K., & Whittington, R. (2008). Exploring corporate strategy: Text and cases. Pearson Education.
- Kim, B. Y., Oh, H., & An, J. A.. (2004). The effect of customer-based brand equity on firms’ financial performance. Journal of Consumer Marketing, 20(4), 335–351. https://doi.org/https://doi.org/10.1108/07363760310483694
- Lah, O. (2017). Decarbonizing the transportation sector: Policy options, synergies, and institutions deliver on a low-carbon stabilization pathway. Wires Energy and Environment, 6(6), e257. https://doi.org/https://doi.org/10.1002/wene.257
- Lawal, W. A., & Ijaiya, M. A. (2007). Small and Medium Scale Enterprises Access to Commercial Banks‟ Credits and their Contributions to GDP in Nigeria. Asian Economic Review, Journal of the Indian Institute of Economics, 49(3), 360–368.
- Li, K. L. (2013) Investment intentions: A consumer behavior framework. The University of Western Australia. Thesis. The University of Western Australia.
- Litavniece, L., & Znotiņa, D. (2015). External Business Environment Problems and Opportunities In Rezekne City. Latgale National Economy Research, 1(7), 107–119. https://doi.org/https://doi.org/10.17770/lner2015vol1.7.1183
- Malone, R. E. M. (2005). Assessing the Policy Environment. Policy, Politics & Nursing Practice, 6(2), 135–143. https://doi.org/https://doi.org/10.1177/1527154405276141
- Medeshova, A., Amanturlina, G., & Sumyanova, E. (2016). Development of training skills in students as the precondition for educational competencies. International Journal of Environmental and Science Education, 11(17), 9649–9656.
- Menzies, L. J., & Orr, S. (2010). The impact of political behaviours on internationalisation: The case of Australian companies internationalising to China. Journal of Chinese Economic and Foreign Trade Studies, 3(1), 24–42. https://doi.org/https://doi.org/10.1108/17544401011016663 Issue
- Nagy, R. A., & Obenberger, R. W. (1994). Factors influencing individual investor behavior. Financial Analysts Journal, 50(4), 63–68. https://doi.org/https://doi.org/10.2469/faj.v50.n4.63
- Nwaizugbo, I. C., Aghara, V. N. O., & Oparah, P. C. (2013). Co-creating business development service: A strategic marketing approach for leveraging the performance of small and medium enterprises (SMEs) in Nigeria. International Journal of Small Business and Entrepreneurship Research, 1(3), 1–11.
- Olsen, M. D., & Roper, A. (1998). Research in strategic management in the hospitality industry. International Journal of Hospitality Management, 17(2), 111–124. https://doi.org/https://doi.org/10.1016/S0278-4319(98)00012-7
- Onugu, B. A. N. (2011) “Small and Medium Enterprises (SMEs) in Nigeria: Problems and prospects”. St. Clements University Dissertations and Theses, in (http://stclements.edu/grad/gradonug.pdf)
- Passemard, D., & Kleiner, B. H. (2000). Competitive advantage in global industries. Management Research News, 23(7/8), 111–117. https://doi.org/https://doi.org/10.1108/01409170010782307
- Porter, M. E. (1980). Competitive strategy: Techniques for analyzing industries and competitors. Free Press.
- Pustovoitov, V. N. (2014). The model of pedagogical support of cognitive competence development in high school students in the teaching and learning academic subjects. Modern Problems of Science and Education, 3, 77–82.
- Quartey, P., Turkson, E., Abor, J. Y., & Iddrisu, A. M. (2017). Financing the growth of SMEs in Africa: What are the constraints to SME financing within ECOWAS? Review of Development Finance, 7, 18–28.
- Ringle, C. M., Wende, S., & Becker, J. M. (2015). SmartPLS3. SmartPLSSmbH.http://www.smartpls.com
- Ringle, C. M., Wende, S., & Will, A. (2005). SmartPLS 2.0 Hamburg. www.smartpls.de
- Sekaran, U., & Bougie, R. (2010). Research methods for business: A skill-building approach (5th ed.). John Wiley & Sons.
- Snyman, J. A., & Saayman, M. (2009). Key factors influencing foreign direct investment in the tourism industry in South Africa. Tourism Review, 64(3), 49–58. Issue. https://doi.org/https://doi.org/10.1108/16605370910988827
- Soderlund, M., & Ohman, N. (2003). Behavioral intentions in satisfaction research revisited. Journal of Consumer Satisfaction, Dissatisfaction and Complaining Behavior, 16, 53–66.
- Strachan, M., Hardee, K., & Grey, G. (2000). Measuring the degree to which the policy environment in Jamaica supports effective policies and programs for reproductive health: 2000 follow-up results. The Policy Project.
- Tabachnick, B. G., & Fidell, L. S. (2007). Using multivariate statistics (5th ed.). Allynand Bacon.
- Tavitiyaman, P. (2009). The impact of industry forces on resource competitive strategies and hotel performance. Thesis. Oklahoma State University.
- Thompson, A., Arthur, A. J., Strickland, E., & Gamble, J. (2010). Crafting and executing strategy. The quest for competitive advantage: Concept and cases (Seventeenth Edition ed.). The McGraw Hill company.
- Wamono, R. N., Kikabi, P., & Mugisha, J. (2012). Constraints and opportunities for SMEs investment in Uganda’s oil and gas sector.